Home > Comparison > Financial Services > SCHW vs HUT
The strategic rivalry between The Charles Schwab Corporation and Hut 8 Corp. shapes the evolving landscape of financial services. Schwab dominates as a diversified wealth management and brokerage powerhouse, while Hut 8 operates a capital-intensive Bitcoin mining and data center business. This analysis pits Schwab’s stable, broad-based model against Hut 8’s high-volatility, tech-driven growth. I will determine which trajectory offers superior risk-adjusted returns for a diversified portfolio in today’s complex market environment.
Table of contents
Companies Overview
The Charles Schwab Corporation and Hut 8 Corp. are key players in the evolving financial capital markets.
The Charles Schwab Corporation: Comprehensive Wealth Management Leader
The Charles Schwab Corporation dominates retail brokerage and wealth management with a broad service portfolio. It earns revenue from Investor and Advisor Services, including brokerage, advisory, banking, and asset management. In 2021, its strategic focus was expanding personalized advice, proprietary ETFs, and integrated banking solutions, leveraging a vast network of 400 domestic branches for market penetration.
Hut 8 Corp.: Bitcoin Mining and Data Center Specialist
Hut 8 Corp. operates as a vertically integrated Bitcoin mining powerhouse, focusing on energy-efficient data centers. It generates revenue by designing, building, and managing infrastructure for compute-intensive workloads like Bitcoin mining and AI. The company’s 2026 strategy centers on scaling large-scale energy infrastructure and optimizing mining operations to capitalize on cryptocurrency market dynamics.
Strategic Collision: Similarities & Divergences
Schwab and Hut 8 both inhabit financial services but diverge sharply in approach. Schwab emphasizes a diversified, client-centric ecosystem with traditional capital markets services. Hut 8 pursues a niche in crypto-focused infrastructure with high operational leverage and volatility risk. Their battleground is the future of financial technology—Schwab in wealth management innovation, Hut 8 in blockchain computing. These differences define distinct investment risk and growth profiles.
Income Statement Comparison
This data dissects the core profitability and scalability of both corporate engines to reveal who dominates the bottom line:
| Metric | The Charles Schwab Corporation (SCHW) | Hut 8 Corp. (HUT) |
|---|---|---|
| Revenue | 26.8B | 162M |
| Cost of Revenue | 2.9B | 87M |
| Operating Expenses | 12.5B | -385M |
| Gross Profit | 23.9B | 76M |
| EBITDA | 12.8B | 529M |
| EBIT | 11.5B | 482M |
| Interest Expense | 3.8B | 30M |
| Net Income | 8.9B | 332M |
| EPS | 4.68 | 3.71 |
| Fiscal Year | 2025 | 2024 |
Income Statement Analysis: The Bottom-Line Duel
This income statement comparison reveals which company runs a more efficient and profitable corporate engine, key for investor insight.
The Charles Schwab Corporation Analysis
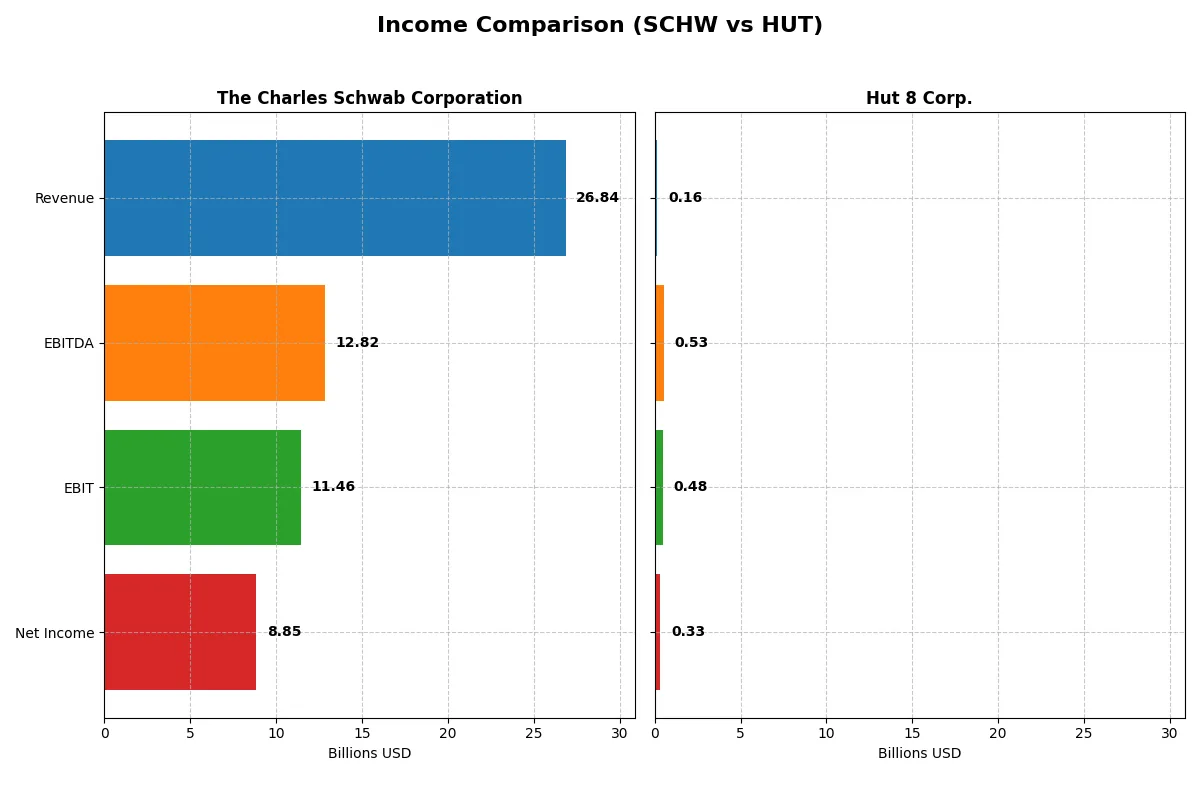
Schwab’s revenue climbed steadily to $26.8B in 2025, with net income reaching $8.85B. Gross margin remains robust at 89%, and net margin improved to 33%, reflecting excellent cost control and scale. The 2025 jump in EBIT by 49% signals strong operational momentum and capital allocation efficiency.
Hut 8 Corp. Analysis
Hut 8’s revenue surged 69% to $162M in 2024, with net income soaring to $332M. Gross margin sits at a healthy 47%, but the net margin at 204% suggests one-time items skew profitability. EBIT’s explosive 927% growth highlights rapid operational scaling, albeit from a smaller base with higher volatility risk.
Scale and Stability vs. Rapid Growth
Schwab delivers consistent scale and margin expansion, generating $8.85B net income on $26.8B revenue with steady margin improvement. Hut 8 impresses with rapid revenue and earnings growth but from a much smaller base and volatile earnings. Schwab’s stable, efficient profit engine suits risk-averse investors, while Hut 8 appeals to those seeking high-growth but riskier profiles.
Financial Ratios Comparison
These vital ratios act as a diagnostic tool to expose the underlying fiscal health, valuation premiums, and capital efficiency of the companies compared below:
| Ratios | The Charles Schwab Corporation (SCHW) | Hut 8 Corp. (HUT) |
|---|---|---|
| ROE | 12.3% (2024) | 34.0% (2024) |
| ROIC | 5.6% (2024) | 24.0% (2024) |
| P/E | 22.8 (2024) | 5.6 (2024) |
| P/B | 2.8 (2024) | 1.9 (2024) |
| Current Ratio | 0.54 (2024) | 1.67 (2024) |
| Quick Ratio | 0.54 (2024) | 1.67 (2024) |
| D/E (Debt-to-Equity) | 0.93 (2024) | 0.35 (2024) |
| Debt-to-Assets | 9.4% (2024) | 22.8% (2024) |
| Interest Coverage | 1.20 (2024) | 15.46 (2024) |
| Asset Turnover | 0.054 (2024) | 0.107 (2024) |
| Fixed Asset Turnover | 6.62 (2024) | 0.67 (2024) |
| Payout Ratio | 38.3% (2024) | 0% (2024) |
| Dividend Yield | 1.68% (2024) | 0% (2024) |
| Fiscal Year | 2024 | 2024 |
Efficiency & Valuation Duel: The Vital Signs
Financial ratios serve as a company’s DNA, exposing hidden risks and operational strengths behind surface-level figures.
The Charles Schwab Corporation
Schwab’s net margin at 33% signals strong profitability, yet ROE and ROIC stand at zero, indicating weak capital efficiency. The P/E of 20 is neutral, suggesting fair valuation, while a modest 1.08% dividend yield offers steady shareholder returns. However, a low current ratio flags liquidity concerns despite favorable debt metrics.
Hut 8 Corp.
Hut 8 impresses with a 204% net margin and a robust 34% ROE, showcasing operational efficiency. Its low P/E of 5.64 marks the stock as attractively valued. The company retains earnings for growth, paying no dividends. Healthy liquidity ratios and solid interest coverage reinforce financial stability despite some asset turnover weaknesses.
Premium Valuation vs. Operational Safety
Hut 8 offers superior profitability and a more favorable valuation profile than Schwab, with stronger liquidity and shareholder reinvestment. Schwab’s cautious dividend and fair P/E contrast with weaker capital returns and liquidity. Hut 8 suits investors seeking growth and operational strength, while Schwab fits those preferring income with moderate risk.
Which one offers the Superior Shareholder Reward?
I compare The Charles Schwab Corporation (SCHW) and Hut 8 Corp. (HUT) on shareholder returns through dividends and buybacks. SCHW delivers a 1.08% to 1.81% dividend yield with a conservative payout ratio around 22%-45%. Its buybacks add material value, sustaining a balanced distribution approach. HUT pays no dividend, focusing on reinvestment and growth amid volatile free cash flow and negative operating cash flow ratios. SCHW’s steady dividends combined with share repurchases offer more reliable total returns. I see SCHW as superior for long-term investors seeking consistent reward over HUT’s riskier reinvestment model.
Comparative Score Analysis: The Strategic Profile
The radar chart reveals the fundamental DNA and trade-offs of both firms, highlighting their core strengths and valuation challenges:
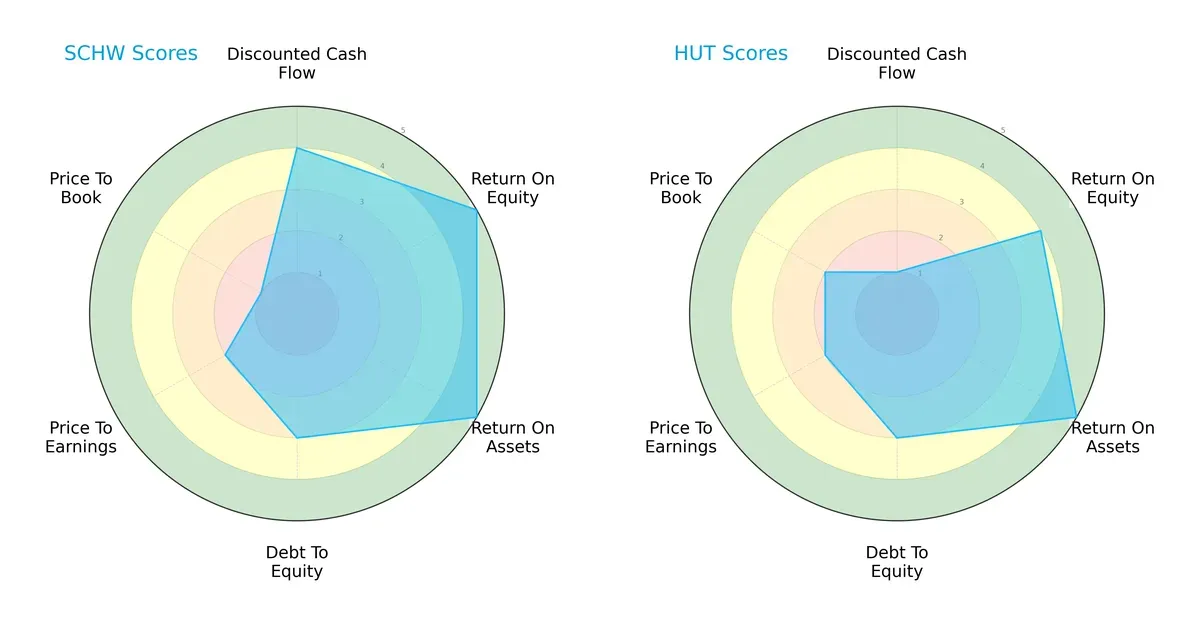
The Charles Schwab Corporation demonstrates a balanced profile with strong DCF (4), ROE (5), and ROA (5) scores, signaling efficient capital allocation and profitability. Hut 8 Corp. relies more on asset efficiency (ROA 5) but lags significantly in discounted cash flow (1), indicating weaker future cash flow visibility. Schwab’s weaker valuation scores (P/E 2, P/B 1) highlight potential market skepticism, while Hut 8 shows moderate valuation metrics. Overall, Schwab offers a more robust and diversified financial foundation.
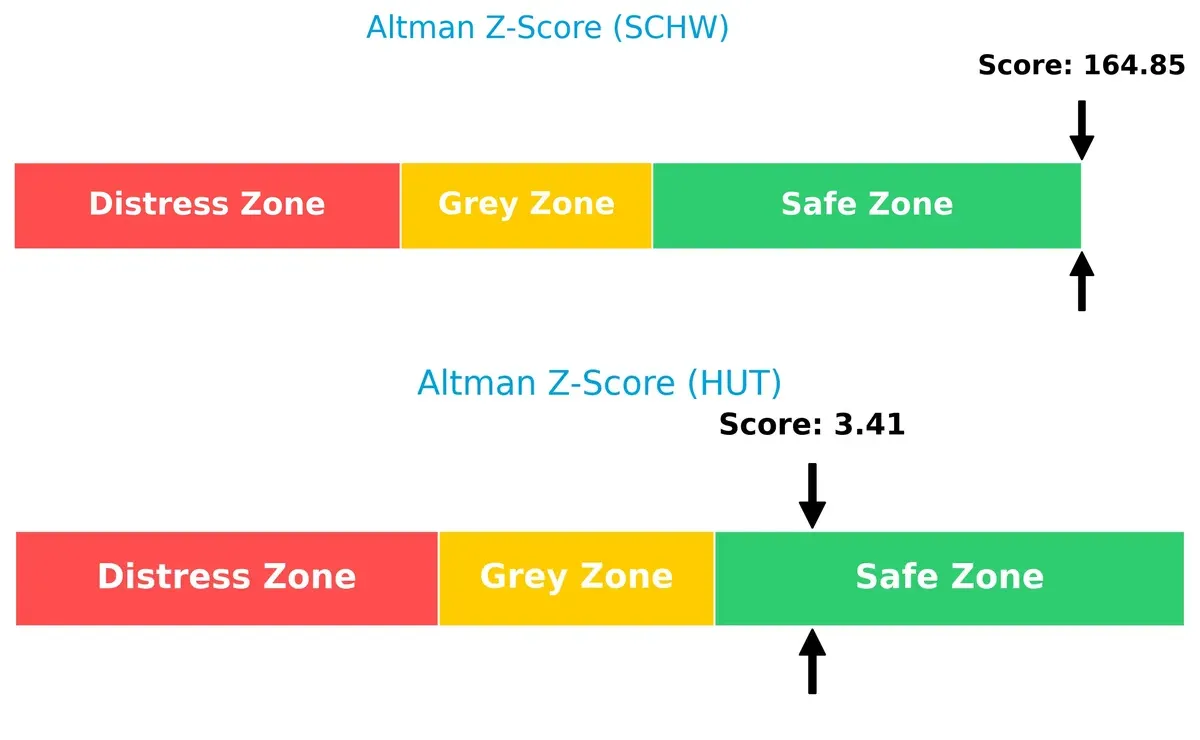
Bankruptcy Risk: Solvency Showdown
The Altman Z-Score delta indicates both firms reside in the safe zone, but Schwab’s extraordinary 165 score vastly surpasses Hut 8’s 3.4, underscoring Schwab’s far superior long-term solvency and resilience in volatile cycles:
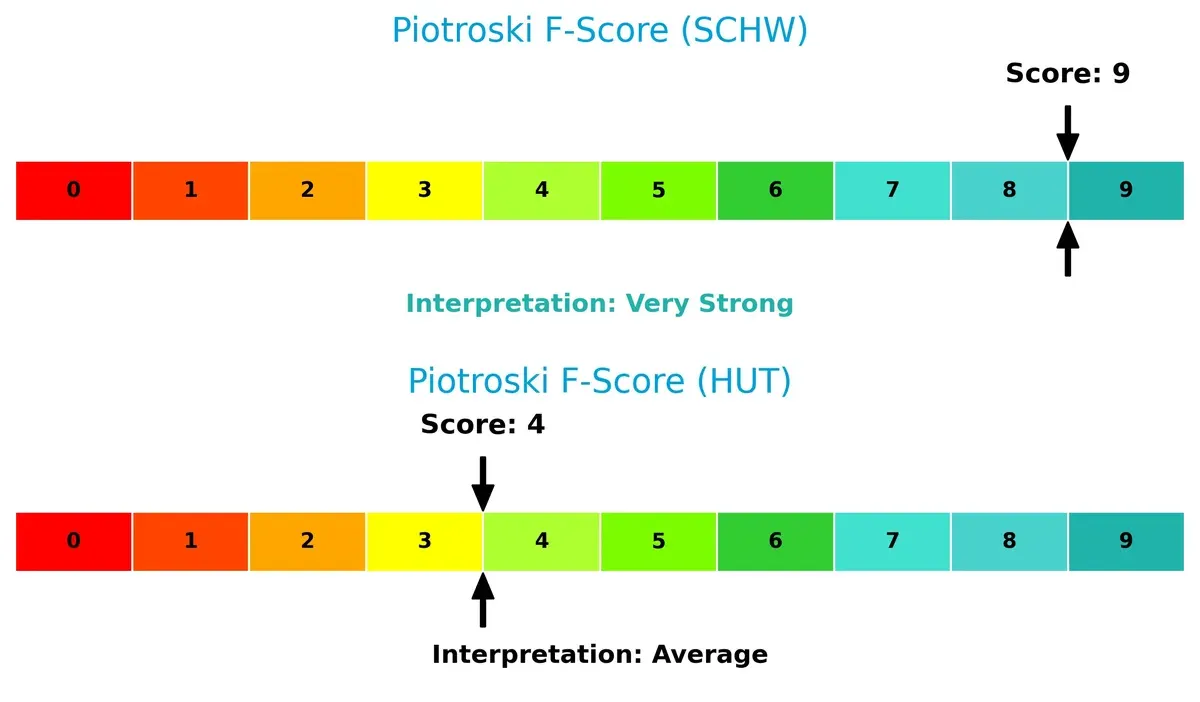
Financial Health: Quality of Operations
Schwab’s Piotroski F-Score of 9 signals peak financial health, reflecting strong profitability, liquidity, and operational efficiency. Hut 8’s score of 4 reveals average health, with potential red flags in internal metrics relative to Schwab’s rigorous standards:
How are the two companies positioned?
This section dissects the operational DNA of Schwab and Hut 8 by comparing their revenue distribution and internal dynamics. The goal is to confront their economic moats to identify which model offers the most resilient competitive advantage today.
Revenue Segmentation: The Strategic Mix
The following visual comparison dissects how The Charles Schwab Corporation and Hut 8 Corp. diversify their income streams and where their primary sector bets lie:
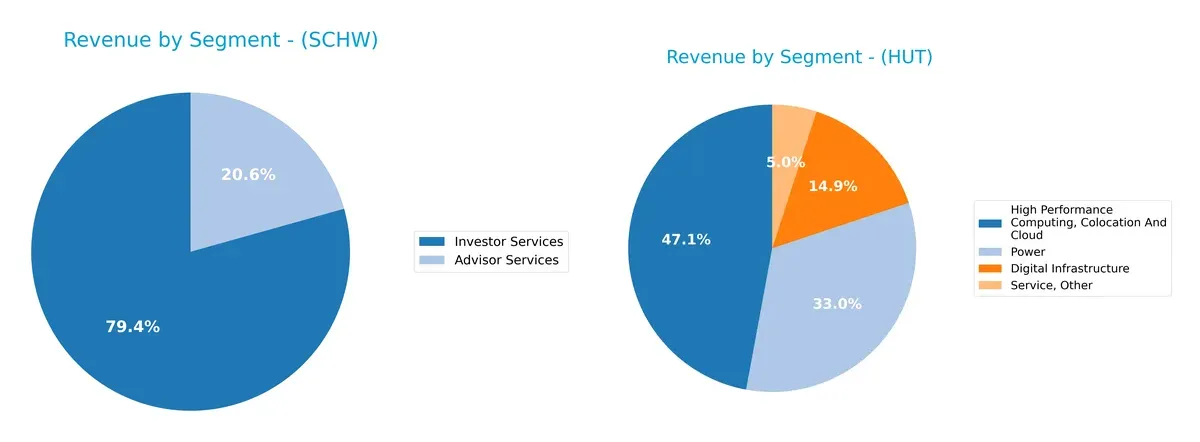
Charles Schwab anchors revenue heavily in Investor Services with $15.6B in 2024, while Advisor Services contribute $4.0B, showing moderate diversification. Hut 8 relies more evenly on Digital Infrastructure ($25.5M), High Performance Computing ($80.7M), and Power ($56.6M), reflecting a diversified tech-driven mix. Schwab’s concentration signals ecosystem lock-in in financial services, whereas Hut 8’s spread mitigates risk but limits scale dominance.
Strengths and Weaknesses Comparison
This table compares the Strengths and Weaknesses of The Charles Schwab Corporation and Hut 8 Corp.:
SCHW Strengths
- Strong diversification with Advisor and Investor Services segments
- Favorable net margin of 32.98%
- Favorable debt-to-equity and debt-to-assets ratios
HUT Strengths
- Favorable net margin of 204.38% and ROE of 33.98%
- Favorable liquidity ratios (current and quick at 1.67)
- Favorable interest coverage of 16.17
SCHW Weaknesses
- Unfavorable ROE and ROIC at 0%
- Unfavorable current and quick ratios at 0
- Unfavorable asset and fixed asset turnover ratios
- Slightly unfavorable overall ratio profile
HUT Weaknesses
- Unfavorable ROIC (24%) below WACC (31.84%)
- Unfavorable asset and fixed asset turnover
- No dividend yield reported
- Moderate leverage (debt-to-assets 22.76%)
Both companies exhibit strong profitability but face liquidity and efficiency challenges. SCHW shows conservative leverage but weak returns on capital. HUT’s high profitability contrasts with heavy capital costs and asset turnover inefficiencies, influencing their strategic focus on improving capital allocation and operational efficiency.
The Moat Duel: Analyzing Competitive Defensibility
A structural moat protects long-term profits from competitive erosion. Without it, market share and margins quickly erode:
The Charles Schwab Corporation: Intangible Assets and Scale Lock-In
Schwab’s moat stems from its trusted brand and vast retail-advisor network. This manifests in stable margins near 33% net and steady revenue growth. In 2026, expansion into digital advice deepens this moat, though rising interest expenses pose risks.
Hut 8 Corp.: Cost Advantage through Vertical Integration
Hut 8’s moat relies on cost-efficient Bitcoin mining infrastructure. Unlike Schwab’s brand moat, Hut 8 leverages operational scale to drive explosive revenue (up 69% YoY) and margin growth. Its expanding data centers could disrupt energy-intensive competitors in 2026.
Moat Strength Showdown: Brand Loyalty vs. Capital Efficiency
Schwab’s intangible asset moat offers durable client trust and stable profits, but its declining ROIC trend signals caution. Hut 8’s growing ROIC and aggressive cost advantage provide a sharper competitive edge. I see Hut 8 as better positioned to defend and expand market share amid technological shifts.
Which stock offers better returns?
The past year shows sharp price gains for both stocks, with marked acceleration and varying buyer-seller dynamics shaping their trading profiles.
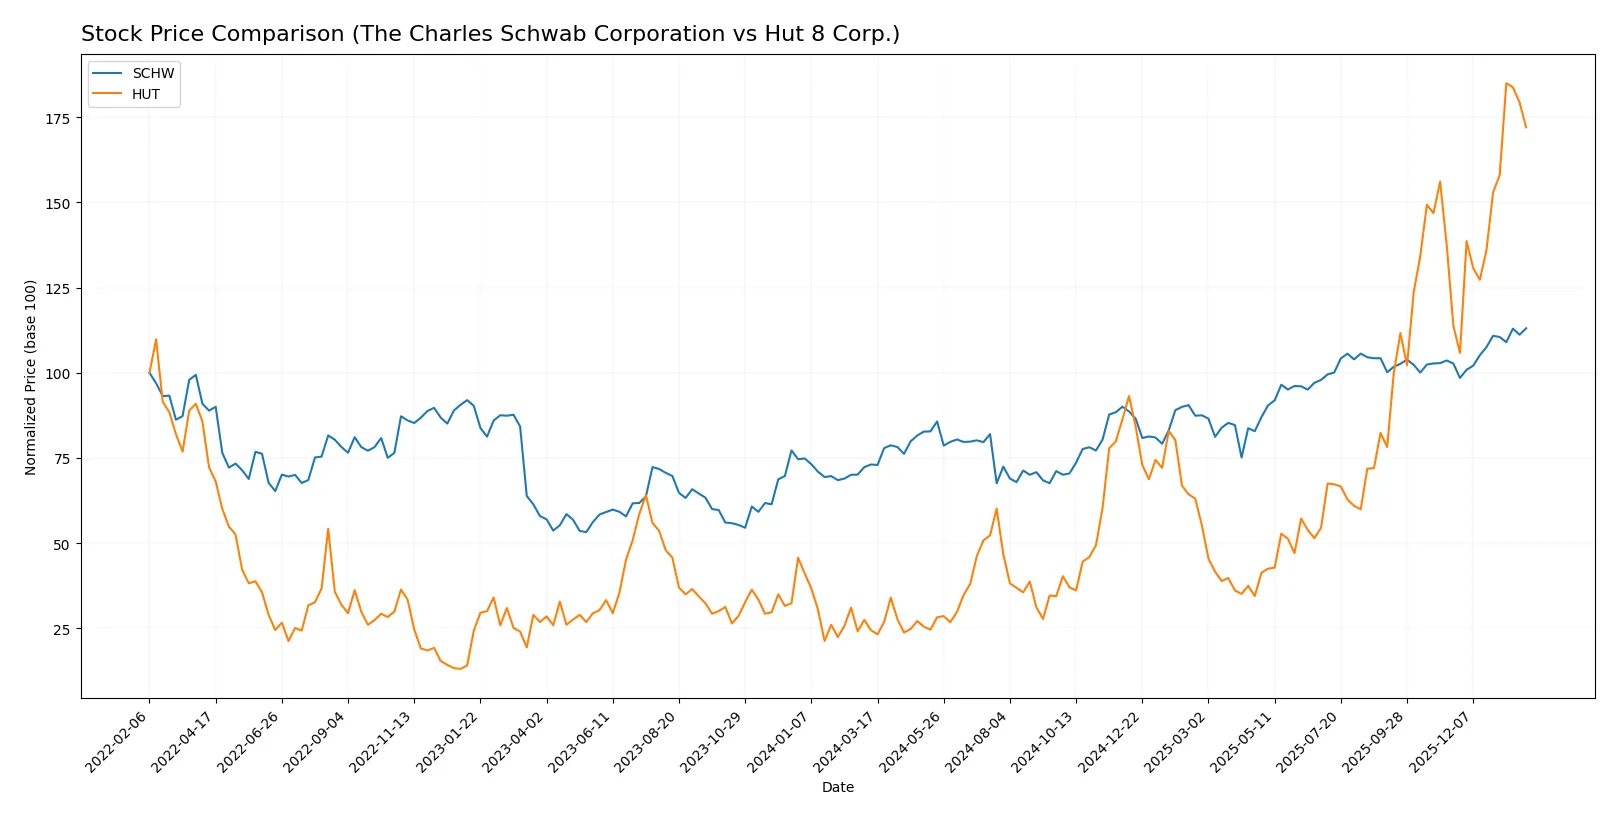
Trend Comparison
The Charles Schwab Corporation (SCHW) gained 54.71% over 12 months, showing a bullish trend with accelerating momentum and a high of 103.92. Volatility measured by a standard deviation of 11.65 signals moderate price fluctuations.
Hut 8 Corp. (HUT) surged 604.04% over the same period, also bullish with accelerating gains and a peak price of 60.04. Its higher standard deviation of 13.66 reflects greater volatility and risk.
HUT’s extraordinary 604.04% gain far outpaces SCHW’s 54.71%, delivering the highest market performance despite elevated volatility and recent seller dominance.
Target Prices
Analysts set a bullish consensus for both The Charles Schwab Corporation and Hut 8 Corp.
| Company | Target Low | Target High | Consensus |
|---|---|---|---|
| The Charles Schwab Corporation | 105 | 148 | 122.78 |
| Hut 8 Corp. | 55 | 85 | 70.1 |
The Charles Schwab Corporation’s target consensus exceeds its current price of 103.92, signaling upside potential. Hut 8 Corp.’s consensus of 70.1 also suggests room for growth beyond the current 55.83 price.

Don’t Let Luck Decide Your Entry Point
Optimize your entry points with our advanced ProRealTime indicators. You’ll get efficient buy signals with precise price targets for maximum performance. Start outperforming now!
How do institutions grade them?
The following tables summarize recent institutional grades for The Charles Schwab Corporation and Hut 8 Corp.:
The Charles Schwab Corporation Grades
This table shows recent grades from reputable financial institutions for SCHW:
| Grading Company | Action | New Grade | Date |
|---|---|---|---|
| Barclays | Maintain | Overweight | 2026-01-26 |
| Barclays | Maintain | Overweight | 2026-01-22 |
| TD Cowen | Maintain | Buy | 2026-01-22 |
| UBS | Maintain | Buy | 2026-01-22 |
| Truist Securities | Maintain | Buy | 2026-01-22 |
| Piper Sandler | Maintain | Neutral | 2026-01-14 |
| TD Cowen | Maintain | Buy | 2026-01-14 |
| Citizens | Maintain | Market Outperform | 2026-01-12 |
| Barclays | Maintain | Overweight | 2026-01-08 |
| Truist Securities | Maintain | Buy | 2026-01-07 |
Hut 8 Corp. Grades
This table shows recent grades from reputable financial institutions for HUT:
| Grading Company | Action | New Grade | Date |
|---|---|---|---|
| Keefe, Bruyette & Woods | Maintain | Outperform | 2026-01-27 |
| Needham | Maintain | Buy | 2026-01-16 |
| B. Riley Securities | Maintain | Buy | 2026-01-09 |
| Keefe, Bruyette & Woods | Maintain | Outperform | 2025-12-19 |
| Rosenblatt | Maintain | Buy | 2025-12-18 |
| Canaccord Genuity | Maintain | Buy | 2025-12-18 |
| Needham | Maintain | Buy | 2025-12-18 |
| BTIG | Maintain | Buy | 2025-12-17 |
| BTIG | Maintain | Buy | 2025-11-06 |
| Rosenblatt | Maintain | Buy | 2025-11-05 |
Which company has the best grades?
Both companies have strong institutional support with consistent buy and outperform ratings. Hut 8 Corp. shows a slight edge with multiple “Outperform” grades, reflecting bullish analyst sentiment that may attract growth-focused investors. The Charles Schwab Corporation maintains a solid “Buy” and “Overweight” consensus, signaling steady confidence from major banks. Investors should weigh these consistent positive grades against their portfolio goals.
Risks specific to each company
The following categories identify critical pressure points and systemic threats facing both firms in the 2026 market environment:
1. Market & Competition
The Charles Schwab Corporation
- Faces intense competition in wealth management and brokerage, pressured by fintech innovation and low-fee rivals.
Hut 8 Corp.
- Operates in highly volatile crypto mining, challenged by fluctuating Bitcoin prices and tech advancements.
2. Capital Structure & Debt
The Charles Schwab Corporation
- Maintains a conservative debt profile with favorable debt-to-equity metrics and moderate interest coverage.
Hut 8 Corp.
- Shows manageable leverage with favorable current and quick ratios, supported by strong interest coverage.
3. Stock Volatility
The Charles Schwab Corporation
- Beta near 0.94 indicates moderate market sensitivity, aligning with typical financial sector volatility.
Hut 8 Corp.
- Beta above 6 signals extreme price swings, reflecting crypto market and operational risks.
4. Regulatory & Legal
The Charles Schwab Corporation
- Subject to stringent financial regulations and compliance risks in multiple jurisdictions.
Hut 8 Corp.
- Faces evolving crypto regulations and energy usage scrutiny, increasing compliance complexity.
5. Supply Chain & Operations
The Charles Schwab Corporation
- Relies on robust IT infrastructure and third-party service providers; operational disruptions could affect client services.
Hut 8 Corp.
- Dependent on energy supply and hardware availability; disruptions can sharply impact mining capacity and costs.
6. ESG & Climate Transition
The Charles Schwab Corporation
- Increasing pressure to integrate ESG in financial products and corporate governance.
Hut 8 Corp.
- High energy consumption exposes it to climate transition risks and potential regulatory penalties.
7. Geopolitical Exposure
The Charles Schwab Corporation
- Operates mainly in the US with some international presence, exposed to US regulatory shifts and global market cycles.
Hut 8 Corp.
- US-based but crypto mining subject to global regulatory fragmentation and geopolitical tensions impacting energy costs.
Which company shows a better risk-adjusted profile?
The Charles Schwab Corporation’s moderate market risk and strong capital structure present a more stable risk-adjusted profile. Hut 8’s extreme stock volatility and climate transition risks weigh heavily despite robust profitability metrics. Schwab’s Altman Z-score of 165 and perfect Piotroski score affirm financial resilience. Hut 8’s high beta of 6.18 and energy dependence signal heightened vulnerability. Investors should watch Hut 8’s regulatory environment closely, while Schwab’s regulatory compliance and competitive pressures remain key concerns.
Final Verdict: Which stock to choose?
The Charles Schwab Corporation’s superpower lies in its robust income growth and operational efficiency, making it a reliable cash generator. Its point of vigilance is the declining ROIC trend, signaling potential challenges in capital allocation. Schwab fits well in portfolios seeking steady, large-cap financial exposure with moderate growth.
Hut 8 Corp. boasts a strategic moat in rapidly expanding earnings and return metrics, fueled by a niche in blockchain infrastructure. It offers a stronger balance sheet and higher recent price appreciation than Schwab, reflecting higher growth potential but with greater volatility. Hut 8 suits investors targeting aggressive growth in emerging tech sectors.
If you prioritize stable income and proven operational strength, Schwab is the compelling choice due to its consistent profitability and market leadership. However, if you seek high growth and are comfortable with elevated risk, Hut 8 offers superior upside potential and improving profitability metrics. Both present distinct analytical scenarios aligned with divergent investor profiles.
Disclaimer: Investment carries a risk of loss of initial capital. The past performance is not a reliable indicator of future results. Be sure to understand risks before making an investment decision.
Go Further
I encourage you to read the complete analyses of The Charles Schwab Corporation and Hut 8 Corp. to enhance your investment decisions: