In the dynamic world of financial services, Robinhood Markets, Inc. and Hut 8 Corp. stand out with distinct yet overlapping market footprints. Robinhood revolutionizes retail investing with its accessible trading platform covering stocks, ETFs, and cryptocurrencies, while Hut 8 leads in Bitcoin mining and energy infrastructure. Both companies innovate within capital markets but approach growth differently. This article will help you decide which company aligns best with your investment goals.
Table of contents
Companies Overview
I will begin the comparison between Robinhood Markets, Inc. and Hut 8 Corp. by providing an overview of these two companies and their main differences.
Robinhood Markets, Inc. Overview
Robinhood Markets, Inc. operates a financial services platform in the US, enabling users to invest in stocks, ETFs, options, gold, and cryptocurrencies. The company also offers educational content, newsfeeds, watchlists, alerts, and cash management services. Founded in 2013 and headquartered in Menlo Park, CA, Robinhood aims to democratize finance for all investors with a market cap of approximately 105B USD.
Hut 8 Corp. Overview
Hut 8 Corp. is a vertically integrated operator specializing in large-scale energy infrastructure and Bitcoin mining. The company designs, builds, manages, and operates data centers supporting compute-intensive workloads like Bitcoin mining, high-performance computing, and AI. Headquartered in Miami, FL, Hut 8 holds a market cap of about 6.6B USD and focuses on the financial capital markets sector.
Key similarities and differences
Both companies operate within the financial services sector and trade on NASDAQ, but their business models diverge significantly. Robinhood provides a digital investment platform targeting broad retail investors with diverse asset classes, while Hut 8 focuses on infrastructure and operations for cryptocurrency mining and related computing services. Robinhood’s workforce is substantially larger with 2,300 employees versus Hut 8’s 222, reflecting their differing operational scopes.
Income Statement Comparison
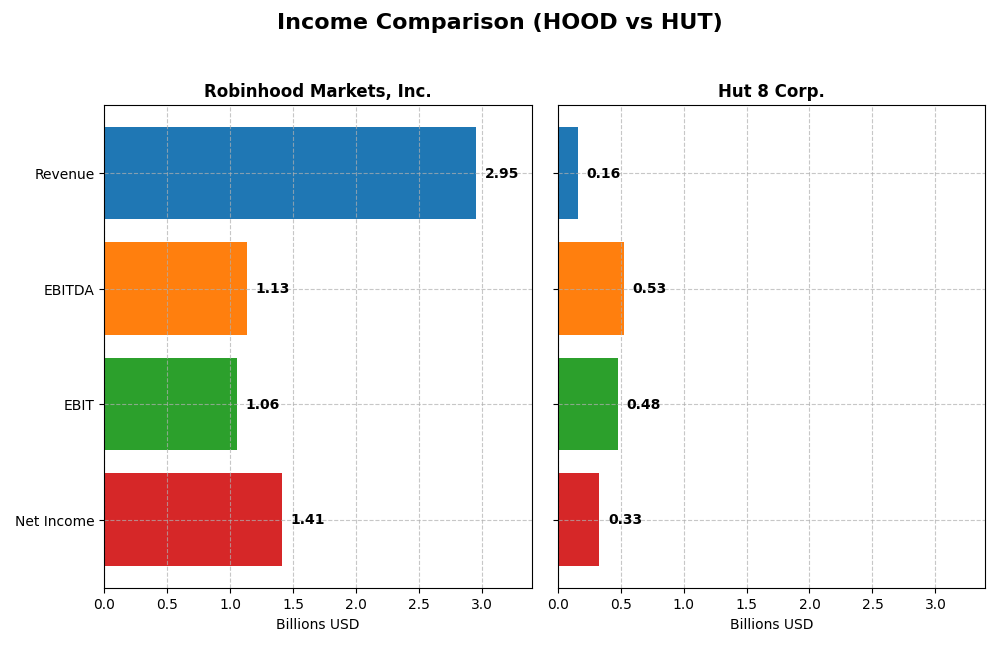
This table presents a side-by-side comparison of key income statement metrics for Robinhood Markets, Inc. and Hut 8 Corp. for the fiscal year 2024.
| Metric | Robinhood Markets, Inc. | Hut 8 Corp. |
|---|---|---|
| Market Cap | 105B | 6.6B |
| Revenue | 2.95B | 162M |
| EBITDA | 1.13B | 529M |
| EBIT | 1.06B | 482M |
| Net Income | 1.41B | 332M |
| EPS | 1.6 | 3.71 |
| Fiscal Year | 2024 | 2024 |
Income Statement Interpretations
Robinhood Markets, Inc.
Robinhood exhibited strong revenue growth from 2020 to 2024, surging from $958M to $2.95B, with a remarkable net income turnaround from a $3.69B loss in 2021 to a $1.41B profit in 2024. Margins improved significantly, with a gross margin of 82.9% and net margin nearing 48%. The 2024 results show accelerated growth and enhanced profitability, reflecting operational efficiency gains.
Hut 8 Corp.
Hut 8’s revenue increased from CAD 40.7M in 2020 to $162M in 2024, accompanied by net income improvement from a CAD 19.3M loss to a $332M profit. Margins improved notably, with a gross margin of 46.6% and net margin exceeding 200%, though interest expense remained high at 18.3%. The 2024 year marked substantial earnings expansion, driven by strong top-line growth and margin enhancement.
Which one has the stronger fundamentals?
Both companies report favorable income statement trends; Robinhood shows superior margin stability and zero interest expense, while Hut 8 displays exceptional margin growth but carries significant interest costs. Robinhood’s larger scale and consistent margin expansion contrast with Hut 8’s impressive profit gains but higher leverage, indicating different risk-reward profiles within their fundamentals.
Financial Ratios Comparison
This table presents the most recent key financial ratios for Robinhood Markets, Inc. (HOOD) and Hut 8 Corp. (HUT) for the fiscal year 2024, enabling a straightforward comparison of their financial performance and stability.
| Ratios | Robinhood Markets, Inc. (HOOD) | Hut 8 Corp. (HUT) |
|---|---|---|
| ROE | 17.7% | 34.0% |
| ROIC | 9.0% | 24.0% |
| P/E | 23.3 | 5.6 |
| P/B | 4.12 | 1.92 |
| Current Ratio | 1.39 | 1.67 |
| Quick Ratio | 1.39 | 1.67 |
| D/E (Debt-to-Equity) | 0.94 | 0.35 |
| Debt-to-Assets | 28.5% | 22.8% |
| Interest Coverage | 0 | 15.5 |
| Asset Turnover | 0.11 | 0.11 |
| Fixed Asset Turnover | 21.2 | 0.67 |
| Payout Ratio | 0 | 0 |
| Dividend Yield | 0 | 0 |
Interpretation of the Ratios
Robinhood Markets, Inc.
Robinhood’s ratios show a mix of strengths and concerns. It has favorable net margin (47.81%) and ROE (17.7%), but an unfavorable WACC (14.53%) and asset turnover (0.11). The current and quick ratios are neutral to favorable, indicating adequate liquidity. The company does not pay dividends, likely due to reinvestment and growth strategies.
Hut 8 Corp.
Hut 8 presents strong profitability metrics, with a very high net margin (204.38%) and ROE (33.98%). Its WACC (31.9%) and fixed asset turnover (0.67) are unfavorable, reflecting capital cost and efficiency concerns. Liquidity and leverage ratios are mostly favorable. Like Robinhood, it does not pay dividends, probably prioritizing capital reinvestment in its operations.
Which one has the best ratios?
Hut 8 holds a more favorable overall ratio profile, with 57.14% favorable metrics versus Robinhood’s 42.86%. However, Hut 8’s elevated WACC and weaker asset turnover contrast with Robinhood’s stronger operating returns. Both companies lack dividend payouts, focusing on growth or reinvestment strategies, complicating direct comparison on shareholder returns.
Strategic Positioning
This section compares the strategic positioning of Robinhood Markets, Inc. (HOOD) and Hut 8 Corp. (HUT) across market position, key segments, and exposure to technological disruption:
Robinhood Markets, Inc.
- Large market cap of $105B; faces competitive pressure in financial services platform sector.
- Key segments include transaction-based revenues, gold subscription, and other financial services.
- Exposure to technology disruption from evolving fintech and digital asset markets impacting platform offerings.
Hut 8 Corp.
- Smaller market cap of $6.6B; operates in niche cryptocurrency mining and data center market.
- Focuses on Bitcoin mining, digital infrastructure, high-performance computing, and power services.
- Technological disruption risk from advancements in mining hardware and energy efficiency in crypto mining.
Robinhood vs Hut 8 Positioning
Robinhood adopts a diversified approach with multiple revenue streams in financial services, while Hut 8 concentrates on crypto mining and infrastructure. Robinhood benefits from scale but faces intense competition; Hut 8’s niche focus involves operational and technological risks but may capture specialized demand.
Which has the best competitive advantage?
Both companies are currently shedding value relative to their cost of capital. Robinhood’s stable but unfavorable profitability contrasts with Hut 8’s improving ROIC trend despite ongoing value destruction, indicating Hut 8’s potential for enhanced operational efficiency.
Stock Comparison
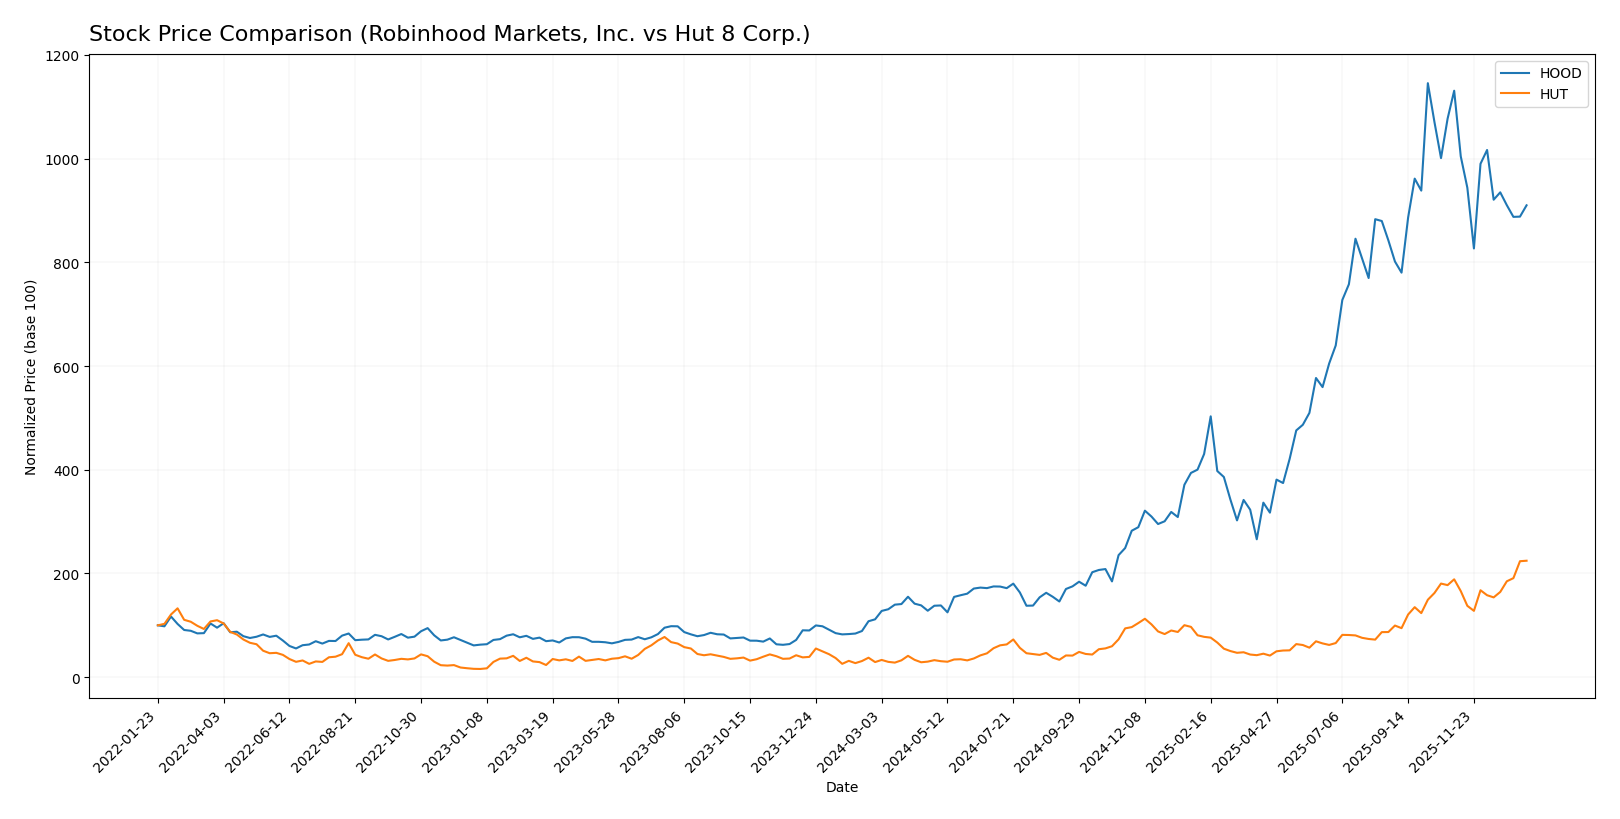
The stock prices of Robinhood Markets, Inc. (HOOD) and Hut 8 Corp. (HUT) have exhibited significant gains over the past year, with notable shifts in recent trading dynamics reflecting contrasting momentum.
Trend Analysis
Robinhood Markets, Inc. (HOOD) experienced a bullish trend over the past 12 months with a 715.61% price increase, though recent months show a deceleration and a 19.54% decline from November 2025 to January 2026. The stock displayed high volatility with a standard deviation of 41.61.
Hut 8 Corp. (HUT) also showed a bullish trend over the same period, gaining 670.97% with accelerating momentum. The recent trend from November 2025 to January 2026 remains positive with a 19.01% increase and lower volatility at a 12.87 standard deviation.
Comparing both stocks, HOOD delivered the highest market performance over the full year, despite its recent downturn, whereas HUT maintained steady acceleration and positive short-term gains.
Target Prices
Analysts provide a cautiously optimistic consensus on target prices for both Robinhood Markets, Inc. and Hut 8 Corp.
| Company | Target High | Target Low | Consensus |
|---|---|---|---|
| Robinhood Markets, Inc. | 170 | 120 | 148.85 |
| Hut 8 Corp. | 85 | 55 | 68.1 |
The consensus target prices indicate potential upside for both stocks compared to current prices: Robinhood trades near 118.5 USD below its consensus of 148.85 USD, while Hut 8 at 60.85 USD is slightly below its 68.1 USD consensus. Analysts expect moderate growth but advise monitoring volatility and sector risks carefully.
Analyst Opinions Comparison
This section compares analysts’ ratings and grades for Robinhood Markets, Inc. (HOOD) and Hut 8 Corp. (HUT):
Rating Comparison
HOOD Rating
- Rating: B- indicating a very favorable overall assessment.
- Discounted Cash Flow Score: 3, moderate indication of valuation.
- Return on Equity Score: 5, very favorable efficiency in generating profits.
- Return on Assets Score: 4, favorable asset utilization.
- Debt To Equity Score: 1, very unfavorable financial risk due to high debt.
- Overall Score: 3, moderate overall financial standing.
HUT Rating
- Rating: B indicating a very favorable overall assessment.
- Discounted Cash Flow Score: 1, very unfavorable valuation signal.
- Return on Equity Score: 4, favorable efficiency in generating profits.
- Return on Assets Score: 4, favorable asset utilization.
- Debt To Equity Score: 3, moderate financial risk with more balanced leverage.
- Overall Score: 3, moderate overall financial standing.
Which one is the best rated?
Based strictly on the provided data, HOOD holds a higher rating (B-) and shows stronger return on equity and lower asset risk scores but suffers from high financial risk. HUT has a better debt profile but lower valuation scores. Both have the same overall moderate score.
Scores Comparison
Here is a comparison of the Altman Z-Score and Piotroski Score for Robinhood Markets, Inc. and Hut 8 Corp.:
Robinhood Markets, Inc. Scores
- Altman Z-Score: 2.57, in the grey zone, moderate bankruptcy risk
- Piotroski Score: 5, average financial strength
Hut 8 Corp. Scores
- Altman Z-Score: 3.19, in the safe zone, low bankruptcy risk
- Piotroski Score: 4, average financial strength
Which company has the best scores?
Based on the provided scores, Hut 8 Corp. has a better Altman Z-Score indicating lower bankruptcy risk, but a slightly lower Piotroski Score compared to Robinhood. Overall, Hut 8 shows marginally stronger financial stability.
Grades Comparison
Here is a summary of the latest reliable grades issued by recognized financial institutions for the two companies:
Robinhood Markets, Inc. Grades
The table below presents recent grades from major grading companies for Robinhood Markets, Inc.:
| Grading Company | Action | New Grade | Date |
|---|---|---|---|
| Barclays | Maintain | Overweight | 2026-01-08 |
| Morgan Stanley | Maintain | Equal Weight | 2025-12-22 |
| Barclays | Maintain | Overweight | 2025-12-12 |
| Cantor Fitzgerald | Maintain | Overweight | 2025-12-11 |
| B of A Securities | Maintain | Buy | 2025-12-10 |
| Needham | Maintain | Buy | 2025-12-05 |
| Needham | Maintain | Buy | 2025-11-26 |
| Citizens | Maintain | Market Outperform | 2025-11-07 |
| Barclays | Maintain | Overweight | 2025-11-06 |
| Cantor Fitzgerald | Maintain | Overweight | 2025-11-06 |
Overall, Robinhood Markets, Inc. maintains a positive outlook with multiple Overweight and Buy ratings from reputable firms, indicating moderate confidence in its stock performance.
Hut 8 Corp. Grades
The table below displays recent grades from established grading companies for Hut 8 Corp.:
| Grading Company | Action | New Grade | Date |
|---|---|---|---|
| B. Riley Securities | Maintain | Buy | 2026-01-09 |
| Keefe, Bruyette & Woods | Maintain | Outperform | 2025-12-19 |
| Rosenblatt | Maintain | Buy | 2025-12-18 |
| Needham | Maintain | Buy | 2025-12-18 |
| Canaccord Genuity | Maintain | Buy | 2025-12-18 |
| BTIG | Maintain | Buy | 2025-12-17 |
| BTIG | Maintain | Buy | 2025-11-06 |
| Canaccord Genuity | Maintain | Buy | 2025-11-05 |
| Rosenblatt | Maintain | Buy | 2025-11-05 |
| Cantor Fitzgerald | Maintain | Overweight | 2025-11-04 |
Hut 8 Corp. shows a strong positive consensus with a majority of Buy ratings and some Outperform and Overweight designations, reflecting robust analyst confidence.
Which company has the best grades?
Both companies have a consensus “Buy” rating, but Hut 8 Corp. exhibits a higher concentration of Buy and Outperform grades, suggesting stronger analyst enthusiasm. This could imply potentially greater investor interest or confidence in Hut 8’s near-term prospects compared to Robinhood Markets, Inc.
Strengths and Weaknesses
Below is a comparative overview of key strengths and weaknesses of Robinhood Markets, Inc. (HOOD) and Hut 8 Corp. (HUT) based on the most recent data:
| Criterion | Robinhood Markets, Inc. (HOOD) | Hut 8 Corp. (HUT) |
|---|---|---|
| Diversification | Moderate; revenue largely from transaction-based fees and subscriptions | Moderate; revenue from digital infrastructure, HPC, power, and services |
| Profitability | Strong net margin (47.8%) and ROE (17.7%), but ROIC below WACC indicates value destruction | Very high net margin (204%) and ROE (34%), but ROIC below WACC; profitability improving |
| Innovation | Focus on fintech innovation with subscription services and proxy revenues | Innovation in crypto mining and HPC infrastructure, expanding digital services |
| Global presence | Primarily US-focused retail trading platform | Canadian-based but serving global crypto and HPC markets |
| Market Share | Significant in US retail brokerage with strong transaction volumes | Niche player in crypto mining and HPC with growing footprint |
Key takeaways: Robinhood shows strong profitability metrics but struggles with capital efficiency, indicating caution. Hut 8 is improving profitability with a growing ROIC trend but still faces challenges in value creation. Both companies have moderate diversification and distinct market positions, requiring careful risk assessment before investment.
Risk Analysis
Below is a comparative table summarizing key risks for Robinhood Markets, Inc. (HOOD) and Hut 8 Corp. (HUT) based on their latest financial and operational profiles in 2026:
| Metric | Robinhood Markets, Inc. (HOOD) | Hut 8 Corp. (HUT) |
|---|---|---|
| Market Risk | High beta 2.45 indicates higher volatility and sensitivity to market swings. | Very high beta 6.19 reflects extreme price volatility and risk. |
| Debt Level | Moderate debt-to-equity (0.94), debt to assets at 28.5%, manageable but needs monitoring. | Low debt-to-equity (0.35) and debt to assets 22.8%, indicating lower financial leverage risk. |
| Regulatory Risk | Elevated, given fintech regulatory scrutiny and evolving crypto policies in the US. | Moderate, mainly linked to energy and crypto mining regulations. |
| Operational Risk | Medium, dependent on platform stability, security, and customer growth. | High, exposure to energy costs, hardware performance, and crypto market cycles. |
| Environmental Risk | Low to moderate, mainly indirect through business operations. | High, due to energy-intensive Bitcoin mining and carbon footprint concerns. |
| Geopolitical Risk | Moderate, exposure to US market and policy changes impacting fintech. | Moderate to high, mining operations could be affected by international trade and energy policies. |
The most impactful risks are Hut 8’s extreme market volatility and environmental footprint, which pose high operational and reputational challenges. Robinhood faces significant regulatory risks amid fintech and crypto oversight. Cautious investors should weigh Hut 8’s energy dependencies and Robinhood’s regulatory environment before investing.
Which Stock to Choose?
Robinhood Markets, Inc. (HOOD) shows a strong income evolution with a 208% revenue growth and highly favorable profitability ratios, including a 47.8% net margin and 17.7% ROE. The company carries moderate debt levels with a net debt-to-EBITDA of 2.76 and a B- rating indicating very favorable overall financial standing despite some unfavorable valuation ratios.
Hut 8 Corp. (HUT) presents a robust income growth of nearly 299% over the period, with an exceptionally high net margin of 204% and a 34% ROE. Its debt profile is conservative with a net debt-to-EBITDA of 0.49 and a B rating reflecting very favorable financial health, supported by a higher proportion of favorable financial ratios compared to HOOD.
For risk-tolerant investors seeking high growth with strong profitability metrics, HUT may appear attractive due to its superior margin and return ratios alongside a safer debt position. Conversely, investors prioritizing a slightly more balanced profile with moderate valuation and proven profitability might find HOOD’s stable but less aggressive metrics more aligned with their strategy.
Disclaimer: Investment carries a risk of loss of initial capital. The past performance is not a reliable indicator of future results. Be sure to understand risks before making an investment decision.
Go Further
I encourage you to read the complete analyses of Robinhood Markets, Inc. and Hut 8 Corp. to enhance your investment decisions: