Home > Comparison > Financial Services > RJF vs HUT
The strategic rivalry between Raymond James Financial, Inc. and Hut 8 Corp. shapes the evolving landscape of financial services. Raymond James operates as a diversified capital markets powerhouse with comprehensive wealth management and banking services. In contrast, Hut 8 is a niche player focused on energy-intensive Bitcoin mining and data center operations. This analysis will evaluate which business model offers superior risk-adjusted returns for a diversified portfolio amid shifting sector dynamics.
Table of contents
Companies Overview
Raymond James Financial and Hut 8 Corp represent distinct pillars in the financial services sector, each shaping market dynamics uniquely.
Raymond James Financial, Inc.: Diversified Financial Services Leader
Raymond James Financial dominates the financial services sector through diversified revenue streams. Its core business includes investment banking, asset management, and private client services. In 2026, the company’s strategic focus emphasizes expanding advisory services and enhancing capital markets operations across the US, Canada, and Europe, leveraging a broad client base and integrated financial solutions.
Hut 8 Corp.: Vertically Integrated Bitcoin Mining Operator
Hut 8 Corp specializes in Bitcoin mining and energy infrastructure. It generates revenue by operating large-scale data centers for compute-intensive workloads, including cryptocurrency mining and AI applications. In 2026, Hut 8 prioritizes scaling its mining capacity and optimizing energy efficiency to sustain competitive positioning in a volatile digital asset market.
Strategic Collision: Similarities & Divergences
Raymond James embraces a diversified financial model with broad client services, while Hut 8 pursues a focused, tech-driven niche in cryptocurrency mining. They compete indirectly through capital market activities and investor appeal. Raymond James offers stability and scale; Hut 8 provides high-growth, high-volatility exposure. Their distinct investment profiles reflect a classic trade-off between traditional finance resilience and innovative digital asset risk.
Income Statement Comparison
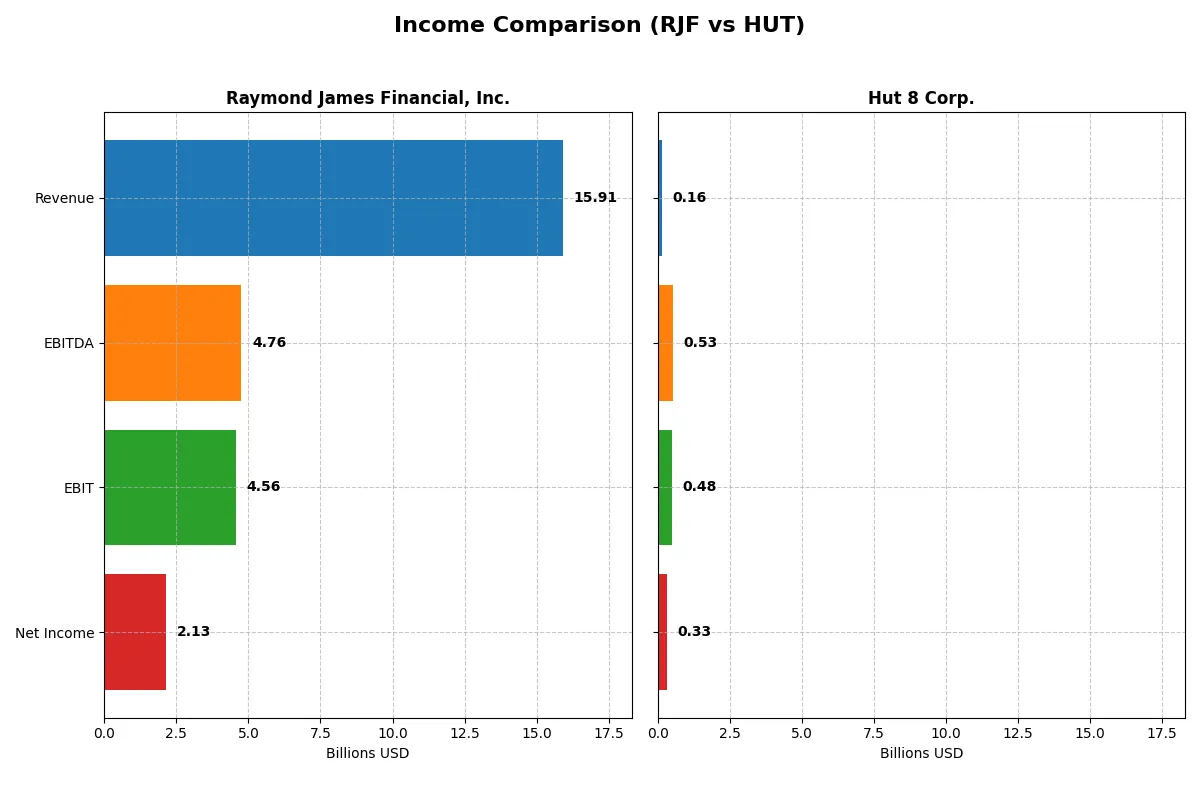
The following data dissects the core profitability and scalability of both corporate engines to reveal who dominates the bottom line:
| Metric | Raymond James Financial, Inc. (RJF) | Hut 8 Corp. (HUT) |
|---|---|---|
| Revenue | 15.9B | 162M |
| Cost of Revenue | 1.88B | 87M |
| Operating Expenses | 9.47B | -385M |
| Gross Profit | 14.03B | 76M |
| EBITDA | 4.76B | 529M |
| EBIT | 4.56B | 482M |
| Interest Expense | 1.85B | 30M |
| Net Income | 2.14B | 332M |
| EPS | 10.53 | 3.71 |
| Fiscal Year | 2025 | 2024 |
Income Statement Analysis: The Bottom-Line Duel
This income statement comparison reveals the true efficiency and growth dynamics powering each company’s financial engine.
Raymond James Financial, Inc. Analysis
Raymond James shows steady revenue growth from $9.8B in 2021 to $15.9B in 2025. Its gross margin remains robust at 88.16%, reflecting strong cost control. Net income climbs to $2.13B in 2025, supported by a favorable 28.66% EBIT margin, though net margin slightly contracts, signaling margin pressure despite overall earnings momentum.
Hut 8 Corp. Analysis
Hut 8’s revenue surged from CAD 40.7M in 2020 to $162M in 2024, driving a substantial gross margin of 46.64%. Its net income turnaround is striking, reaching $332M in 2024 from losses earlier. Exceptional EBIT margin of 296.64% in 2024 highlights operational leverage, though high interest expense at 18.35% flags persistent financing costs.
Margin Resilience vs. Explosive Growth
Raymond James delivers consistent margin resilience and solid earnings growth, with a disciplined cost structure and stable net income trajectory. Hut 8 impresses with explosive revenue and net income growth, reflecting a rapid business transformation. For investors, Raymond James offers steady profitability; Hut 8’s profile suits those seeking high growth with elevated risk.
Financial Ratios Comparison
These vital ratios act as a diagnostic tool to expose the underlying fiscal health, valuation premiums, and capital efficiency of the companies compared below:
| Ratios | Raymond James Financial, Inc. (RJF) | Hut 8 Corp. (HUT) |
|---|---|---|
| ROE | 17.1% | 34.0% |
| ROIC | 15.9% | 24.0% |
| P/E | 16.3 | 5.6 |
| P/B | 2.79 | 1.92 |
| Current Ratio | 0.32 | 1.67 |
| Quick Ratio | 0.32 | 1.67 |
| D/E (Debt-to-Equity) | 0.36 | 0.35 |
| Debt-to-Assets | 5.2% | 22.8% |
| Interest Coverage | 2.47 | 15.46 |
| Asset Turnover | 0.18 | 0.11 |
| Fixed Asset Turnover | 10.35 | 0.67 |
| Payout Ratio | 19.5% | 0% |
| Dividend yield | 1.19% | 0% |
| Fiscal Year | 2025 | 2024 |
Efficiency & Valuation Duel: The Vital Signs
Financial ratios serve as a company’s DNA, unveiling hidden risks and operational strengths essential for investment decisions.
Raymond James Financial, Inc.
Raymond James posts a solid ROE of 17.08% and a net margin of 13.42%, signaling consistent profitability. Its P/E ratio of 16.33 suggests a fairly valued stock relative to earnings. The firm maintains shareholder returns with a 1.19% dividend yield, reflecting stable cash flow and prudent capital allocation.
Hut 8 Corp.
Hut 8 boasts a remarkable ROE of 33.98% and an extraordinary net margin exceeding 200%, highlighting operational leverage. Its P/E ratio of 5.64 marks the stock as attractively valued. However, Hut 8 pays no dividends, focusing instead on reinvesting in growth amid a higher cost of capital and elevated debt levels.
Premium Valuation vs. Operational Safety
Hut 8 offers compelling profitability at a lower valuation but carries higher financial risk and no dividend return. Raymond James balances moderate valuation with stable dividends and solid margins. Risk-tolerant investors may prefer Hut 8’s growth profile, whereas those seeking steady income lean toward Raymond James.
Which one offers the Superior Shareholder Reward?
I compare Raymond James Financial, Inc. (RJF) and Hut 8 Corp. (HUT) on their shareholder rewards. RJF pays dividends with a 1.19% yield and a conservative 19.5% payout ratio, well covered by its strong free cash flow (FCF). RJF also executes steady buybacks, enhancing shareholder value sustainably. HUT pays no dividends, opting to reinvest heavily in capex and growth, resulting in negative free cash flow and volatile operating cash flow. Its buyback activity is minimal or absent, which limits direct shareholder returns. RJF’s balanced distribution of dividends and buybacks, supported by superior cash flow metrics, offers a more reliable and attractive total return profile for 2026 investors than HUT’s reinvestment-heavy, non-dividend model with uncertain cash generation.
Comparative Score Analysis: The Strategic Profile
The radar chart reveals the fundamental DNA and trade-offs of Raymond James Financial and Hut 8 Corp., highlighting their core financial strengths and weaknesses:
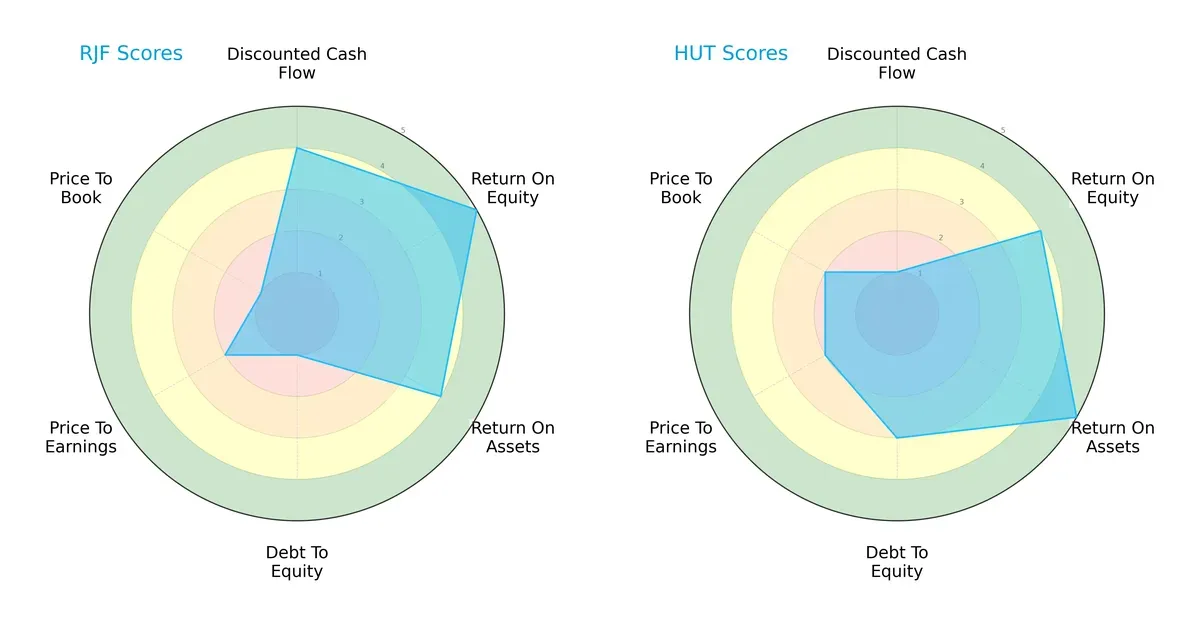
Raymond James excels in discounted cash flow (4) and return on equity (5), signaling strong profitability and valuation appeal. Hut 8 leads in return on assets (5) and maintains a healthier debt-to-equity balance (3), reflecting operational efficiency and moderate leverage. Raymond James’s very low debt-to-equity score (1) and price-to-book score (1) expose financial risk and valuation concerns. Hut 8 presents a more balanced profile, relying less on a single advantage.
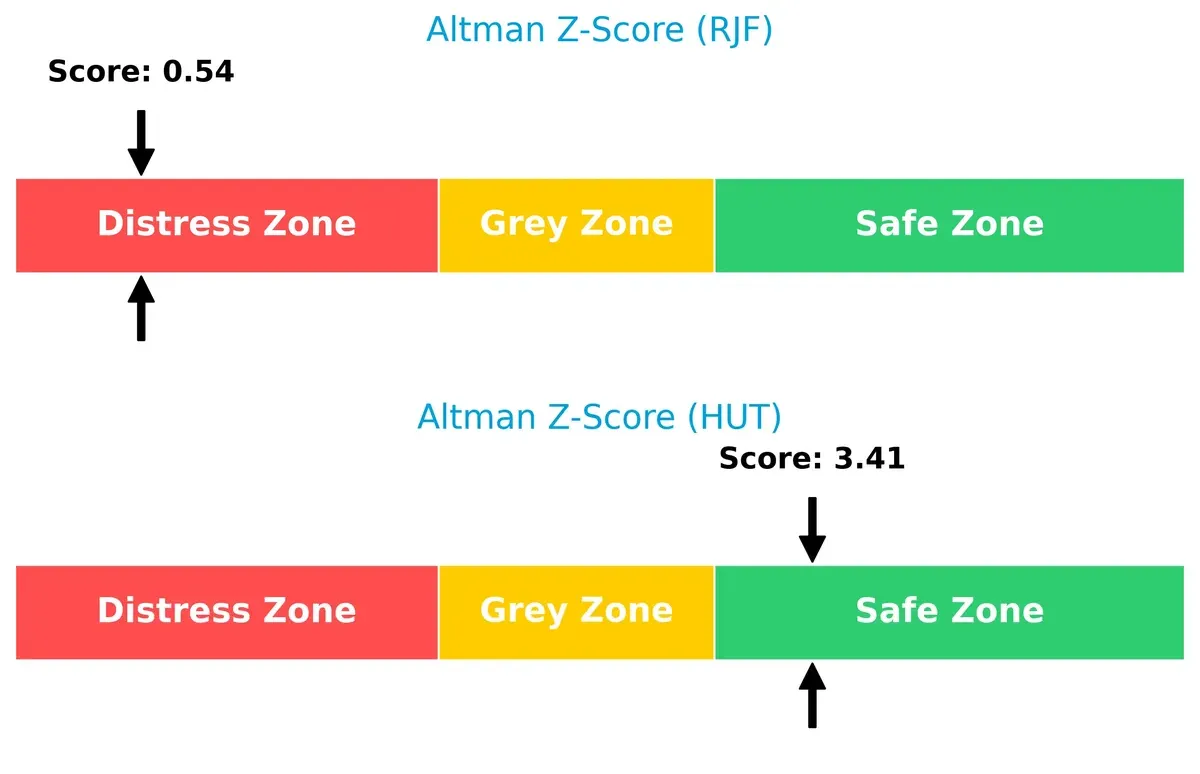
Bankruptcy Risk: Solvency Showdown
Raymond James’s Altman Z-Score of 0.54 places it deep in the distress zone, signaling imminent bankruptcy risk. In contrast, Hut 8’s score of 3.41 firmly situates it in the safe zone, indicating strong solvency and survival prospects in this cycle:
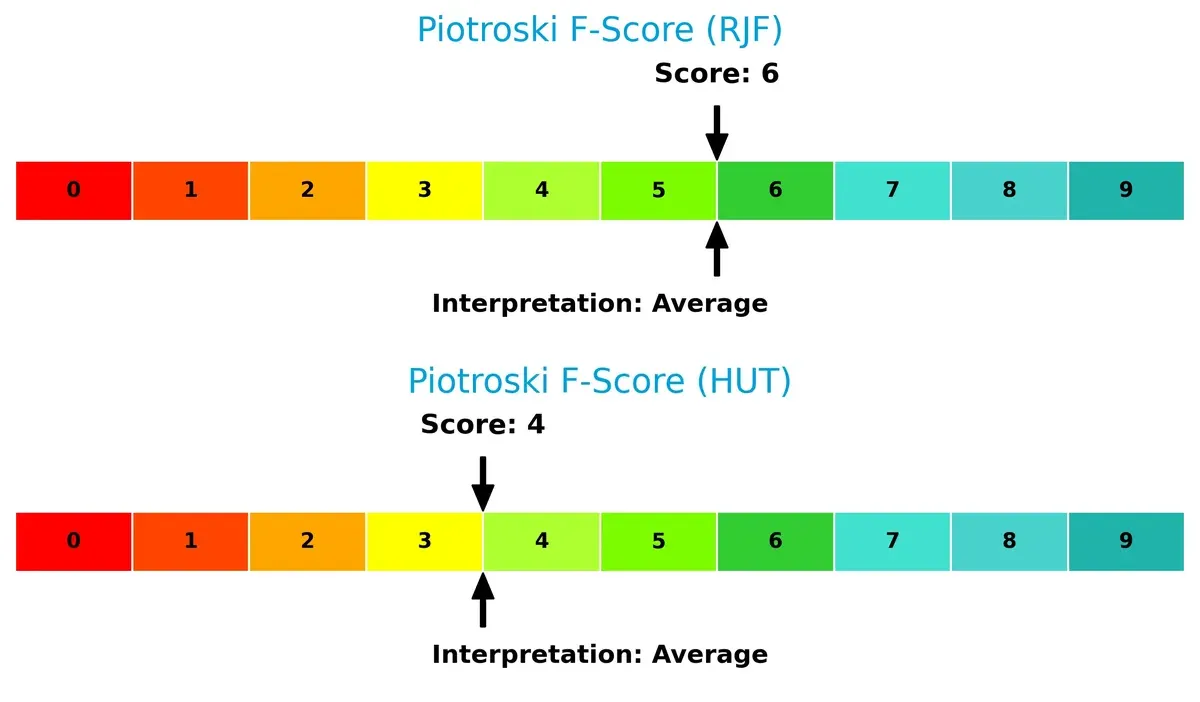
Financial Health: Quality of Operations
Raymond James posts a Piotroski F-Score of 6, suggesting average financial health with some operational strength. Hut 8 scores 4, reflecting weaker internal metrics and potential red flags in profitability or efficiency:
How are the two companies positioned?
This section dissects the operational DNA of RJF and HUT by comparing their revenue distribution and internal dynamics. The goal is to confront their economic moats and identify which model offers the most resilient competitive advantage today.
Revenue Segmentation: The Strategic Mix
This visual comparison dissects how Raymond James Financial and Hut 8 Corp. diversify their income streams and where their primary sector bets lie:
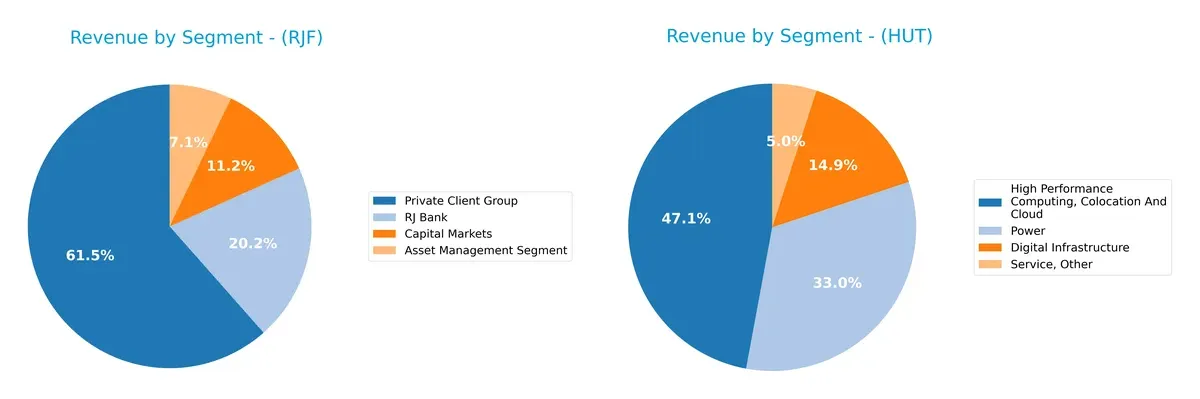
Raymond James Financial anchors its revenue in the Private Client Group with $10.3B, complemented by Capital Markets ($1.9B), RJ Bank ($3.4B), and Asset Management ($1.2B). This mix shows a well-balanced financial services ecosystem. Hut 8 Corp., by contrast, pivots heavily on High Performance Computing, Colocation and Cloud ($80.7M), overshadowing Digital Infrastructure ($25.5M) and Power ($56.6M). Hut 8’s narrower focus signals concentration risk but leverages infrastructure dominance in crypto mining.
Strengths and Weaknesses Comparison
This table compares the strengths and weaknesses of Raymond James Financial and Hut 8 Corp.:
Raymond James Financial Strengths
- Diversified revenue streams across Capital Markets, Private Client Group, and Asset Management
- Favorable profitability with 13.42% net margin and 17.08% ROE
- Low debt-to-assets ratio at 5.15% indicating conservative leverage
- Strong fixed asset turnover at 10.35 reflecting efficient asset use
Hut 8 Corp. Strengths
- Exceptional net margin of 204.38% and high ROE of 33.98% demonstrating strong profitability
- Favorable current and quick ratios at 1.67 indicating solid liquidity
- Low debt-to-equity at 0.35 and strong interest coverage at 16.17 support financial health
- Favorable P/E ratio at 5.64 suggests potential undervaluation
Raymond James Financial Weaknesses
- Low current and quick ratios at 0.32 raise liquidity concerns
- Asset turnover of 0.18 is below ideal, indicating less efficient use of assets
- Weighted average cost of capital (WACC) at 11.21% is unfavorable compared to ROIC
Hut 8 Corp. Weaknesses
- Unfavorable WACC at 31.84% far exceeds ROIC, eroding value creation
- Low asset turnover of 0.11 and fixed asset turnover at 0.67 suggest operational inefficiencies
- Lack of dividend yield may deter income-focused investors
Overall, Raymond James Financial benefits from diversified revenues and stable profitability but faces liquidity and asset efficiency challenges. Hut 8 Corp. shows strong profitability and liquidity metrics but must address high capital costs and operational efficiency to sustain growth.
The Moat Duel: Analyzing Competitive Defensibility
A structural moat shields long-term profits from competition’s relentless erosion. It defines which firms sustain economic value over time:
Raymond James Financial, Inc.: Durable Client Relationships and Diversified Services
Raymond James’ moat stems from strong client switching costs and diversified financial services. High ROIC exceeding WACC by 4.7% confirms value creation. Expanding asset management and capital markets in 2026 should deepen its moat.
Hut 8 Corp.: Cost Advantage via Vertical Integration in Bitcoin Mining
Hut 8’s moat relies on cost leadership through energy-efficient mining infrastructure. Unlike Raymond James, its ROIC lags behind WACC, signaling value destruction despite rapid ROIC growth. Scaling AI workloads could offer new expansion paths in 2026.
Traditional Clientele Moat vs. Tech-Driven Cost Moat
Raymond James exhibits a wider and more durable moat with strong economic profits and consistent value creation. Hut 8 shows promise but remains vulnerable due to negative ROIC spread. Raymond James is better positioned to defend its market share long term.
Which stock offers better returns?
The past year reveals sharp upward trajectories for both stocks, with Hut 8 Corp. markedly outperforming Raymond James Financial, Inc. on total price appreciation and momentum.
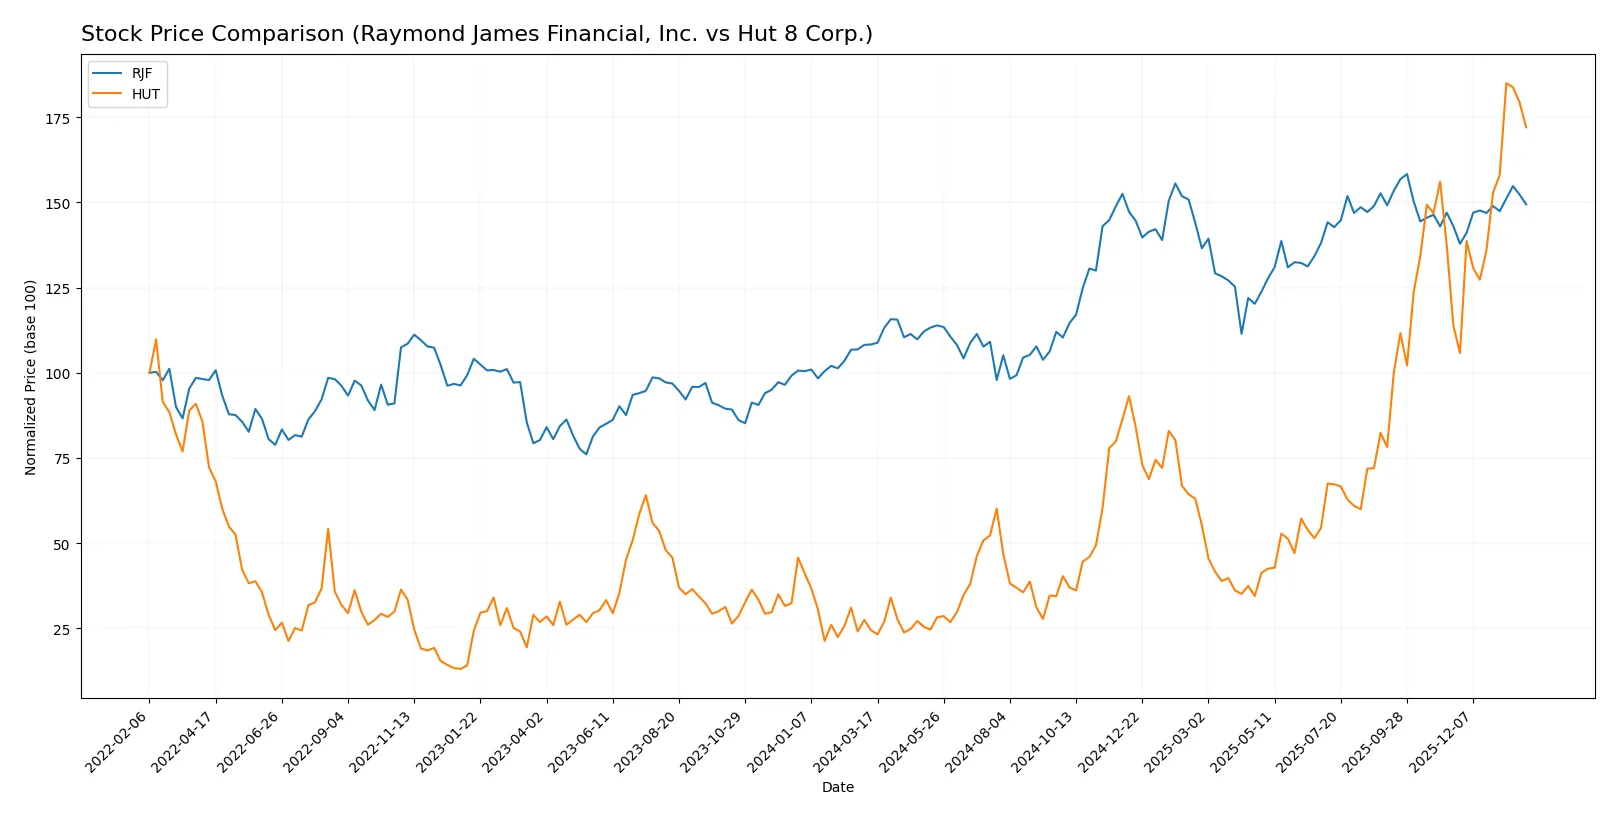
Trend Comparison
Raymond James Financial, Inc. shows a 38% price gain over 12 months, indicating a bullish trend with accelerating momentum and a high price range between 108.62 and 175.69.
Hut 8 Corp. delivers a striking 604% increase in the same period, confirming a strong bullish trend with acceleration and notable price volatility between 7.54 and 60.04.
Hut 8 Corp.’s stock vastly outperforms Raymond James Financial, Inc., offering significantly higher market returns and stronger recent momentum.
Target Prices
Analysts present a cautiously optimistic consensus for Raymond James Financial and Hut 8 Corp.
| Company | Target Low | Target High | Consensus |
|---|---|---|---|
| Raymond James Financial, Inc. | 176 | 198 | 187 |
| Hut 8 Corp. | 55 | 85 | 70.1 |
The consensus targets for RJF suggest a 13% upside versus its current 166 price. Hut 8’s target implies a 25% potential rebound from 56, reflecting divergent risk profiles.

Don’t Let Luck Decide Your Entry Point
Optimize your entry points with our advanced ProRealTime indicators. You’ll get efficient buy signals with precise price targets for maximum performance. Start outperforming now!
How do institutions grade them?
The following tables summarize recent institutional grades for Raymond James Financial, Inc. and Hut 8 Corp.:
Raymond James Financial, Inc. Grades
This table shows Raymond James Financial’s recent grades from well-known financial institutions.
| Grading Company | Action | New Grade | Date |
|---|---|---|---|
| TD Cowen | Maintain | Hold | 2026-01-14 |
| Morgan Stanley | Maintain | Equal Weight | 2025-12-22 |
| B of A Securities | Maintain | Neutral | 2025-12-10 |
| BMO Capital | Maintain | Market Perform | 2025-10-23 |
| Keefe, Bruyette & Woods | Maintain | Market Perform | 2025-10-23 |
| TD Cowen | Maintain | Hold | 2025-10-23 |
| JMP Securities | Maintain | Market Outperform | 2025-10-23 |
| JP Morgan | Maintain | Neutral | 2025-10-23 |
| JMP Securities | Maintain | Market Outperform | 2025-10-09 |
| JP Morgan | Maintain | Neutral | 2025-10-07 |
Hut 8 Corp. Grades
Below are Hut 8 Corp.’s latest grades from respected grading firms.
| Grading Company | Action | New Grade | Date |
|---|---|---|---|
| Keefe, Bruyette & Woods | Maintain | Outperform | 2026-01-27 |
| Needham | Maintain | Buy | 2026-01-16 |
| B. Riley Securities | Maintain | Buy | 2026-01-09 |
| Keefe, Bruyette & Woods | Maintain | Outperform | 2025-12-19 |
| Rosenblatt | Maintain | Buy | 2025-12-18 |
| Canaccord Genuity | Maintain | Buy | 2025-12-18 |
| Needham | Maintain | Buy | 2025-12-18 |
| BTIG | Maintain | Buy | 2025-12-17 |
| BTIG | Maintain | Buy | 2025-11-06 |
| Rosenblatt | Maintain | Buy | 2025-11-05 |
Which company has the best grades?
Hut 8 Corp. consistently earns “Buy” and “Outperform” ratings, reflecting bullish institutional sentiment. Raymond James Financial receives mostly neutral ratings like “Hold” and “Market Perform,” signaling more cautious views. Investors may interpret Hut 8’s stronger grades as higher confidence in growth potential, while Raymond James’s steady but moderate grades suggest stability without strong upside signals.
Risks specific to each company
The following categories identify critical pressure points and systemic threats facing Raymond James Financial, Inc. and Hut 8 Corp. in the 2026 market environment:
1. Market & Competition
Raymond James Financial, Inc.
- Operates in a mature, highly competitive financial services market with pressure from fintech innovation.
Hut 8 Corp.
- Faces intense competition in a volatile crypto mining sector heavily influenced by Bitcoin price swings.
2. Capital Structure & Debt
Raymond James Financial, Inc.
- Maintains a conservative debt-to-equity ratio (0.36) but shows unfavorable liquidity ratios (current ratio 0.32).
Hut 8 Corp.
- Holds moderate leverage (debt-to-assets 22.76%) with strong liquidity (current ratio 1.67), signaling balanced capital risk.
3. Stock Volatility
Raymond James Financial, Inc.
- Exhibits low beta (1.00), indicating stock price stability aligned with the financial sector average.
Hut 8 Corp.
- Displays very high beta (6.19), reflecting extreme sensitivity to market swings and elevated risk.
4. Regulatory & Legal
Raymond James Financial, Inc.
- Subject to stringent financial regulations and compliance demands in multiple jurisdictions.
Hut 8 Corp.
- Faces emerging regulatory scrutiny on crypto mining energy use and evolving tax policies.
5. Supply Chain & Operations
Raymond James Financial, Inc.
- Relies on robust technology and service delivery platforms, vulnerable to cyber risks and operational disruptions.
Hut 8 Corp.
- Dependent on energy supply stability and hardware availability; supply chain bottlenecks can impair mining operations.
6. ESG & Climate Transition
Raymond James Financial, Inc.
- Increasing pressure to integrate ESG principles in investment and banking services amid rising investor demand.
Hut 8 Corp.
- High exposure to environmental risks due to energy-intensive Bitcoin mining, challenging sustainable transition efforts.
7. Geopolitical Exposure
Raymond James Financial, Inc.
- Moderate exposure due to operations in US, Canada, and Europe; sensitive to cross-border regulatory changes.
Hut 8 Corp.
- Vulnerable to geopolitical shifts affecting energy markets and crypto regulations, especially in US and global markets.
Which company shows a better risk-adjusted profile?
Raymond James faces significant liquidity constraints and operational pressures in a stable market, while Hut 8 struggles with extreme volatility and environmental risks. Hut 8’s Altman Z-Score places it in a safe zone, unlike Raymond James, which is in distress. Despite Hut 8’s volatility, its liquidity and leverage metrics suggest a better risk-adjusted profile. The most impactful risk for Raymond James is liquidity strain, evidenced by a dangerously low current ratio of 0.32. For Hut 8, the dominant risk stems from stock volatility and regulatory uncertainty linked to crypto mining. Overall, Hut 8’s financial resilience and favorable Altman Z-Score make it the stronger candidate under current market conditions.
Final Verdict: Which stock to choose?
Raymond James Financial, Inc. (RJF) stands out for its durable competitive advantage, reflected in consistently strong ROIC exceeding its cost of capital. Its superpower lies in efficient capital allocation and steady profitability, despite a point of vigilance around its low liquidity ratios. It suits portfolios seeking stable, value-creating financial firms.
Hut 8 Corp. (HUT) impresses with rapid revenue and earnings growth, driven by its strategic foothold in the crypto mining sector. Its moat is more nascent and riskier, with a recovering profitability profile and safer liquidity than RJF. It fits growth-focused investors willing to tolerate higher volatility for potential outsized returns.
If you prioritize capital efficiency and proven value creation, RJF is the compelling choice due to its robust moat and consistent cash generation. However, if you seek high-growth exposure with a tolerance for risk and market fluctuations, HUT offers superior growth momentum and a promising turnaround trajectory. Each aligns with distinct investor risk profiles and time horizons.
Disclaimer: Investment carries a risk of loss of initial capital. The past performance is not a reliable indicator of future results. Be sure to understand risks before making an investment decision.
Go Further
I encourage you to read the complete analyses of Raymond James Financial, Inc. and Hut 8 Corp. to enhance your investment decisions: