In the dynamic aerospace and defense sector, TransDigm Group Incorporated (TDG) and Huntington Ingalls Industries, Inc. (HII) stand out as key players with distinct yet overlapping market roles. TDG specializes in aircraft components and subsystems, while HII focuses on military shipbuilding and naval services. Both companies leverage innovation to secure government and commercial contracts. This article will help you assess which company offers the most compelling investment opportunity in 2026.
Table of contents
Companies Overview
I will begin the comparison between TransDigm Group Incorporated and Huntington Ingalls Industries, Inc. by providing an overview of these two companies and their main differences.
TransDigm Group Incorporated Overview
TransDigm Group Incorporated specializes in designing, producing, and supplying aircraft components globally. Its diverse segments include Power & Control, Airframe, and Non-aviation, serving various aerospace and defense customers such as airlines, military agencies, and subsystem suppliers. Founded in 1993 and based in Cleveland, Ohio, it holds a strong position in aerospace components with a market cap of approximately 77.6B USD.
Huntington Ingalls Industries, Inc. Overview
Huntington Ingalls Industries, Inc. focuses on designing, building, and maintaining military ships for the U.S. Navy and Coast Guard. Operating through Ingalls Shipbuilding, Newport News Shipbuilding, and Technical Solutions segments, it provides nuclear and non-nuclear ships alongside life-cycle sustainment and defense IT solutions. Founded in 1886 and headquartered in Newport News, Virginia, its market cap stands near 14.9B USD.
Key similarities and differences
Both companies operate in the aerospace and defense sector but differ in focus; TransDigm concentrates on aircraft components while Huntington Ingalls specializes in military shipbuilding and sustainment services. TransDigm’s business model is diversified across several product lines and markets, whereas Huntington Ingalls emphasizes ship design, construction, and naval support. Their scale also contrasts, with TransDigm’s market cap over five times larger, reflecting distinct market niches within the defense industry.
Income Statement Comparison
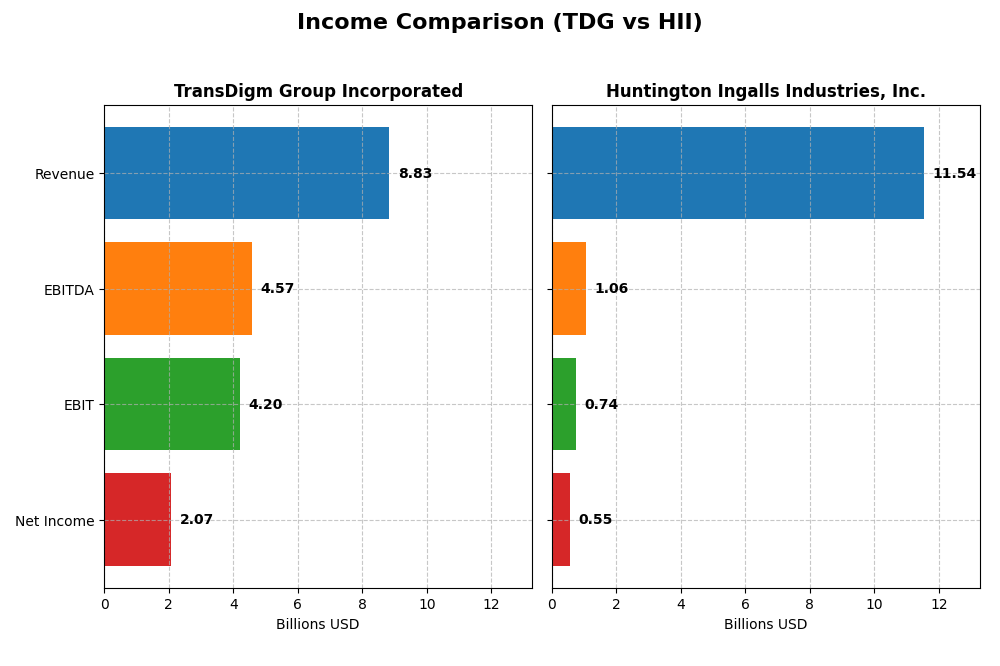
Here is a side-by-side comparison of the most recent fiscal year income statement metrics for TransDigm Group Incorporated and Huntington Ingalls Industries, Inc.
| Metric | TransDigm Group Incorporated (TDG) | Huntington Ingalls Industries, Inc. (HII) |
|---|---|---|
| Market Cap | 77.6B | 14.9B |
| Revenue | 8.83B | 11.54B |
| EBITDA | 4.57B | 1.06B |
| EBIT | 4.20B | 738M |
| Net Income | 2.07B | 550M |
| EPS | 32.08 | 13.96 |
| Fiscal Year | 2025 | 2024 |
Income Statement Interpretations
TransDigm Group Incorporated
From 2021 to 2025, TransDigm Group Incorporated exhibited strong growth, with revenue increasing from $4.8B to $8.8B and net income rising sharply from $680M to $2.07B. Gross and EBIT margins remained robust and favorable, around 60% and 48% respectively, while net margin improved to 23.5%. The 2025 fiscal year showed accelerated growth, with revenue up 11.2% and net margin expanding by 8.8%.
Huntington Ingalls Industries, Inc.
Huntington Ingalls Industries showed modest revenue growth from $9.4B in 2020 to $11.5B in 2024, but net income declined from $696M to $550M over the same period. Margins are relatively low and stable, with a gross margin near 12.6%, EBIT margin at 6.4%, and net margin at 4.8%, all evaluated as neutral. The 2024 year saw slight revenue growth of 0.7% but declines in gross profit, EBIT, net margin, and EPS, indicating weakening profitability.
Which one has the stronger fundamentals?
TransDigm Group’s fundamentals appear stronger, supported by consistent and significant revenue and net income growth, alongside high and improving margins. Conversely, Huntington Ingalls Industries faces margin pressures and declining net income, with several unfavorable growth indicators. While TransDigm’s interest expense is higher, its overall income statement evaluation remains predominantly favorable, unlike Huntington Ingalls’ predominantly unfavorable assessment.
Financial Ratios Comparison
The table below presents a side-by-side comparison of key financial ratios for TransDigm Group Incorporated (TDG) and Huntington Ingalls Industries, Inc. (HII) based on their most recent fiscal year data.
| Ratios | TransDigm Group Incorporated (TDG) | Huntington Ingalls Industries, Inc. (HII) |
|---|---|---|
| ROE | -21.4% | 11.8% |
| ROIC | 15.2% | 4.7% |
| P/E | 37.0 | 13.5 |
| P/B | -7.9 | 1.60 |
| Current Ratio | 3.21 | 1.08 |
| Quick Ratio | 2.25 | 1.01 |
| D/E (Debt-to-Equity) | -3.10 | 0.73 |
| Debt-to-Assets | 131.1% | 28.1% |
| Interest Coverage | 2.65 | 5.63 |
| Asset Turnover | 0.39 | 0.95 |
| Fixed Asset Turnover | 5.59 | 3.13 |
| Payout ratio | 464.3% | 37.5% |
| Dividend yield | 0.13% | 2.77% |
Interpretation of the Ratios
TransDigm Group Incorporated
TransDigm presents a mixed ratio profile with strong net margin (23.49%) and ROIC (15.22%), but a negative ROE (-21.41%) and high debt to assets (131.08%), raising concerns over leverage and profitability distribution. The dividend yield stands at 12.55%, reflecting a high payout, though coverage by free cash flow appears weak, suggesting payout sustainability risks.
Huntington Ingalls Industries, Inc.
Huntington Ingalls shows moderate profitability with a net margin of 4.77% and ROE at 11.79%, but ROIC is relatively low at 4.74%. Debt levels and interest coverage ratios are favorable, supporting financial stability. The company pays dividends with a 2.77% yield, indicating a more conservative return to shareholders and manageable payout risks.
Which one has the best ratios?
Both companies exhibit slightly favorable overall ratios, yet their strengths differ: TransDigm’s higher profitability contrasts with its leverage concerns, while Huntington Ingalls offers better financial stability and lower risk profiles. Investors should weigh profitability against financial health, as neither company is unequivocally superior based solely on these ratios.
Strategic Positioning
This section compares the strategic positioning of TransDigm Group Incorporated (TDG) and Huntington Ingalls Industries, Inc. (HII) in terms of market position, key segments, and exposure to technological disruption:
TransDigm Group Incorporated
- Leading aerospace components supplier with strong market cap and competitive pressure in industrials sector.
- Diverse product segments: Airframe ($4.1B), Power & Control ($4.6B), and Non-aviation business ($160M) drive growth.
- Moderate exposure through electro-mechanical and engine technology components; innovation focused on aerospace subsystems.
Huntington Ingalls Industries, Inc.
- Established military shipbuilder focused on U.S. Navy and Coast Guard, facing niche competitive pressures.
- Key segments include Newport News Shipbuilding ($6B), Ingalls Shipbuilding ($2.8B), Mission Technologies ($2.9B).
- Lower exposure to rapid tech shifts; core business centers on shipbuilding and lifecycle sustainment services.
TDG vs HII Positioning
TDG pursues a diversified approach across multiple aerospace component segments, enhancing revenue streams. HII concentrates on naval shipbuilding and defense services, offering focused expertise but less segment diversification. TDG’s broader market exposure contrasts with HII’s specialized niche.
Which has the best competitive advantage?
TDG demonstrates a very favorable moat with growing ROIC exceeding WACC, indicating durable value creation. Conversely, HII shows a very unfavorable moat, with declining ROIC below WACC, reflecting value destruction and weaker competitive positioning.
Stock Comparison
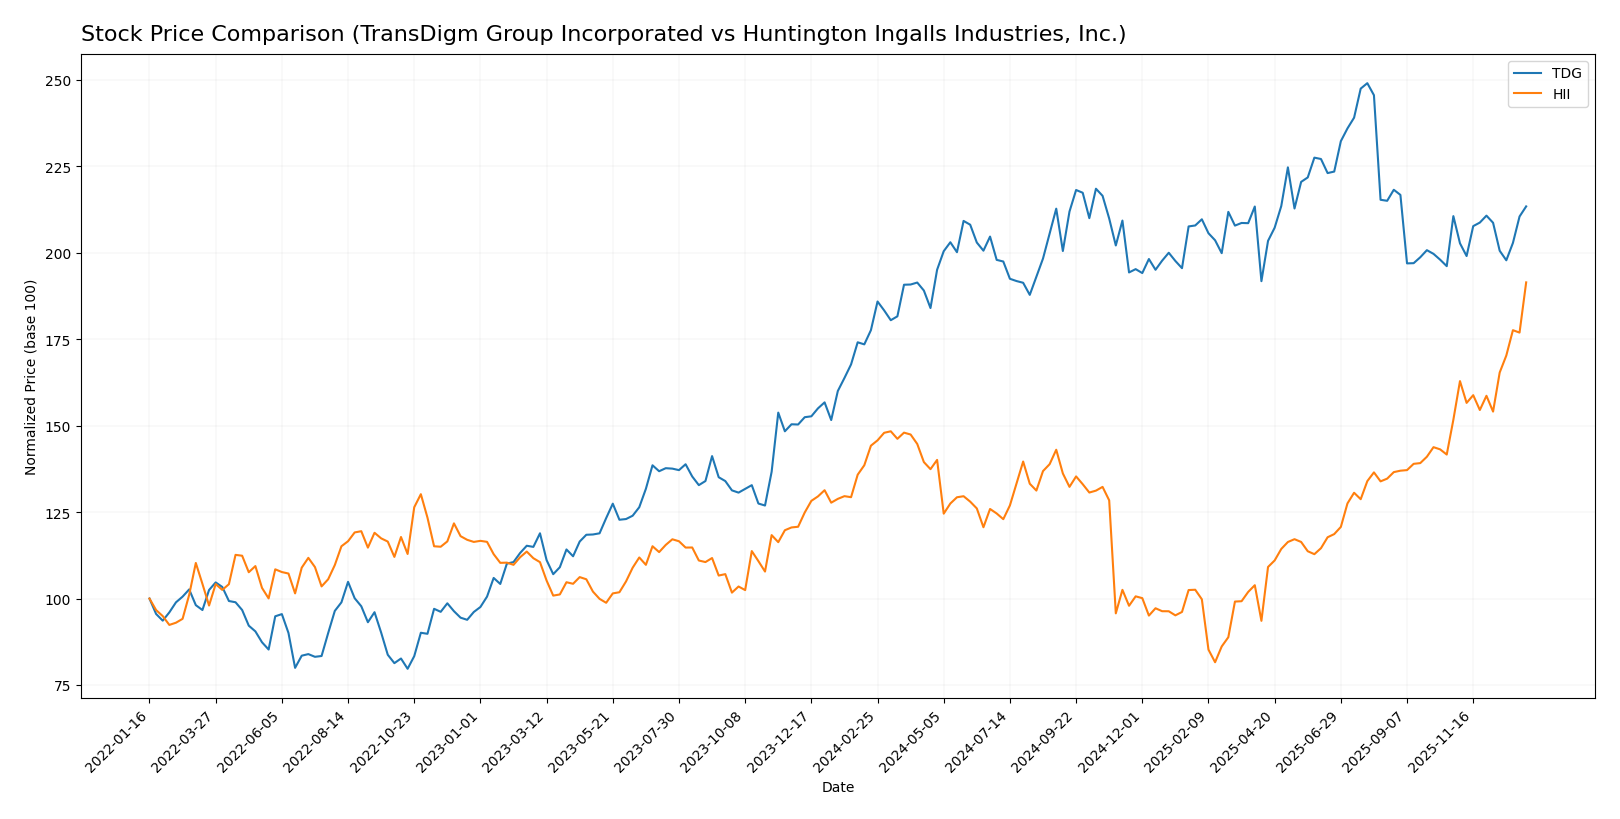
The stock price chart over the past year highlights significant bullish momentum for both TransDigm Group Incorporated (TDG) and Huntington Ingalls Industries, Inc. (HII), with notable price appreciation and dynamic trading volume trends reflecting strong investor interest.
Trend Analysis
TransDigm Group Incorporated (TDG) exhibited a 20.15% price increase over the past 12 months, indicating a bullish trend with decelerating momentum. The stock ranged from a low of 1146.39 to a high of 1607.45, with high volatility reflected by an 89.71 standard deviation.
Huntington Ingalls Industries, Inc. (HII) showed a stronger bullish trend, rising 32.75% over the same period with accelerating momentum. The stock price moved between 161.27 and 378.47, accompanied by moderate volatility at a 43.91 standard deviation.
Comparing both stocks, HII delivered the highest market performance with a 32.75% gain versus TDG’s 20.15%, supported by accelerating price momentum and more dominant buyer volume.
Target Prices
Analysts provide clear target price consensus for TransDigm Group Incorporated and Huntington Ingalls Industries, Inc.
| Company | Target High | Target Low | Consensus |
|---|---|---|---|
| TransDigm Group Incorporated | 1660 | 1370 | 1506.17 |
| Huntington Ingalls Industries, Inc. | 362 | 264 | 327.33 |
The target consensus for TransDigm suggests a moderate upside from its current price of 1377.42 USD, while Huntington Ingalls’ consensus target is below its present price of 378.47 USD, indicating mixed analyst expectations.
Analyst Opinions Comparison
This section compares analysts’ ratings and grades for TransDigm Group Incorporated and Huntington Ingalls Industries, Inc.:
Rating Comparison
TDG Rating
- Rating: C+, considered very favorable overall.
- Discounted Cash Flow Score: Moderate at 3, indicating fair valuation.
- ROE Score: Very unfavorable at 1, showing weak profit generation efficiency.
- ROA Score: Very favorable at 5, indicating strong asset utilization.
- Debt To Equity Score: Very unfavorable at 1, implying higher financial risk.
- Overall Score: Moderate at 2, reflecting a balanced but cautious outlook.
HII Rating
- Rating: B, considered very favorable overall.
- Discounted Cash Flow Score: Favorable at 4, suggesting better valuation.
- ROE Score: Moderate at 3, reflecting average efficiency in profit use.
- ROA Score: Moderate at 3, showing average asset efficiency.
- Debt To Equity Score: Moderate at 2, indicating lower financial risk.
- Overall Score: Moderate at 3, suggesting a stronger overall financial health.
Which one is the best rated?
Based strictly on the data, HII holds a better rating with a ‘B’ compared to TDG’s ‘C+’. HII scores higher in discounted cash flow, ROE, ROA, debt-to-equity, and overall score, indicating a generally stronger financial profile.
Scores Comparison
Here is a comparison of the financial scores for TransDigm Group Incorporated and Huntington Ingalls Industries, Inc.:
TDG Scores
- Altman Z-Score: 1.91, indicating moderate bankruptcy risk in the grey zone.
- Piotroski Score: 6, classified as average financial strength.
HII Scores
- Altman Z-Score: 2.87, also in the grey zone with moderate bankruptcy risk.
- Piotroski Score: 7, indicating strong financial strength.
Which company has the best scores?
Based on the scores provided, HII shows a higher Altman Z-Score and a stronger Piotroski Score than TDG. This suggests HII has relatively better financial stability and strength according to these metrics.
Grades Comparison
Here is a comparison of the latest reliable grades for TransDigm Group Incorporated and Huntington Ingalls Industries, Inc.:
TransDigm Group Incorporated Grades
The following table summarizes recent stock grades from major financial institutions for TransDigm Group:
| Grading Company | Action | New Grade | Date |
|---|---|---|---|
| JP Morgan | Maintain | Neutral | 2025-11-14 |
| Morgan Stanley | Maintain | Overweight | 2025-11-14 |
| RBC Capital | Maintain | Sector Perform | 2025-11-13 |
| BMO Capital | Maintain | Outperform | 2025-11-13 |
| UBS | Maintain | Buy | 2025-11-13 |
| Stifel | Maintain | Buy | 2025-11-13 |
| Morgan Stanley | Maintain | Overweight | 2025-10-15 |
| Truist Securities | Maintain | Buy | 2025-10-15 |
| Susquehanna | Maintain | Neutral | 2025-10-09 |
| Jefferies | Maintain | Buy | 2025-09-17 |
Overall, TransDigm’s grades show a strong buy tendency with multiple buy and outperform ratings and no downgrades.
Huntington Ingalls Industries, Inc. Grades
Below are recent grades from verified financial firms for Huntington Ingalls Industries:
| Grading Company | Action | New Grade | Date |
|---|---|---|---|
| JP Morgan | Maintain | Neutral | 2025-11-03 |
| TD Cowen | Maintain | Buy | 2025-10-31 |
| Goldman Sachs | Maintain | Buy | 2025-10-31 |
| B of A Securities | Maintain | Underperform | 2025-08-13 |
| Barclays | Maintain | Equal Weight | 2025-08-04 |
| TD Cowen | Upgrade | Buy | 2025-07-10 |
| Barclays | Maintain | Equal Weight | 2025-05-05 |
| Goldman Sachs | Maintain | Buy | 2025-05-02 |
| Goldman Sachs | Upgrade | Buy | 2025-04-11 |
| Barclays | Maintain | Equal Weight | 2025-02-10 |
Huntington Ingalls exhibits a more mixed set of ratings, ranging from buy to underperform, with a consensus leaning to hold.
Which company has the best grades?
TransDigm Group has received consistently stronger grades, predominantly buy and outperform ratings, compared to Huntington Ingalls’ mixed ratings including underperform and equal weight. This suggests TransDigm may be viewed more favorably by analysts, potentially influencing investor sentiment towards higher confidence in its outlook.
Strengths and Weaknesses
Below is a comparison table highlighting key strengths and weaknesses of TransDigm Group Incorporated (TDG) and Huntington Ingalls Industries, Inc. (HII) based on their recent financial and strategic profiles.
| Criterion | TransDigm Group Incorporated (TDG) | Huntington Ingalls Industries, Inc. (HII) |
|---|---|---|
| Diversification | Moderate diversification: aviation-focused with Airframe & Power and Control segments dominating; limited non-aviation business (~160M in 2025) | Moderate diversification with three main segments: Newport News Shipbuilding (~5.97B), Mission Technologies (~2.94B), Ingalls (~2.77B) |
| Profitability | High net margin (23.49%), strong ROIC (15.22%), but negative ROE (-21.41%) and some liquidity concerns (current ratio 3.21 unfavorable) | Lower net margin (4.77%) and ROIC (4.74%), positive ROE (11.79%), strong interest coverage (7.77) and sound liquidity ratios |
| Innovation | Very favorable ROIC trend (+72.9%) indicating efficiency and value creation; strong economic moat | Very unfavorable ROIC trend (-57.3%) indicating declining profitability and value destruction; weak moat |
| Global presence | Strong global presence in aerospace components | Primarily U.S.-focused in defense shipbuilding and technologies |
| Market Share | Leading supplier in aerospace components; growing revenue in key segments | Leading U.S. defense shipbuilder with significant market share in naval contracts |
Key takeaways: TransDigm demonstrates a durable competitive advantage with robust profitability and innovation, though its capital efficiency shows mixed signals. Huntington Ingalls struggles with declining profitability and value creation despite solid market positioning, signaling caution for investors seeking growth.
Risk Analysis
Below is a comparative table of key risks for TransDigm Group Incorporated (TDG) and Huntington Ingalls Industries, Inc. (HII) based on the most recent data.
| Metric | TransDigm Group Incorporated (TDG) | Huntington Ingalls Industries, Inc. (HII) |
|---|---|---|
| Market Risk | Moderate (Beta 0.92, sensitive to aerospace sector cycles) | Low (Beta 0.35, less volatile) |
| Debt Level | High (Debt to Assets 131%, unfavorable leverage) | Moderate (Debt to Assets 28%, manageable) |
| Regulatory Risk | Moderate (Defense and aerospace compliance requirements) | Moderate (Naval and nuclear regulations) |
| Operational Risk | Moderate (Complex supply chains, aircraft components) | Moderate (Shipbuilding and nuclear operations) |
| Environmental Risk | Moderate (Manufacturing emissions, aerospace materials) | Moderate (Nuclear operations, shipbuilding waste) |
| Geopolitical Risk | Moderate (Global defense contracts, export controls) | Moderate (U.S. Navy contracts, geopolitical tensions) |
Both companies face moderate regulatory, operational, environmental, and geopolitical risks typical of the aerospace and defense industry. TransDigm’s most impactful risk is its high debt level, which raises financial vulnerability despite solid operational margins. Huntington Ingalls benefits from lower leverage and lower market volatility but remains exposed to complex naval and nuclear regulatory environments. Investors should monitor debt management at TDG and ongoing defense budget allocations affecting HII.
Which Stock to Choose?
TransDigm Group Incorporated (TDG) shows strong income growth with a favorable net margin of 23.49% and sustained revenue increases over 2021-2025. Its financial ratios are slightly favorable overall, with solid ROIC exceeding WACC, yet it carries high debt levels and a mixed rating of C+.
Huntington Ingalls Industries, Inc. (HII) displays a more modest income evolution marked by neutral to unfavorable margins and declining net income over the period. Its financial ratios are also slightly favorable, supported by lower debt and a better rating of B, though its ROIC underperforms WACC indicating value destruction.
For investors, TDG’s higher profitability and very favorable moat status might appeal to those seeking growth, whereas HII’s more stable debt profile and moderate rating could be seen as suitable for risk-averse profiles. Ultimately, the choice may depend on the investor’s tolerance for leverage and preference for growth versus stability.
Disclaimer: Investment carries a risk of loss of initial capital. The past performance is not a reliable indicator of future results. Be sure to understand risks before making an investment decision.
Go Further
I encourage you to read the complete analyses of TransDigm Group Incorporated and Huntington Ingalls Industries, Inc. to enhance your investment decisions: