Home > Comparison > Industrials > BA vs HII
The strategic rivalry between The Boeing Company and Huntington Ingalls Industries defines the current trajectory of the aerospace and defense sector. Boeing operates as a diversified industrial giant with commercial and defense segments, while Huntington Ingalls focuses on specialized military shipbuilding and nuclear support. This head-to-head contrasts broad aerospace innovation against niche defense craftsmanship. This analysis determines which company’s strategic path offers superior risk-adjusted returns for a diversified portfolio in 2026.
Table of contents
Companies Overview
The Boeing Company and Huntington Ingalls Industries stand as pillars in the Aerospace & Defense sector with distinct market footprints.
The Boeing Company: Global Aerospace & Defense Leader
Boeing dominates as a global aerospace giant, generating revenue primarily from commercial airplanes and defense systems. Its 2026 strategy emphasizes expanding the Defense, Space & Security segment alongside bolstering Global Services, aiming to enhance lifecycle support and digital solutions. This diversified portfolio cements Boeing’s position in both commercial and military aerospace markets.
Huntington Ingalls Industries, Inc.: Premier Military Shipbuilder
Huntington Ingalls focuses on designing and building military ships for the U.S. Navy and Coast Guard. Its revenue engine centers on shipbuilding and life-cycle sustainment services, including nuclear-powered vessels and technical solutions. In 2026, the company prioritizes nuclear support and advanced defense technologies to strengthen its niche in naval shipbuilding and federal services.
Strategic Collision: Similarities & Divergences
Both companies serve defense but pursue contrasting philosophies: Boeing leverages a broad aerospace ecosystem, while Huntington Ingalls specializes in naval shipbuilding with a focus on bespoke military vessels. They compete indirectly for defense budgets, with Boeing targeting air and space systems and Huntington Ingalls commanding the maritime domain. Their investment profiles differ sharply—Boeing offers diversified aerospace exposure, Huntington Ingalls delivers focused naval defense expertise.
Income Statement Comparison
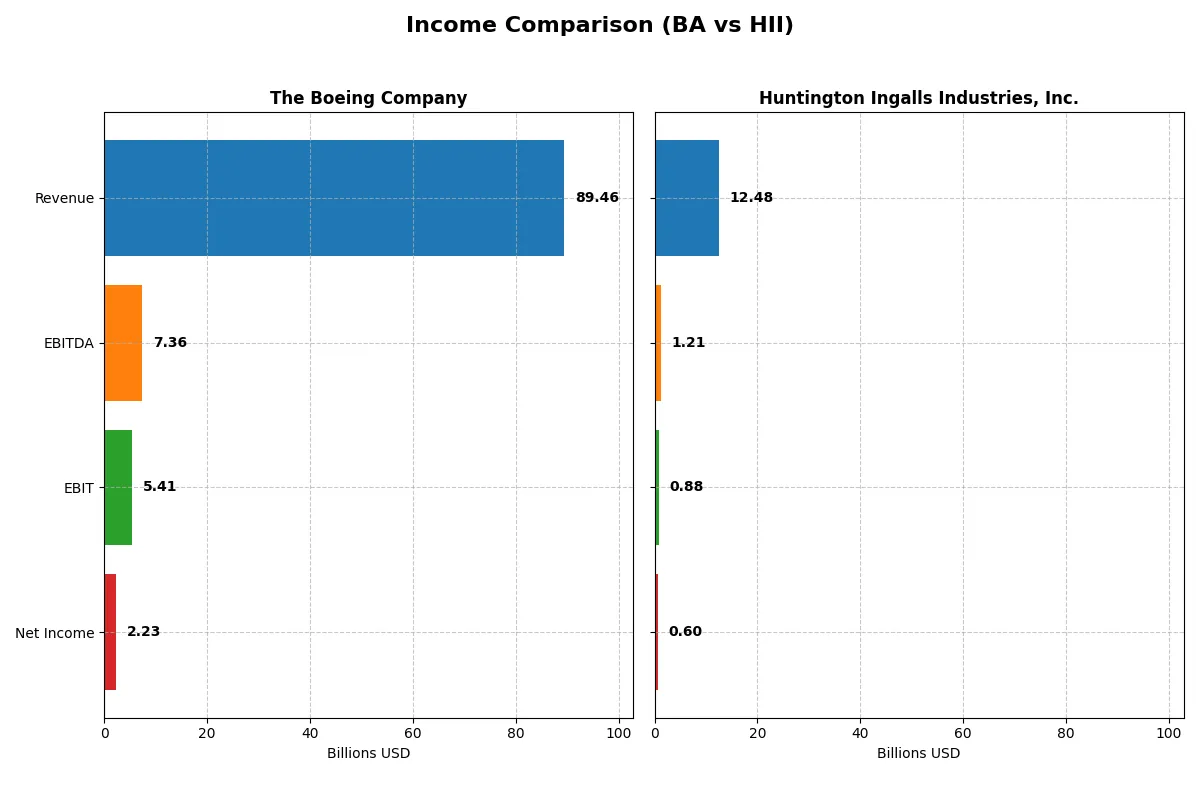
This data dissects the core profitability and scalability of both corporate engines to reveal who dominates the bottom line:
| Metric | The Boeing Company (BA) | Huntington Ingalls Industries, Inc. (HII) |
|---|---|---|
| Revenue | 89.5B | 12.5B |
| Cost of Revenue | 85.2B | 10.9B |
| Operating Expenses | 9.7B | 977M |
| Gross Profit | 4.3B | 1.6B |
| EBITDA | 7.4B | 1.2B |
| EBIT | 5.4B | 882M |
| Interest Expense | 2.8B | 105M |
| Net Income | 2.2B | 605M |
| EPS | 2.49 | 15.39 |
| Fiscal Year | 2025 | 2025 |
Income Statement Analysis: The Bottom-Line Duel
This income statement comparison reveals each company’s operational efficiency and profitability trends over the recent fiscal years.
The Boeing Company Analysis
Boeing’s revenue climbed from $62B in 2021 to $89B in 2025, showing strong growth momentum. Its gross margin fluctuated widely, hitting a low negative in 2024 before recovering to 4.8% in 2025. Net income swung from a steep loss in 2024 to a positive $2.2B in 2025, reflecting a sharp turnaround in operational efficiency and cost control.
Huntington Ingalls Industries, Inc. Analysis
Huntington Ingalls steadily increased revenue from $9.5B in 2021 to $12.5B in 2025, maintaining a solid gross margin near 12.7%. Its net income rose consistently to $605M in 2025 with a stable net margin around 4.8%, highlighting consistent profitability and controlled expenses amid steady growth.
Margin Resilience vs. Growth Volatility
Boeing exhibits volatile earnings but achieves a powerful rebound in 2025, signaling strong operational recovery and margin improvement. Huntington Ingalls delivers steady, moderate growth with consistent profitability and healthier margins. For investors, Boeing’s profile offers high momentum but higher risk, while Huntington Ingalls presents reliable earnings stability and margin resilience.
Financial Ratios Comparison
These vital ratios act as a diagnostic tool to expose the underlying fiscal health, valuation premiums, and capital efficiency for the companies compared below:
| Ratios | The Boeing Company (BA) | Huntington Ingalls Industries, Inc. (HII) |
|---|---|---|
| ROE | 41.0% | 11.9% |
| ROIC | -6.7% | 9.0% |
| P/E | 74.1 | 22.1 |
| P/B | 30.3 | 2.63 |
| Current Ratio | 1.27 | 1.13 |
| Quick Ratio | 0.49 | 1.06 |
| D/E (Debt-to-Equity) | 9.92 | 0.62 |
| Debt-to-Assets | 32.2% | 24.7% |
| Interest Coverage | -1.95 | 5.79 |
| Asset Turnover | 0.53 | 0.98 |
| Fixed Asset Turnover | 5.73 | 3.35 |
| Payout Ratio | 14.8% | 35.2% |
| Dividend Yield | 0.20% | 1.59% |
| Fiscal Year | 2025 | 2025 |
Efficiency & Valuation Duel: The Vital Signs
Financial ratios serve as a company’s DNA, exposing hidden risks and operational strengths that raw numbers alone cannot reveal.
The Boeing Company
Boeing shows a high return on equity at 41%, indicating strong profitability, but suffers from a low net margin of 2.5%. Its valuation is stretched, with a P/E ratio of 74 and a P/B ratio exceeding 30, suggesting overvaluation. Dividend yield is negligible at 0.2%, with limited shareholder returns and reinvestment focused on sustaining operations amid debt challenges.
Huntington Ingalls Industries, Inc.
HII posts a moderate ROE of 12% and a healthier net margin near 4.9%. Its valuation appears reasonable with a P/E around 22 and P/B near 2.6, reflecting fair pricing. The dividend yield at 1.59% supports shareholder income, while strong interest coverage and manageable debt levels bolster financial stability and operational efficiency.
Premium Valuation vs. Operational Safety
Boeing’s exceptional ROE contrasts with its stretched valuation and financial risks, while HII balances moderate profitability with stronger financial health. Investors prioritizing growth might lean Boeing’s profile; those valuing stability and income may prefer HII’s steadier metrics.
Which one offers the Superior Shareholder Reward?
I compare Boeing and Huntington Ingalls Industries (HII) on dividends, payout ratios, and buybacks. Boeing yields a meager 0.2% with a low 15% payout ratio, reflecting minimal dividend commitment. HII offers a 1.6% dividend yield and a 35% payout ratio, signaling stronger income focus. Boeing’s free cash flow is negative (-2.46/share), making its dividend coverage unsustainable, while HII generates robust free cash flow of 20.2/share, comfortably covering dividends. Both engage in buybacks, but HII’s superior cash flow and moderate leverage support a more sustainable buyback program. I conclude HII provides a more attractive total shareholder return profile in 2026.
Comparative Score Analysis: The Strategic Profile
The radar chart reveals the fundamental DNA and trade-offs of The Boeing Company and Huntington Ingalls Industries, Inc., highlighting their strategic strengths and weaknesses:
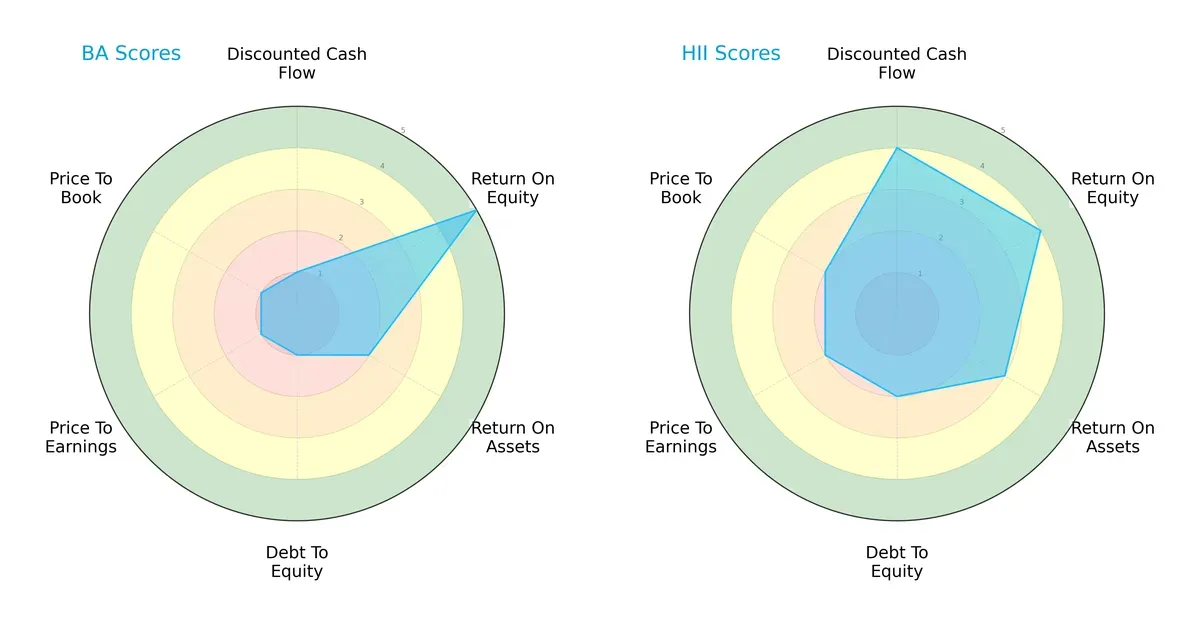
Huntington Ingalls delivers a more balanced profile with solid DCF (4) and ROE (4) scores, showing efficient capital use and reasonable valuation metrics. Boeing, however, relies heavily on its strong ROE (5) but struggles with weak DCF (1), debt (1), and valuation scores (1 across P/E and P/B). This suggests Boeing depends on operational profitability while facing financial and valuation pressures, unlike Huntington’s steadier financial footing.
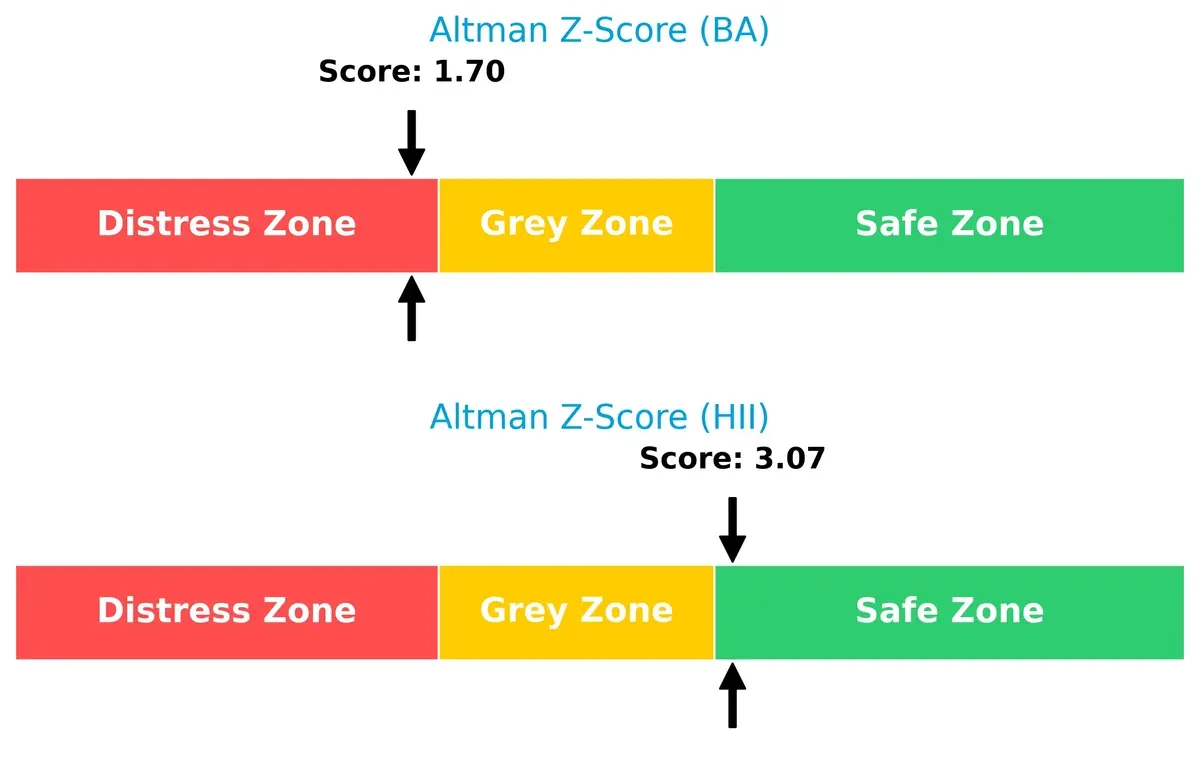
Bankruptcy Risk: Solvency Showdown
The Altman Z-Score comparison highlights Huntington Ingalls comfortably in the safe zone (3.07), while Boeing lingers in the distress zone (1.70), signaling a higher bankruptcy risk for Boeing in this cycle:
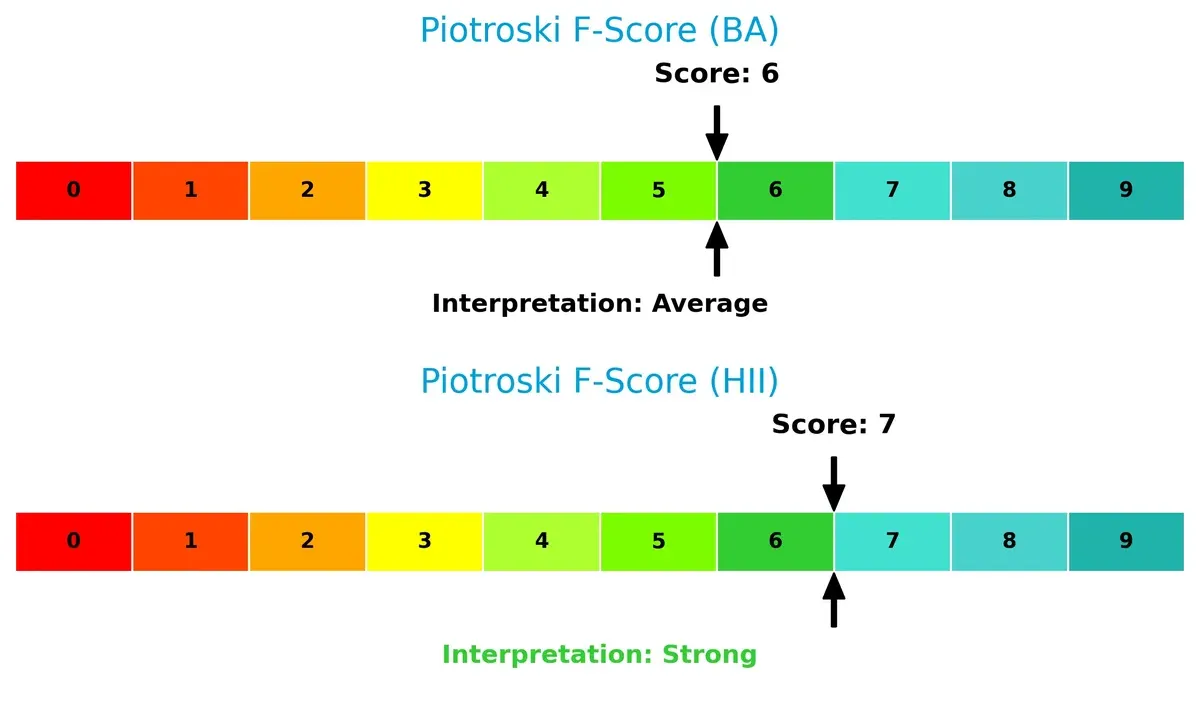
Financial Health: Quality of Operations
Huntington Ingalls scores a strong 7 on the Piotroski F-Score, indicating robust financial health and operational quality. Boeing’s 6 suggests average health with potential red flags in internal metrics compared to Huntington:
How are the two companies positioned?
This section dissects the operational DNA of Boeing and Huntington Ingalls by comparing their revenue distribution and internal strengths and weaknesses. The goal is to confront their economic moats and identify which model offers the most resilient, sustainable advantage today.
Revenue Segmentation: The Strategic Mix
The following visual comparison dissects how The Boeing Company and Huntington Ingalls Industries diversify their income streams and where their primary sector bets lie:
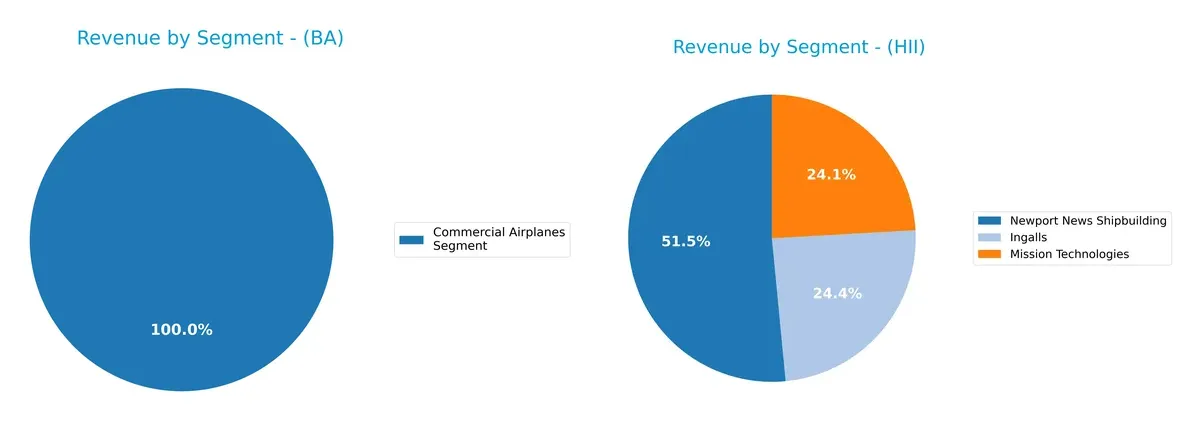
Boeing shows a more diversified revenue mix, with its 2024 segments spanning Commercial Airplanes ($22.9B), Global Services ($19.9B), and Defense Space Security ($23.9B). Huntington Ingalls leans heavily on Newport News Shipbuilding ($6.5B in 2025), anchoring its revenue, while Ingalls and Mission Technologies contribute smaller, balanced shares. Boeing’s broad portfolio reduces concentration risk, whereas Huntington’s focus reflects infrastructure dominance but invites higher dependency risk.
Strengths and Weaknesses Comparison
This table compares the strengths and weaknesses of Boeing and Huntington Ingalls based on diversification, profitability, financials, innovation, global presence, and market share:
Boeing Strengths
- Highly diversified revenue streams across commercial airplanes, defense, and global services
- Strong ROE of 41% indicates efficient equity use
- Global presence with significant US and international sales
- Favorable fixed asset turnover of 5.73 reflects efficient use of assets
Huntington Ingalls Strengths
- Favorable WACC at 4.94% supports lower capital costs
- Strong interest coverage ratio of 8.4 signals financial stability
- Favorable quick ratio of 1.06 indicates good liquidity
- Diversified business segments including shipbuilding and technologies
- Lower debt-to-assets ratio at 25% reduces financial risk
Boeing Weaknesses
- Negative ROIC of -6.71% shows poor capital returns
- High P/E at 74 suggests overvaluation risk
- Low quick ratio of 0.49 indicates liquidity challenges
- Elevated debt-to-equity of 9.92 increases leverage risk
- Unfavorable net margin at 2.5% limits profitability
- Weak interest coverage ratio of 1.95 raises solvency concerns
Huntington Ingalls Weaknesses
- Unfavorable net margin at 4.85% highlights margin pressures
- Neutral ROE at 11.93% reflects average equity returns
- Neutral P/E and PB ratios limit valuation appeal
- Absence of reported global revenue data limits global exposure insight
Boeing’s broad diversification and high ROE contrast with its weak capital returns and liquidity concerns. Huntington Ingalls shows financial stability and lower leverage but faces profitability and valuation challenges. These factors shape their strategic positioning and risk profiles.
The Moat Duel: Analyzing Competitive Defensibility
A structural moat is the only true shield protecting long-term profits from relentless competition erosion. Let’s dissect the key competitive advantages of two aerospace giants:
The Boeing Company: Scale and Diversification Moat
Boeing’s moat stems from its vast scale and diversified aerospace portfolio. Despite a declining ROIC below WACC, its revenue surged 35% in 2025, signaling strong market demand. However, profitability erosion threatens margin stability in 2026 unless innovation or new markets accelerate.
Huntington Ingalls Industries, Inc.: Niche Specialization Moat
HII’s moat lies in its specialized naval shipbuilding and defense services, generating ROIC notably above WACC with a positive growth trend. Compared to Boeing, HII delivers steadier profitability and margin expansion, positioning it well for potential government contract growth in 2026.
Scale Dominance vs. Specialized Value Creation
HII exhibits a deeper, more sustainable moat with positive ROIC trends and efficient capital deployment. Boeing’s broad scale offers revenue growth but suffers value destruction. HII stands better equipped to defend and expand its market share amid competitive pressures.
Which stock offers better returns?
The past year shows strong bullish momentum for both The Boeing Company and Huntington Ingalls Industries, with notable price gains and accelerating trends.
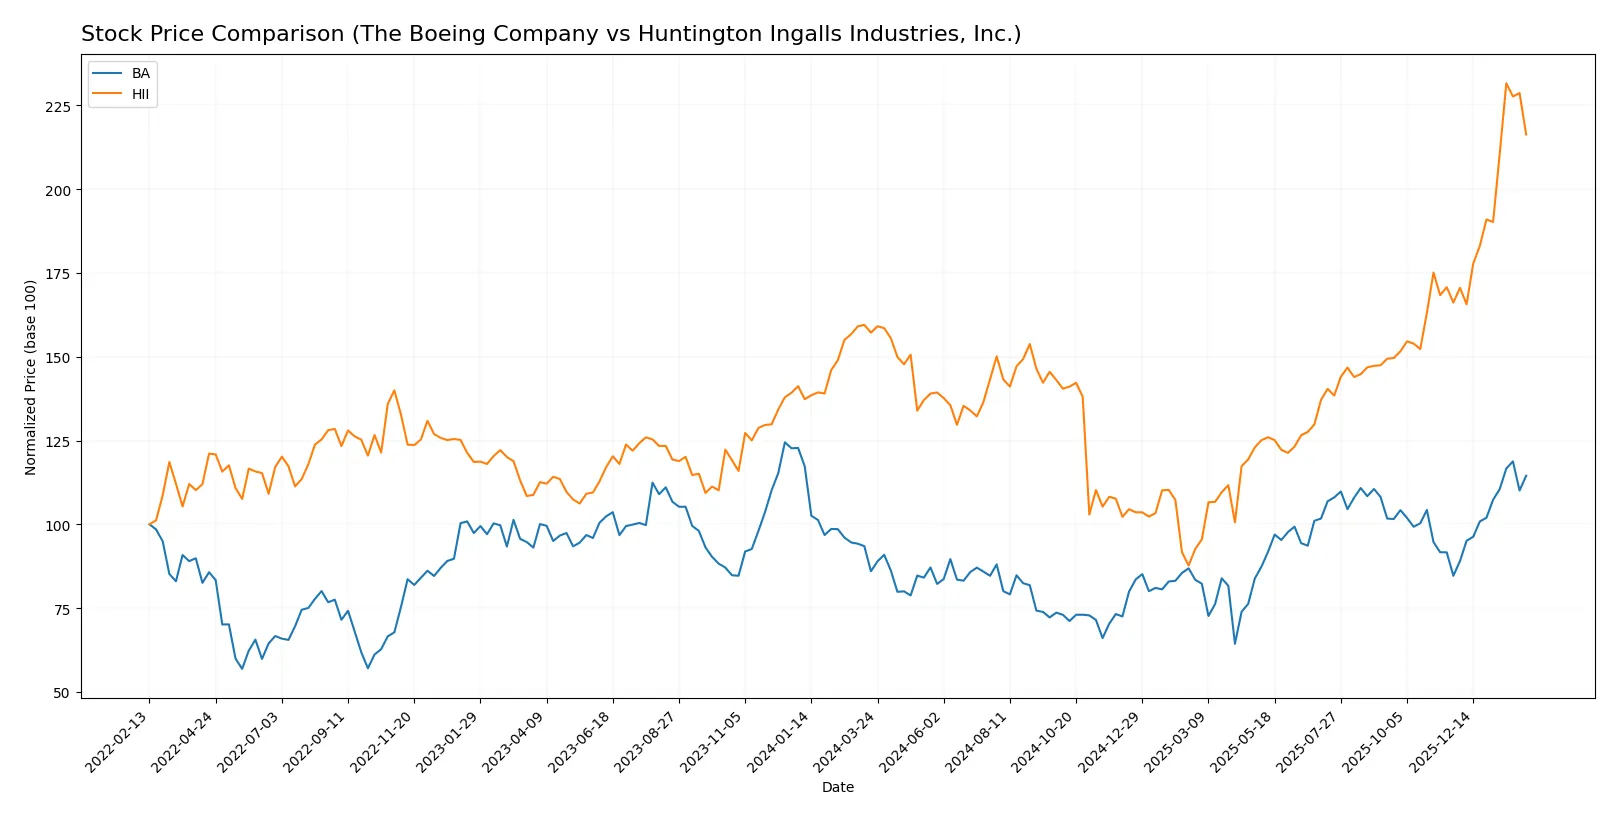
Trend Comparison
The Boeing Company’s stock rose 33.15% over the past year, exhibiting a bullish trend with accelerating momentum and a high of 252.15. Volatility measured by standard deviation is moderate at 26.94.
Huntington Ingalls Industries gained 37.63% in the same period, also bullish with acceleration. It reached a peak of 425.9 but shows higher volatility, with a standard deviation of 54.23.
Huntington Ingalls Industries outperformed The Boeing Company by approximately 4.5%, delivering the stronger market return despite greater price swings.
Target Prices
Analysts present a bullish consensus for both Boeing and Huntington Ingalls Industries, reflecting strong sector dynamics.
| Company | Target Low | Target High | Consensus |
|---|---|---|---|
| The Boeing Company | 150 | 298 | 260.36 |
| Huntington Ingalls Industries, Inc. | 264 | 419 | 365 |
The Boeing consensus target of 260.36 exceeds its current price of 243.03, signaling moderate upside. Huntington Ingalls’ target at 365 also suggests room for appreciation from 397.77 current price, indicating strong analyst confidence but greater valuation risk.

Don’t Let Luck Decide Your Entry Point
Optimize your entry points with our advanced ProRealTime indicators. You’ll get efficient buy signals with precise price targets for maximum performance. Start outperforming now!
How do institutions grade them?
The following tables summarize recent institutional grades for The Boeing Company and Huntington Ingalls Industries, Inc.:
The Boeing Company Grades
Below are the latest grades issued by prominent financial institutions for Boeing.
| Grading Company | Action | New Grade | Date |
|---|---|---|---|
| Jefferies | Maintain | Buy | 2026-02-02 |
| JP Morgan | Maintain | Overweight | 2026-01-28 |
| RBC Capital | Maintain | Outperform | 2026-01-28 |
| Citigroup | Maintain | Buy | 2026-01-28 |
| UBS | Maintain | Buy | 2026-01-28 |
| Bernstein | Maintain | Outperform | 2026-01-15 |
| Citigroup | Maintain | Buy | 2026-01-13 |
| JP Morgan | Maintain | Overweight | 2025-12-19 |
| Susquehanna | Maintain | Positive | 2025-11-12 |
| Freedom Capital Markets | Upgrade | Buy | 2025-11-03 |
Huntington Ingalls Industries, Inc. Grades
Presented here are recent institutional grades for Huntington Ingalls Industries.
| Grading Company | Action | New Grade | Date |
|---|---|---|---|
| Goldman Sachs | Maintain | Buy | 2026-01-20 |
| Citigroup | Maintain | Buy | 2026-01-13 |
| JP Morgan | Maintain | Neutral | 2025-11-03 |
| Goldman Sachs | Maintain | Buy | 2025-10-31 |
| TD Cowen | Maintain | Buy | 2025-10-31 |
| B of A Securities | Maintain | Underperform | 2025-08-13 |
| Barclays | Maintain | Equal Weight | 2025-08-04 |
| TD Cowen | Upgrade | Buy | 2025-07-10 |
| Barclays | Maintain | Equal Weight | 2025-05-05 |
| Goldman Sachs | Maintain | Buy | 2025-05-02 |
Which company has the best grades?
Boeing consistently earns higher grades such as Buy, Outperform, and Overweight from multiple top-tier firms. Huntington Ingalls shows a mix of Buy and Neutral ratings, with some Underperform and Equal Weight grades. Investors may view Boeing’s stronger consensus as a more favorable signal for potential upside.
Risks specific to each company
The following categories identify critical pressure points and systemic threats facing both firms in the 2026 market environment:
1. Market & Competition
The Boeing Company
- Faces intense competition in commercial and defense aerospace, with high R&D costs and cyclical demand volatility.
Huntington Ingalls Industries, Inc.
- Operates in specialized military shipbuilding, benefiting from steady U.S. Navy contracts but limited market diversification.
2. Capital Structure & Debt
The Boeing Company
- High debt-to-equity ratio (9.92) signals aggressive leverage, raising financial risk amid low interest coverage (1.95).
Huntington Ingalls Industries, Inc.
- Maintains conservative leverage (D/E 0.62) with strong interest coverage (8.4), supporting financial stability.
3. Stock Volatility
The Boeing Company
- Beta of 1.14 indicates above-market volatility, reflecting sensitivity to economic cycles and sector risks.
Huntington Ingalls Industries, Inc.
- Low beta of 0.33 suggests stock stability, appealing to risk-averse investors.
4. Regulatory & Legal
The Boeing Company
- Faces scrutiny over safety regulations and export controls, especially after past operational issues.
Huntington Ingalls Industries, Inc.
- Subject to stringent defense contracting regulations but fewer high-profile legal challenges.
5. Supply Chain & Operations
The Boeing Company
- Complex global supply chains expose Boeing to disruption risks and inflationary pressures.
Huntington Ingalls Industries, Inc.
- More localized supply chain reduces exposure but depends heavily on government procurement cycles.
6. ESG & Climate Transition
The Boeing Company
- Pressure to reduce emissions in manufacturing and aircraft operations amid rising stakeholder scrutiny.
Huntington Ingalls Industries, Inc.
- Faces ESG demands in nuclear operations and environmental management, with significant compliance costs.
7. Geopolitical Exposure
The Boeing Company
- Global sales subject to geopolitical tensions, trade restrictions, and export controls.
Huntington Ingalls Industries, Inc.
- Primarily U.S.-focused operations limit geopolitical risks but rely on federal defense budgets.
Which company shows a better risk-adjusted profile?
Boeing’s most impactful risk is its high leverage and low interest coverage, which raise bankruptcy concerns. Huntington’s main risk lies in its dependence on government contracts, exposing it to budgetary shifts. Huntington displays a better risk-adjusted profile, supported by a strong Altman Z-score (3.07) and prudent capital structure. Boeing’s distress-zone Z-score (1.7) and unfavorable liquidity metrics justify caution.
Final Verdict: Which stock to choose?
The Boeing Company’s superpower lies in its scale and revenue growth momentum, reflecting its ability to rebound in aerospace demand cycles. However, its declining return on invested capital signals a value destruction trend, demanding caution. It suits aggressive growth portfolios willing to weather operational and financial volatility.
Huntington Ingalls Industries boasts a strategic moat with consistent value creation and a strong capital efficiency track record. Its safer balance sheet and improving ROIC compared to Boeing provide a more stable investment profile. This stock aligns well with GARP investors seeking a balance of growth and financial discipline.
If you prioritize high-growth potential and can tolerate operational risks, Boeing could be the compelling choice due to its market scale and growth acceleration. However, if you seek better stability and sustainable value creation, Huntington Ingalls offers superior capital efficiency and a stronger financial foundation for measured growth.
Disclaimer: Investment carries a risk of loss of initial capital. The past performance is not a reliable indicator of future results. Be sure to understand risks before making an investment decision.
Go Further
I encourage you to read the complete analyses of The Boeing Company and Huntington Ingalls Industries, Inc. to enhance your investment decisions: