Home > Comparison > Industrials > TXT vs HII
The strategic rivalry between Textron Inc. and Huntington Ingalls Industries defines the current trajectory of the Aerospace & Defense sector. Textron operates a diversified industrial model spanning aviation, defense, and specialized vehicles, while Huntington Ingalls focuses on capital-intensive military shipbuilding and naval support. This analysis explores their contrasting growth and value propositions to identify which corporate trajectory offers superior risk-adjusted returns for a diversified portfolio.
Table of contents
Companies Overview
Textron Inc. and Huntington Ingalls Industries, Inc. are key players shaping the aerospace and defense landscape in 2026.
Textron Inc.: Diversified Aerospace & Defense Powerhouse
Textron dominates with a diversified aerospace and defense portfolio spanning business jets, military aircraft, helicopters, and advanced marine crafts. Its revenue streams include manufacturing, servicing, and financing aircraft and specialty vehicles. In 2026, Textron sharpens its focus on integrated defense solutions and expanding its aviation aftermarket services to strengthen its competitive edge.
Huntington Ingalls Industries, Inc.: Premier Military Shipbuilder
Huntington Ingalls is the leading U.S. military shipbuilder, specializing in nuclear and non-nuclear vessels for the Navy and Coast Guard. Its core revenue comes from ship design, construction, overhaul, and sustainment services. The company prioritizes delivering advanced naval platforms and nuclear support services while expanding its high-end IT and mission-based defense solutions.
Strategic Collision: Similarities & Divergences
Both firms operate in aerospace and defense but follow distinct paths: Textron favors a diversified product mix across multiple domains, while Huntington Ingalls focuses exclusively on naval shipbuilding and sustainment. They clash primarily in defense contracting, competing for government budgets. Textron offers broader market exposure; Huntington Ingalls presents a more concentrated, defense-heavy profile with a stable backlog.
Income Statement Comparison
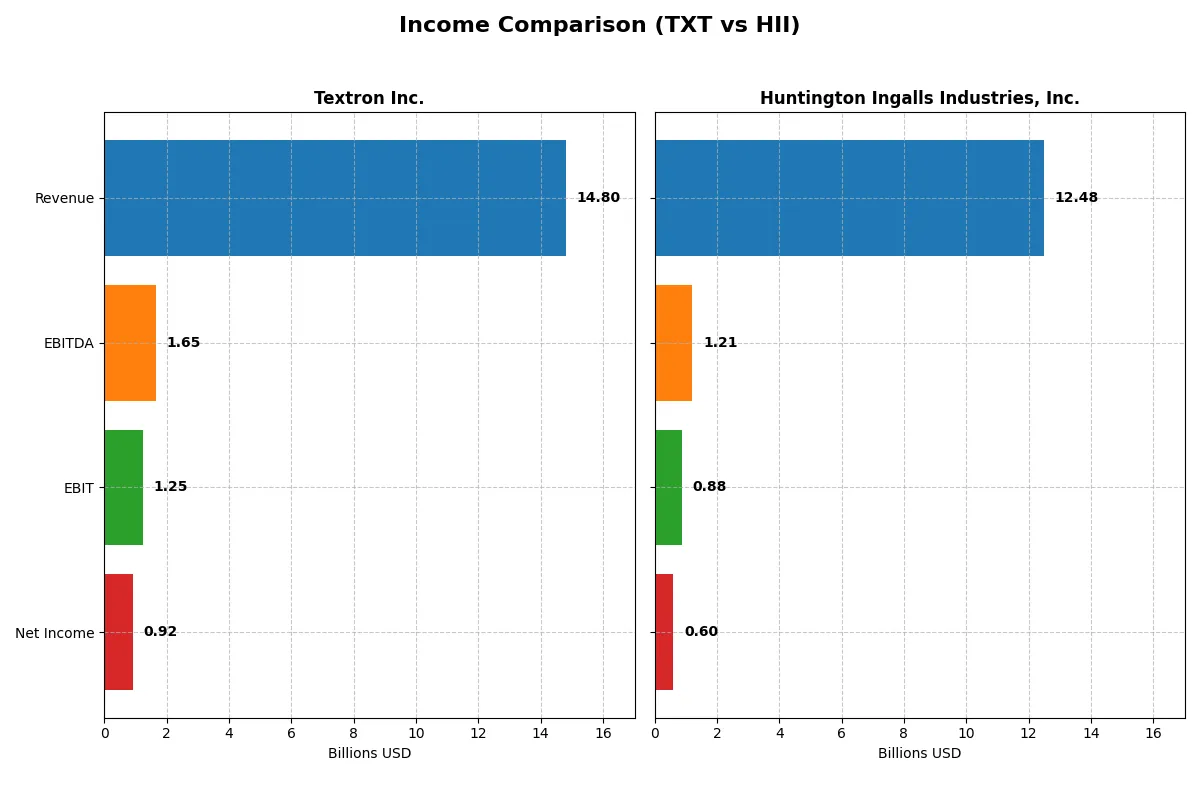
This data dissects the core profitability and scalability of both corporate engines to reveal who dominates the bottom line:
| Metric | Textron Inc. (TXT) | Huntington Ingalls Industries, Inc. (HII) |
|---|---|---|
| Revenue | 14.8B | 12.5B |
| Cost of Revenue | 12.3B | 10.9B |
| Operating Expenses | 1.3B | 977M |
| Gross Profit | 2.5B | 1.6B |
| EBITDA | 1.6B | 1.2B |
| EBIT | 1.2B | 882M |
| Interest Expense | 97M | 105M |
| Net Income | 921M | 605M |
| EPS | 5.11 | 15.39 |
| Fiscal Year | 2025 | 2025 |
Income Statement Analysis: The Bottom-Line Duel
This income statement comparison uncovers how efficiently each company converts revenue into profit and operational strength.
Textron Inc. Analysis
Textron’s revenue climbed steadily from $12.4B in 2021 to nearly $14.8B in 2025, lifting net income from $746M to $921M. Its gross margin stabilized around 16.9%, while net margin improved modestly to 6.2%, signaling solid cost control. In 2025, EBIT surged 20% year-over-year, showing strong momentum in operational efficiency.
Huntington Ingalls Industries, Inc. Analysis
HII’s revenue expanded from $9.5B in 2021 to $12.5B in 2025, with net income rising from $544M to $605M. Gross margin hovered near 12.7%, while net margin remained under 5%, reflecting tighter profitability. Despite solid 8% revenue growth in 2025, EBIT margin at 7.1% trails Textron’s, indicating lower operational leverage.
Margin Strength vs. Revenue Growth
Textron leads with higher margins and stronger net income growth, demonstrating superior operational efficiency. Huntington Ingalls posts faster revenue growth but struggles to convert sales into comparable profit. For investors prioritizing margin resilience and earnings momentum, Textron’s profile appears more compelling.
Financial Ratios Comparison
These vital ratios act as a diagnostic tool to expose the underlying fiscal health, valuation premiums, and capital efficiency of the companies compared:
| Ratios | Textron Inc. (TXT) | Huntington Ingalls Industries, Inc. (HII) |
|---|---|---|
| ROE | 11.7% | 11.9% |
| ROIC | 9.4% | 9.0% |
| P/E | 17.0x | 22.1x |
| P/B | 2.0x | 2.6x |
| Current Ratio | 5.9 | 1.1 |
| Quick Ratio | 2.3 | 1.1 |
| D/E | 0.45 | 0.62 |
| Debt-to-Assets | 19.5% | 24.7% |
| Interest Coverage | 12.9x | 5.8x |
| Asset Turnover | 0.82 | 0.98 |
| Fixed Asset Turnover | 5.7 | 3.4 |
| Payout Ratio | 2.1% | 35.2% |
| Dividend Yield | 0.12% | 1.59% |
| Fiscal Year | 2025 | 2025 |
Efficiency & Valuation Duel: The Vital Signs
Ratios act as the company’s DNA, revealing hidden risks and operational excellence crucial for discerning informed investment choices.
Textron Inc.
Textron posts a neutral 11.7% ROE and a 6.22% net margin, reflecting steady profitability. Its P/E of 17.04 and P/B near 2 suggest a fairly valued stock. The company maintains a slightly favorable capital structure with low debt levels. Dividend yield lags at 0.12%, indicating reinvestment into R&D for growth rather than shareholder payouts.
Huntington Ingalls Industries, Inc.
Huntington Ingalls shows a neutral ROE of 11.93% but a weaker net margin of 4.85%. Valuation appears stretched with a P/E of 22.09 and a higher P/B of 2.63. The firm supports shareholders with a 1.59% dividend yield, balancing payouts with measured debt levels. Operationally, it delivers moderate asset efficiency amid industry challenges.
Valuation Balance vs. Operational Efficiency
Textron offers a more balanced risk-reward profile with solid profitability, conservative leverage, and growth-focused capital allocation. Huntington Ingalls’ higher valuation and dividend yield suit investors prioritizing income but carry margin pressure risks. The choice hinges on preference for growth reinvestment versus income stability.
Which one offers the Superior Shareholder Reward?
I see Textron (TXT) delivers a minimal dividend yield near 0.12% with a payout ratio around 2%. Its buyback pace is modest but consistent, supported by strong free cash flow (4.9/share). Huntington Ingalls (HII) pays a hefty 1.6% yield with a 35% payout ratio but free cash flow barely covers dividends. TXT’s conservative dividend and steady buybacks offer sustainable growth. HII’s high yield risks cash flow strain amid capex demands. I conclude TXT offers a superior total return profile in 2026, balancing income with prudent capital allocation.
Comparative Score Analysis: The Strategic Profile
The radar chart reveals the fundamental DNA and trade-offs of Textron Inc. and Huntington Ingalls Industries, showcasing their financial strengths and weaknesses side by side:
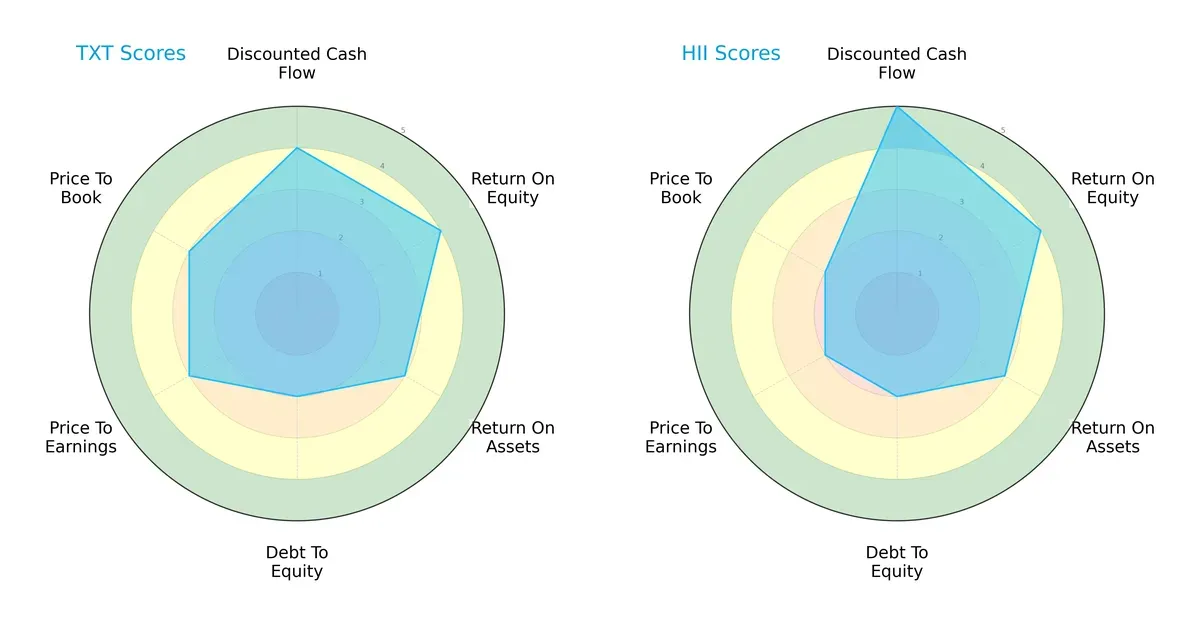
Textron displays a balanced profile with solid DCF (4) and ROE (4) scores, but it carries a heavier debt burden (Debt/Equity score 2). Huntington Ingalls excels in DCF (5) but falls short on valuation metrics (P/E 2, P/B 2), suggesting reliance on cash flow strength rather than market pricing. Both share moderate ROA (3) and identical overall scores (3), but Textron’s fair valuation contrasts with HII’s undervaluation hints.
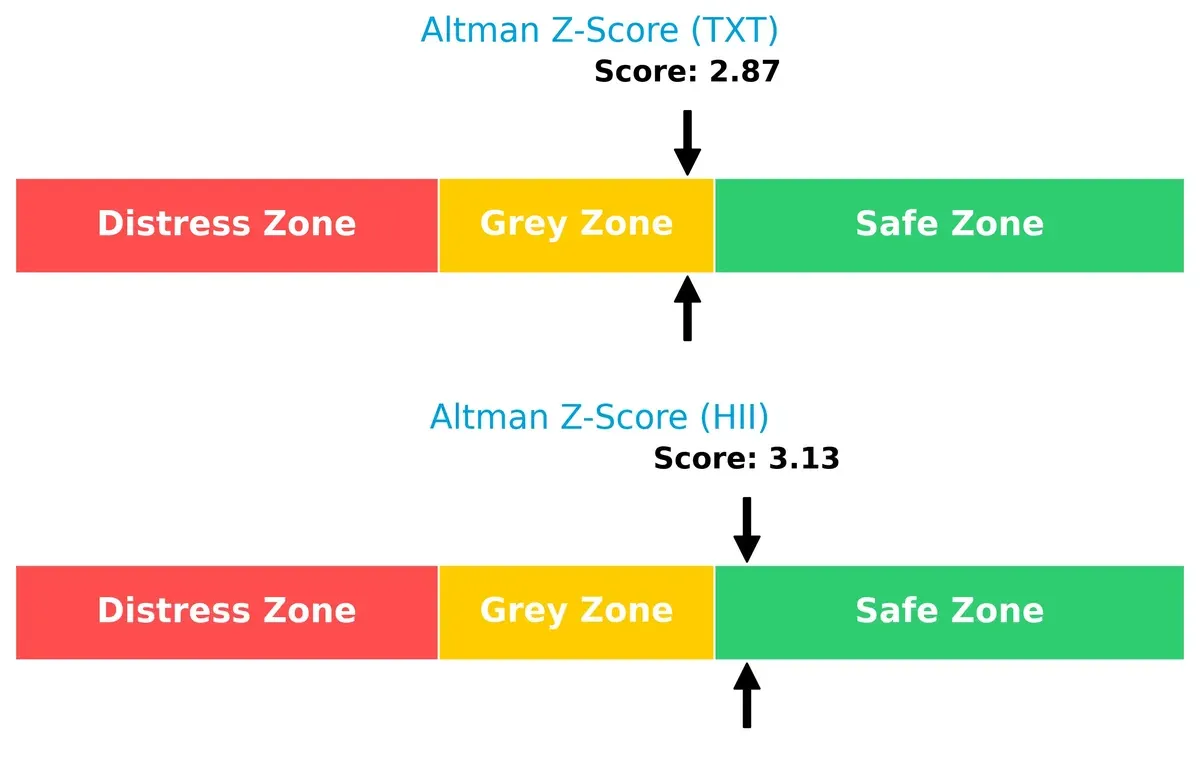
Bankruptcy Risk: Solvency Showdown
The Altman Z-Score difference indicates Huntington Ingalls (3.13) holds a safer financial position than Textron (2.87), implying better resilience against bankruptcy risks in this economic cycle:
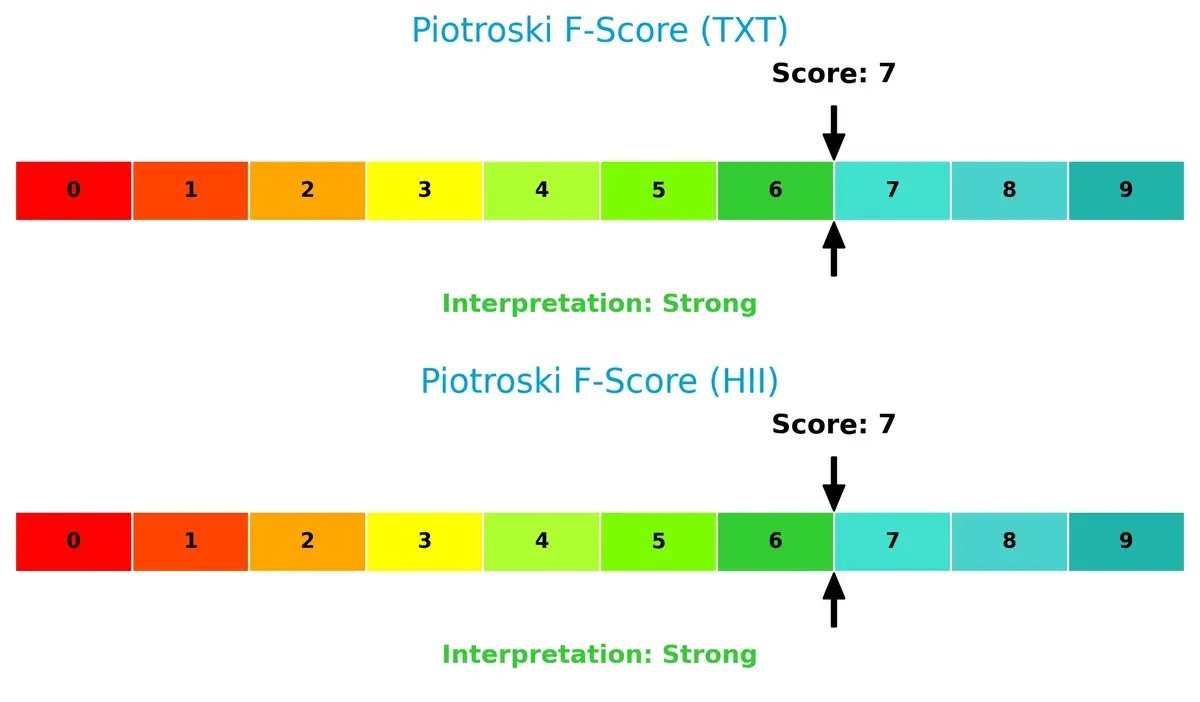
Financial Health: Quality of Operations
Both companies score a robust 7 on the Piotroski F-Score, signaling strong operational quality and internal financial health with no immediate red flags differentiating them clearly:
How are the two companies positioned?
This section dissects the operational DNA of TXT and HII by comparing revenue distribution and internal dynamics. The goal is to confront their economic moats to identify the most resilient, sustainable competitive advantage today.
Revenue Segmentation: The Strategic Mix
This visual comparison dissects how Textron Inc. and Huntington Ingalls Industries diversify their income streams and pinpoints their primary sector bets:
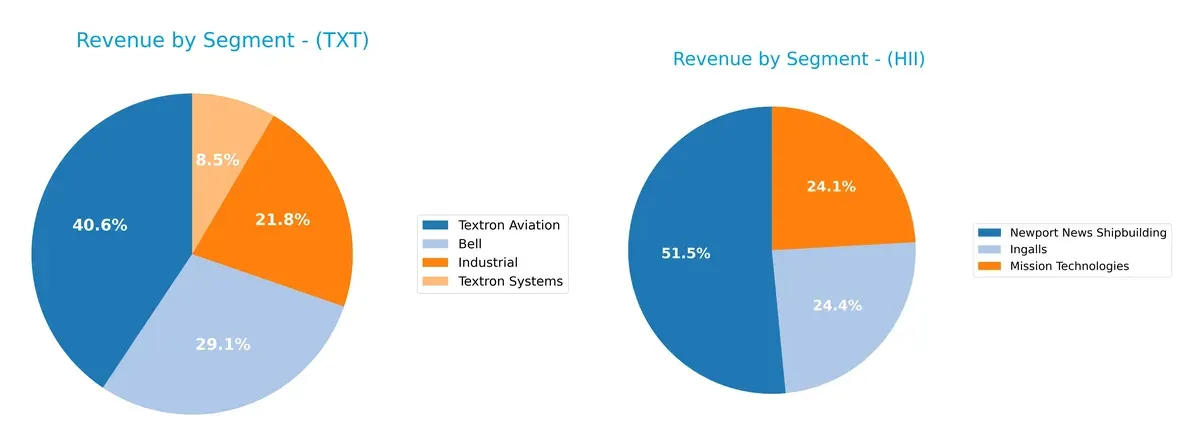
Textron’s revenue spreads across four solid pillars, with Textron Aviation anchoring at $6B, followed by Bell at $4.3B. Huntington Ingalls leans heavily on Newport News Shipbuilding, which dwarfs other segments at $6.5B, while Ingalls and Mission Technologies hover around $3B each. Textron’s diversified mix reduces concentration risk, fostering resilience. In contrast, Huntington’s reliance on shipbuilding signals infrastructure dominance but exposes it to sector cyclicality.
Strengths and Weaknesses Comparison
This table compares the strengths and weaknesses of Textron Inc. and Huntington Ingalls Industries, Inc.:
Textron Inc. Strengths
- Diverse revenue streams across aviation, industrial, and defense segments
- Favorable WACC at 7.36% supports efficient capital use
- Strong liquidity with quick ratio of 2.33
- Low debt-to-assets at 19.49% reduces financial risk
Huntington Ingalls Industries Strengths
- Focused revenue in shipbuilding and technologies with large contracts
- Very favorable WACC at 4.81% enhances capital efficiency
- Interest coverage ratio of 8.4 indicates solid debt servicing ability
- Favorable fixed asset turnover of 3.35 reflects asset utilization
Textron Inc. Weaknesses
- Unfavorable current ratio at 5.94 signals potential working capital inefficiency
- Low dividend yield of 0.12% may deter income investors
- Neutral profitability margins like 6.22% net margin limit earnings power
Huntington Ingalls Industries Weaknesses
- Unfavorable net margin at 4.85% indicates pressure on profitability
- Higher debt-to-equity at 0.62 compared to Textron may raise leverage concerns
- Limited geographic diversification with no reported international revenue
Despite both companies showing slightly favorable overall financial ratios, Textron’s broader diversification and liquidity contrast with Huntington Ingalls’ more concentrated but capital-efficient profile. These differences shape distinct strategic considerations around growth, risk, and capital allocation.
The Moat Duel: Analyzing Competitive Defensibility
A structural moat is the only defense preserving long-term profits from relentless competitive pressures and market erosion:
Textron Inc. (TXT): Diversified Industrial Moat
Textron’s advantage lies in its broad portfolio, blending intangible assets and cost advantages. It sustains stable margins with a 2% ROIC premium over WACC. Expansion in unmanned systems may deepen this moat in 2026.
Huntington Ingalls Industries, Inc. (HII): Defense Shipbuilding Exclusivity
Huntington Ingalls secures its moat through specialized naval shipbuilding and long-term government contracts. Its ROIC surpasses WACC by over 4%, reflecting efficient capital use. Growth in nuclear support services could widen its moat further.
Moat Strength Battle: Diversification vs. Specialized Government Contracts
HII’s deeper moat benefits from high barriers in defense shipbuilding, outpacing Textron’s diversified but more competitive industrial footprint. Huntington Ingalls is better positioned to defend market share amid rising defense budgets and technological complexity.
Which stock offers better returns?
The past year reveals marked price movements for both stocks, with Textron showing steady acceleration and Huntington Ingalls surging sharply, reflecting distinct trading dynamics and investor interest.
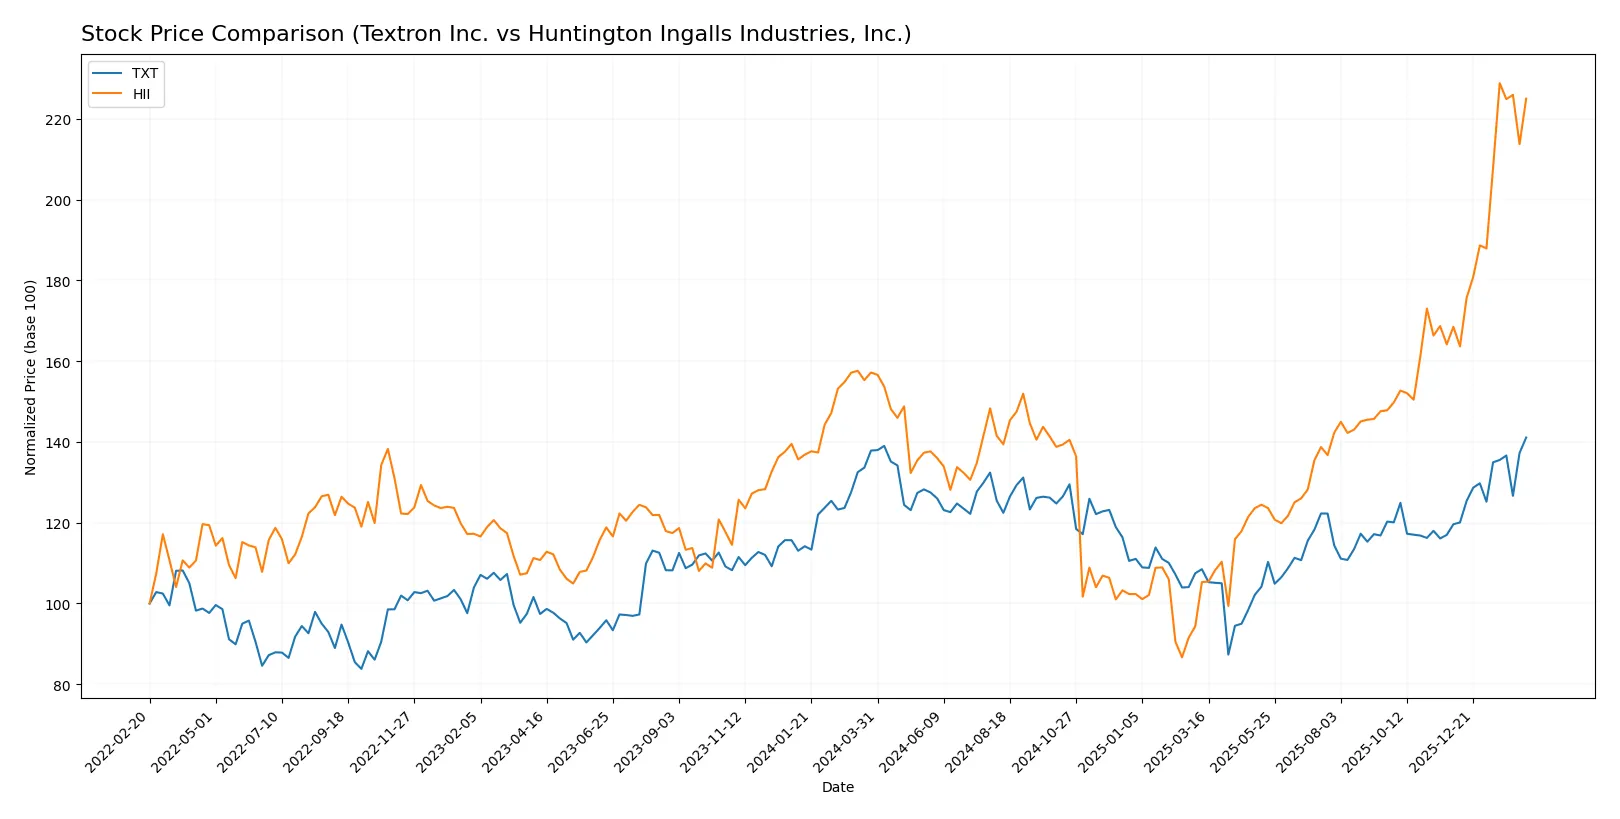
Trend Comparison
Textron Inc. posted a 2.34% price increase over 12 months, signaling a bullish trend with accelerating momentum and moderate volatility, peaking at $98.09 and bottoming at $60.72.
Huntington Ingalls Industries surged 43.15% over the same period, displaying a strong bullish trend with high volatility and acceleration, reaching a high of $425.9 and a low near $161.27.
Huntington Ingalls outperformed Textron significantly, delivering the highest market gains and sharper upward price momentum over the analyzed year.
Target Prices
Analysts present a clear target consensus for Textron Inc. and Huntington Ingalls Industries, reflecting moderate upside potential.
| Company | Target Low | Target High | Consensus |
|---|---|---|---|
| Textron Inc. | 92 | 110 | 101 |
| Huntington Ingalls Industries, Inc. | 264 | 421 | 368 |
Textron’s target consensus of 101 suggests a slight upside from its current 98.09 price. Huntington Ingalls shows strong upside potential, with a 368 consensus versus its current 418.78 price, indicating the stock trades near the high end of analyst expectations.

Don’t Let Luck Decide Your Entry Point
Optimize your entry points with our advanced ProRealTime indicators. You’ll get efficient buy signals with precise price targets for maximum performance. Start outperforming now!
How do institutions grade them?
This section summarizes recent institutional grades for Textron Inc. and Huntington Ingalls Industries, Inc.:
Textron Inc. Grades
The table below shows Textron’s latest grades from major financial institutions.
| Grading Company | Action | New Grade | Date |
|---|---|---|---|
| Jefferies | Maintain | Buy | 2026-02-02 |
| Citigroup | Maintain | Neutral | 2026-01-29 |
| JP Morgan | Maintain | Neutral | 2026-01-29 |
| UBS | Maintain | Neutral | 2026-01-15 |
| Citigroup | Maintain | Neutral | 2026-01-13 |
| JP Morgan | Maintain | Neutral | 2025-10-27 |
| UBS | Maintain | Neutral | 2025-10-24 |
| TD Cowen | Maintain | Hold | 2025-10-24 |
| Barclays | Maintain | Overweight | 2025-07-29 |
| UBS | Upgrade | Neutral | 2025-07-28 |
Huntington Ingalls Industries, Inc. Grades
Below are Huntington Ingalls’ recent grades from recognized grading companies.
| Grading Company | Action | New Grade | Date |
|---|---|---|---|
| B of A Securities | Upgrade | Neutral | 2026-02-12 |
| Citigroup | Maintain | Buy | 2026-02-10 |
| Goldman Sachs | Maintain | Buy | 2026-01-20 |
| Citigroup | Maintain | Buy | 2026-01-13 |
| JP Morgan | Maintain | Neutral | 2025-11-03 |
| TD Cowen | Maintain | Buy | 2025-10-31 |
| Goldman Sachs | Maintain | Buy | 2025-10-31 |
| B of A Securities | Maintain | Underperform | 2025-08-13 |
| Barclays | Maintain | Equal Weight | 2025-08-04 |
| TD Cowen | Upgrade | Buy | 2025-07-10 |
Which company has the best grades?
Huntington Ingalls Industries, Inc. consistently earns “Buy” ratings from Citigroup, Goldman Sachs, and TD Cowen. Textron Inc. mostly receives “Neutral” or “Hold” grades, with a single “Buy” from Jefferies. Investors may view Huntington Ingalls as having stronger institutional confidence, possibly influencing portfolio positioning.
Risks specific to each company
The following categories identify the critical pressure points and systemic threats facing both firms in the 2026 market environment:
1. Market & Competition
Textron Inc.
- Diversified aerospace and defense segments face intense competition and cyclical demand.
Huntington Ingalls Industries, Inc.
- Niche focus on military shipbuilding limits direct competitors but depends heavily on U.S. defense budgets.
2. Capital Structure & Debt
Textron Inc.
- Moderate leverage with debt-to-equity at 0.45, interest coverage strong at 12.84x.
Huntington Ingalls Industries, Inc.
- Slightly higher leverage at 0.62 debt-to-equity; interest coverage lower but still healthy at 8.4x.
3. Stock Volatility
Textron Inc.
- Beta near 1 (0.978) implies market-level volatility sensitivity.
Huntington Ingalls Industries, Inc.
- Low beta (0.329) indicates defensive stock behavior with less volatility.
4. Regulatory & Legal
Textron Inc.
- Exposure to aerospace and defense regulations globally; compliance risks in multiple jurisdictions.
Huntington Ingalls Industries, Inc.
- Heavily regulated U.S. defense shipbuilding with stringent government oversight and contract risks.
5. Supply Chain & Operations
Textron Inc.
- Complex global supply chain across aerospace, defense, industrial equipment; vulnerable to raw material cost swings.
Huntington Ingalls Industries, Inc.
- Concentrated U.S.-based shipbuilding operations; supply chain disruptions can delay costly naval contracts.
6. ESG & Climate Transition
Textron Inc.
- Faces pressure to reduce emissions in manufacturing and aviation segments; emerging green tech investments.
Huntington Ingalls Industries, Inc.
- Nuclear and military ship operations pose significant environmental and social governance challenges.
7. Geopolitical Exposure
Textron Inc.
- International sales expose it to geopolitical tensions and export restrictions.
Huntington Ingalls Industries, Inc.
- Primarily U.S.-focused with less direct geopolitical risk but dependent on federal defense priorities.
Which company shows a better risk-adjusted profile?
Textron’s wider diversification and strong interest coverage mitigate risks but its high current ratio signals potential liquidity inefficiency. Huntington Ingalls benefits from a safer Altman Z-score and low volatility but faces concentrated operational risks tied to U.S. defense budgets. Overall, Huntington Ingalls shows a better risk-adjusted profile, supported by its safer financial distress score and lower stock volatility, despite its narrower market focus.
Final Verdict: Which stock to choose?
Textron Inc. (TXT) stands out with its superpower in delivering consistent value creation through a growing ROIC well above its WACC. This efficiency signals robust capital allocation and operational excellence. However, its unusually high current ratio suggests capital is not optimally deployed—a point of vigilance. TXT suits portfolios aiming for aggressive growth with disciplined financial management.
Huntington Ingalls Industries, Inc. (HII) boasts a strategic moat anchored in strong free cash flow generation and a sustainable competitive advantage reflected in an improving ROIC trend. Its safety profile appears more balanced than TXT’s, with a more moderate liquidity position and a solid Altman Z-score in the safe zone. HII is better aligned with GARP investors seeking growth with reasonable price discipline.
If you prioritize disciplined capital efficiency and aggressive expansion, Textron appears the compelling choice due to its superior value creation and operational momentum. However, if you seek a blend of growth and stability, Huntington Ingalls offers better stability with a stronger financial safety cushion and a solid strategic moat, despite commanding a premium valuation.
Disclaimer: Investment carries a risk of loss of initial capital. The past performance is not a reliable indicator of future results. Be sure to understand risks before making an investment decision.
Go Further
I encourage you to read the complete analyses of Textron Inc. and Huntington Ingalls Industries, Inc. to enhance your investment decisions: