Home > Comparison > Industrials > RTX vs HII
The strategic rivalry between RTX Corporation and Huntington Ingalls Industries defines the aerospace and defense sector’s competitive landscape. RTX operates as a diversified industrial powerhouse across aerospace systems, engines, and defense solutions. Huntington Ingalls focuses on specialized naval shipbuilding and sustainment, serving critical military maritime needs. This analysis contrasts their operational models and growth trajectories to identify which offers superior risk-adjusted potential for a diversified portfolio.
Table of contents
Companies Overview
RTX Corporation and Huntington Ingalls Industries, Inc. stand as pivotal players in the U.S. aerospace and defense sectors, shaping critical defense and commercial capabilities.
RTX Corporation: Aerospace & Defense Powerhouse
RTX Corporation dominates aerospace and defense by delivering integrated systems and services to commercial, military, and government clients worldwide. Its core revenue streams stem from three segments: Collins Aerospace, Pratt & Whitney, and Raytheon, spanning aircraft systems, engines, and defense technologies. In 2026, RTX focuses strategically on expanding advanced aerospace solutions and enhancing defense threat detection capabilities.
Huntington Ingalls Industries, Inc.: Naval Shipbuilding Specialist
Huntington Ingalls Industries leads in designing and building military naval vessels including aircraft carriers, submarines, and amphibious assault ships for the U.S. Navy and Coast Guard. Its revenue hinges on shipbuilding, nuclear support, and life-cycle sustainment services. In 2026, HII prioritizes expanding naval ship construction and nuclear fleet support amid rising defense modernization demands.
Strategic Collision: Similarities & Divergences
Both firms operate within the defense industrial base but diverge sharply in business models: RTX pursues a diversified aerospace portfolio, while HII specializes narrowly in naval shipbuilding. Their principal battleground lies in securing U.S. government contracts for defense modernization. RTX offers a broad investment profile with exposure to commercial aviation; HII appeals to investors focused on specialized naval assets and nuclear services.
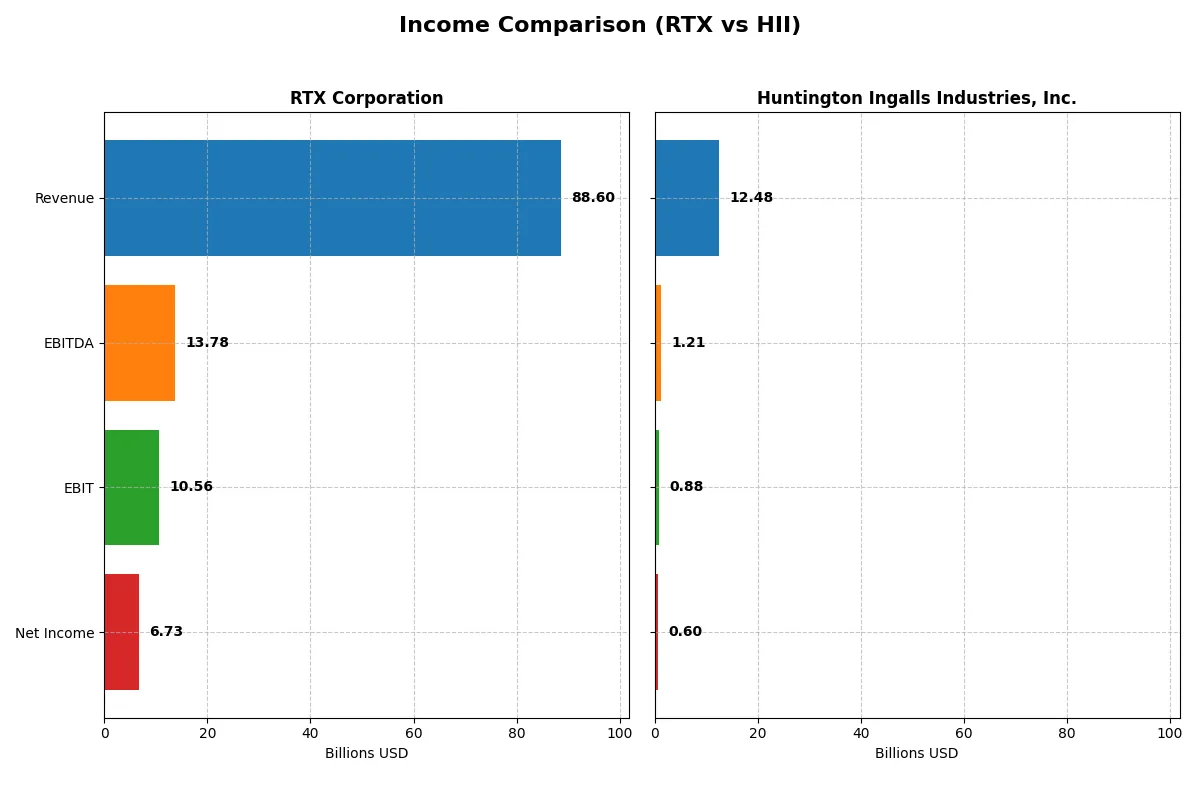
Income Statement Comparison
This data dissects the core profitability and scalability of both corporate engines to reveal who dominates the bottom line:
| Metric | RTX Corporation (RTX) | Huntington Ingalls Industries, Inc. (HII) |
|---|---|---|
| Revenue | 88.6B | 12.5B |
| Cost of Revenue | 70.8B | 10.9B |
| Operating Expenses | 8.9B | 977M |
| Gross Profit | 17.8B | 1.6B |
| EBITDA | 13.8B | 1.2B |
| EBIT | 10.6B | 882M |
| Interest Expense | 1.8B | 105M |
| Net Income | 6.7B | 605M |
| EPS | 5.03 | 15.39 |
| Fiscal Year | 2025 | 2025 |
Income Statement Analysis: The Bottom-Line Duel
This income statement comparison reveals which company operates with superior revenue efficiency and profitability momentum.
RTX Corporation Analysis
RTX’s revenue rose from 64.4B in 2021 to 88.6B in 2025, demonstrating robust growth. Net income more than doubled to 6.7B, reflecting strong margin expansion. Gross margin improved to 20.1%, while net margin climbed to 7.6%, signaling enhanced cost control and operational efficiency in 2025.
Huntington Ingalls Industries, Inc. Analysis
HII grew revenue from 9.5B in 2021 to 12.5B in 2025, marking steady progress. Net income increased to 605M, but margins remain modest with a 12.7% gross margin and 4.9% net margin in 2025. Despite positive revenue growth, margin expansion shows limited momentum compared to RTX.
Margin Power vs. Revenue Scale
RTX outperforms HII with superior margin profiles and faster net income growth, nearly doubling profitability over five years. HII shows steady top-line gains but lags in converting revenue into profits. Investors seeking growth and margin strength find RTX’s profile more compelling.
Financial Ratios Comparison
These vital ratios act as a diagnostic tool to expose the underlying fiscal health, valuation premiums, and capital efficiency of the companies analyzed:
| Ratios | RTX Corporation (RTX) | Huntington Ingalls Industries, Inc. (HII) |
|---|---|---|
| ROE | 10.3% | 11.9% |
| ROIC | 6.2% | 9.0% |
| P/E | 36.6 | 22.1 |
| P/B | 3.78 | 2.63 |
| Current Ratio | 1.03 | 1.13 |
| Quick Ratio | 0.80 | 1.06 |
| D/E | 0.63 | 0.62 |
| Debt-to-Assets | 24.0% | 24.7% |
| Interest Coverage | 4.86 | 5.79 |
| Asset Turnover | 0.52 | 0.98 |
| Fixed Asset Turnover | 4.72 | 3.35 |
| Payout Ratio | 53.1% | 35.2% |
| Dividend Yield | 1.45% | 1.59% |
| Fiscal Year | 2025 | 2025 |
Efficiency & Valuation Duel: The Vital Signs
Financial ratios form a company’s DNA, unveiling hidden risks and operational strengths critical for informed investment decisions.
RTX Corporation
RTX posts a moderate 10.3% ROE and 7.6% net margin, indicating steady profitability but not exceptional. Its P/E of 36.6 signals a stretched valuation compared to industry norms. The company balances shareholder returns with a 1.45% dividend yield while maintaining a slightly favorable capital cost environment, suggesting prudent financial management.
Huntington Ingalls Industries, Inc.
HII delivers a stronger 11.9% ROE and a leaner 4.85% net margin, reflecting efficient asset use amid tighter profitability. Its P/E at 22.1 appears reasonable, avoiding valuation excess. Shareholders benefit from a 1.59% dividend, supported by solid interest coverage and a favorable quick ratio, portraying a financially stable and shareholder-friendly profile.
Balanced Profitability Meets Valuation Discipline
RTX shows steady profitability but suffers from a stretched valuation, while HII offers a more balanced valuation with decent returns. For investors prioritizing reasonable risk-reward, HII’s profile fits better. RTX’s premium reflects growth expectations but also warrants caution on valuation grounds.
Which one offers the Superior Shareholder Reward?
I observe that RTX offers a higher dividend yield around 1.45% in 2025 with a payout ratio near 53%, showing solid free cash flow coverage at 75%. Its buyback program is steady, enhancing shareholder returns. HII yields slightly higher dividends at 1.6% with a lower payout ratio of 35%, preserving more cash for growth or acquisitions. However, HII’s free cash flow coverage is weaker and buybacks are less aggressive. Historically, RTX’s balanced distribution—combining dividends and buybacks—provides a more sustainable total return in cyclical defense sectors. I conclude RTX delivers the superior shareholder reward in 2026.
Comparative Score Analysis: The Strategic Profile
The radar chart reveals the fundamental DNA and trade-offs of RTX Corporation and Huntington Ingalls Industries, Inc., highlighting their financial strengths and vulnerabilities:
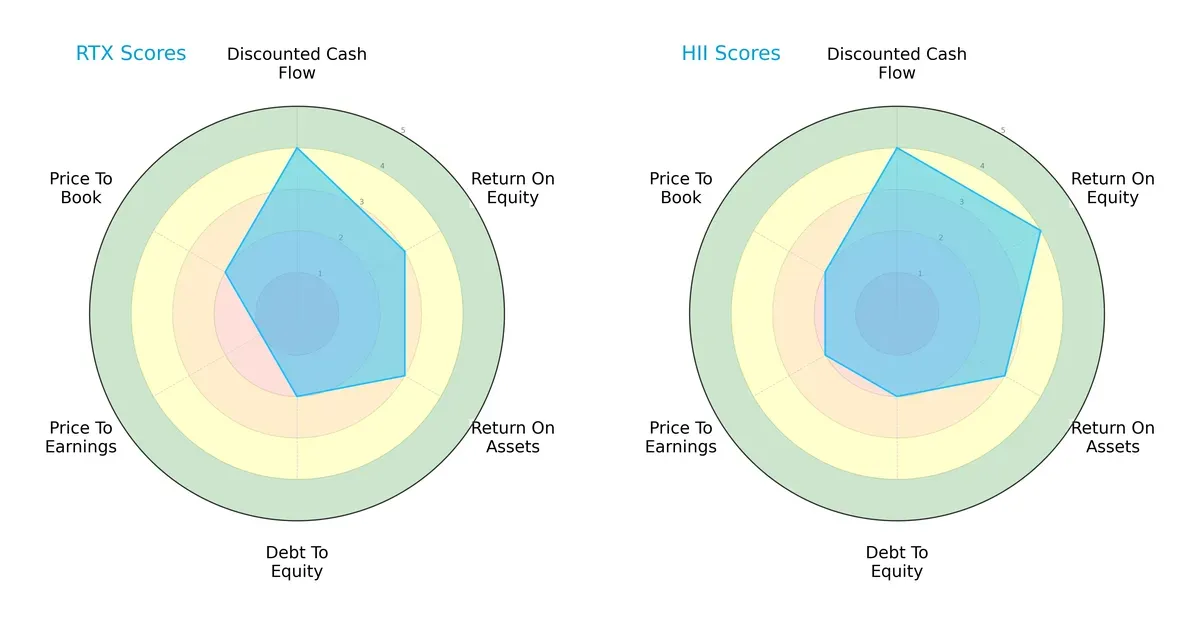
RTX and Huntington Ingalls share similar overall scores, both scoring moderate at 3. Huntington Ingalls edges RTX on return on equity (4 vs. 3), signaling better profit generation from shareholders’ equity. Both match on discounted cash flow (4) and return on assets (3), suggesting comparable asset efficiency and valuation fundamentals. Debt-to-equity is equally unfavorable (2) for both, implying elevated leverage risk. However, Huntington Ingalls shows a slight advantage in price-to-earnings (2 vs. 1) and price-to-book (2 vs. 2), indicating a somewhat more reasonable valuation. Overall, Huntington Ingalls has a more balanced profile, whereas RTX relies heavily on a strong DCF score but suffers from valuation concerns.
—
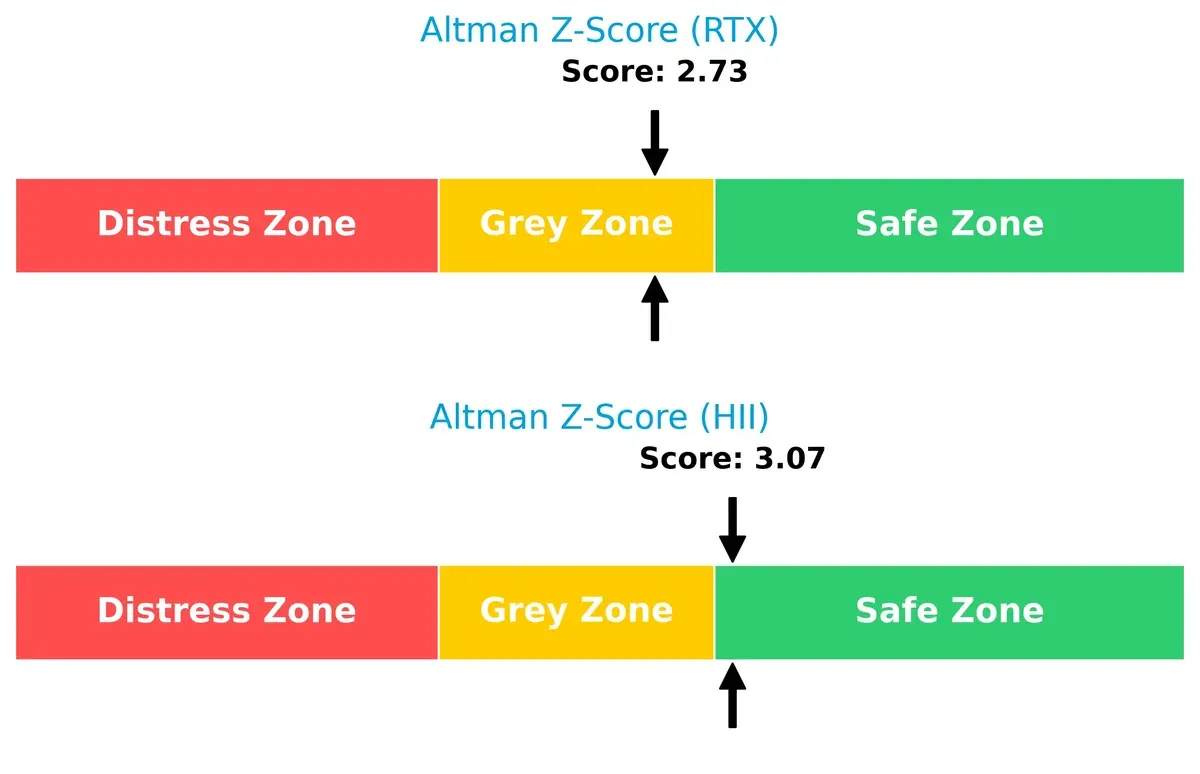
Bankruptcy Risk: Solvency Showdown
The Altman Z-Scores position Huntington Ingalls safely above 3, indicating solid financial stability. RTX, at 2.73, resides in the grey zone, implying moderate bankruptcy risk amid economic cycles:
—
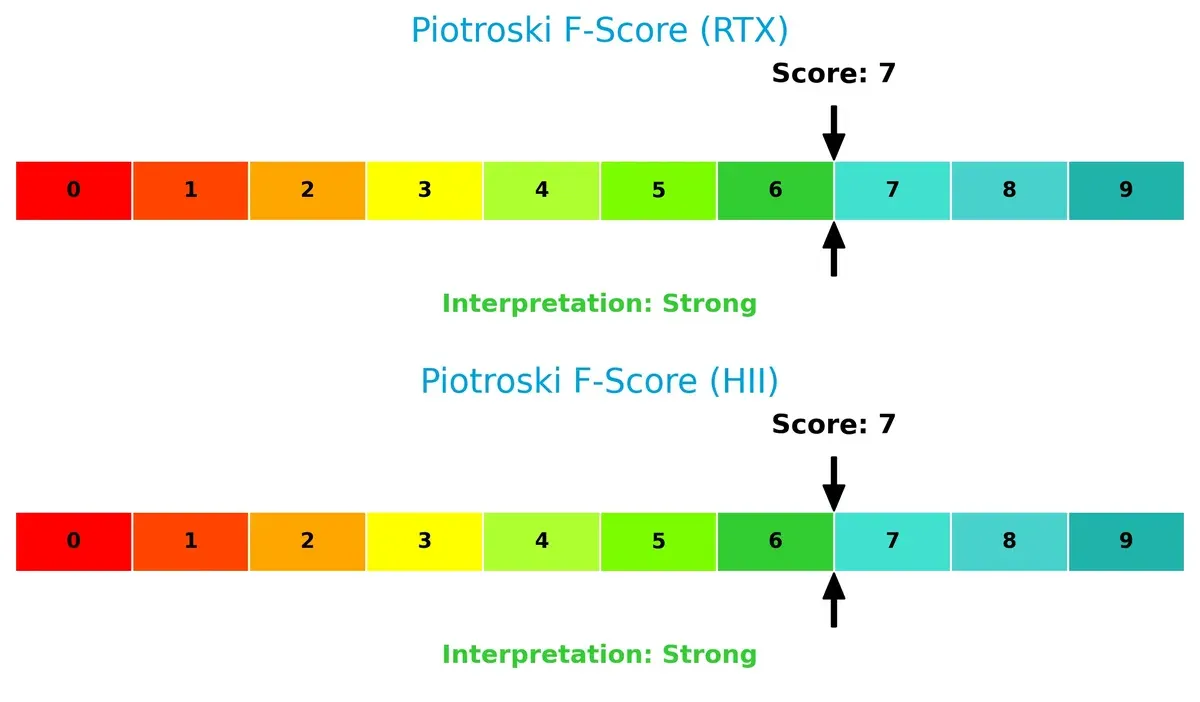
Financial Health: Quality of Operations
Both companies score a strong 7 on the Piotroski F-Score, reflecting robust internal financial health and operational quality. Neither shows red flags in profitability, leverage, or liquidity metrics:
How are the two companies positioned?
This section dissects the operational DNA of RTX and HII by comparing their revenue distribution and internal dynamics. The goal is to confront their economic moats to determine which model offers the most sustainable competitive advantage today.
Revenue Segmentation: The Strategic Mix
The following visual comparison dissects how both firms diversify their income streams and where their primary sector bets lie:
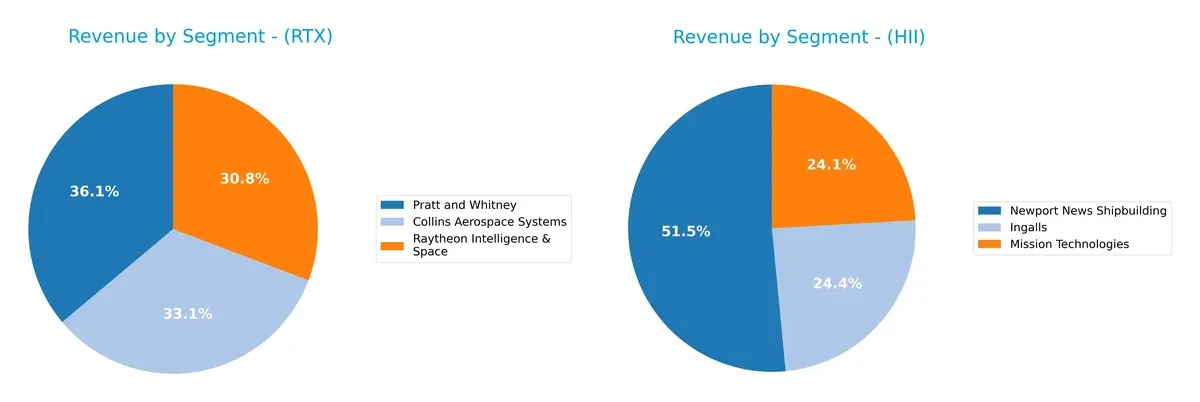
RTX Corporation anchors its revenue across three massive segments: Pratt and Whitney at $33B, Collins Aerospace Systems at $30B, and Raytheon Intelligence & Space at $28B. This balanced triad contrasts sharply with Huntington Ingalls Industries, which relies heavily on Newport News Shipbuilding at $6.5B. HII’s narrower mix signals concentration risk, while RTX’s diversified base underpins ecosystem lock-in and infrastructure dominance in aerospace and defense.
Strengths and Weaknesses Comparison
This table compares the Strengths and Weaknesses of RTX Corporation and Huntington Ingalls Industries, Inc.:
RTX Strengths
- Diversified revenue streams across aerospace and defense segments
- Favorable WACC and debt-to-assets ratio support financial stability
- Strong fixed asset turnover indicates efficient capital use
HII Strengths
- Favorable quick ratio and interest coverage reflect strong liquidity and debt management
- Higher ROIC than WACC suggests effective capital allocation
- Slightly lower valuation multiples imply more attractive pricing
RTX Weaknesses
- Unfavorable PE and PB ratios indicate potential overvaluation
- Quick ratio below 1 signals liquidity risk
- Neutral net margin and ROIC limit profitability appeal
HII Weaknesses
- Lower net margin points to weaker profitability
- Neutral PE and PB suggest average market valuation
- Less diversified revenue base focused on shipbuilding sectors
RTX shows a balanced financial profile with diversified operations but faces valuation and liquidity challenges. HII boasts strong liquidity and capital efficiency yet grapples with profitability and limited diversification. Both companies’ financials reflect nuanced strategic positions within their industries.
The Moat Duel: Analyzing Competitive Defensibility
A structural moat is the only defense that protects long-term profits from relentless competitive pressure and market shifts:
RTX Corporation: Diversified Aerospace Powerhouse with Intangible Asset Moat
RTX leverages strong intangible assets across aerospace and defense, showing stable margins and growing ROIC. New tech in Pratt & Whitney engines may deepen this moat in 2026.
Huntington Ingalls Industries, Inc.: Specialized Shipbuilding with Cost Advantage
HII’s moat centers on unique shipbuilding expertise and government contracts, delivering superior ROIC well above WACC. Expansion in nuclear support services could strengthen its competitive edge.
Economic Moat Faceoff: Intangible Assets vs. Cost Leadership
HII exhibits a wider moat, generating returns vastly exceeding its cost of capital with a strong upward ROIC trend. RTX is improving but still shedding value, making HII better positioned to defend market share.
Which stock offers better returns?
The past year shows marked price rises for both stocks, with RTX exhibiting strong gains and a clear acceleration, while HII also advances but with higher volatility and volume growth.
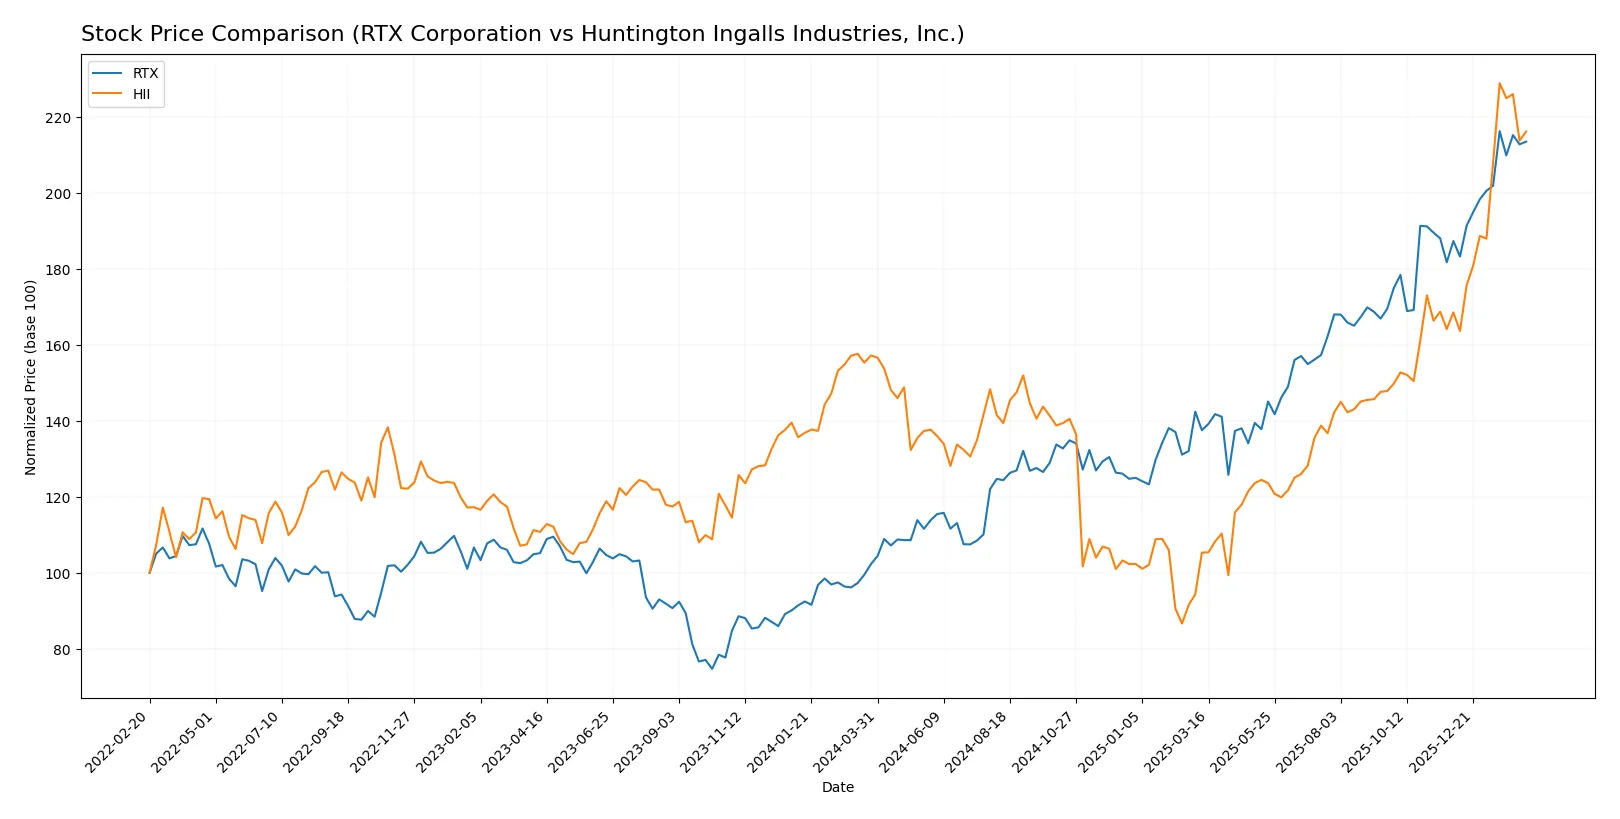
Trend Comparison
RTX’s stock surged 108.64% over 12 months, signaling a bullish trend with accelerating momentum. Its price ranged between 95.54 and 201.92, reflecting moderate volatility (std dev 28.07).
HII gained 37.5% over the same period, also bullish with acceleration, but saw much higher volatility (std dev 56.04). Price fluctuated from 161.27 to 425.9, showing wider swings.
RTX outperformed HII in total return, delivering the highest market gains despite lower volatility and a decreasing volume trend compared to HII’s increasing volume.
Target Prices
Analysts expect solid upside potential for aerospace and defense leaders RTX Corporation and Huntington Ingalls Industries, Inc.
| Company | Target Low | Target High | Consensus |
|---|---|---|---|
| RTX Corporation | 168 | 235 | 214.7 |
| Huntington Ingalls Industries, Inc. | 264 | 419 | 365 |
The consensus target for RTX at $214.7 implies a 7.7% upside from the current $199.37 price. Huntington Ingalls’ $365 target suggests a modest 10% premium over today’s $405.65, reflecting bullish sentiment tempered by recent strength.

Don’t Let Luck Decide Your Entry Point
Optimize your entry points with our advanced ProRealTime indicators. You’ll get efficient buy signals with precise price targets for maximum performance. Start outperforming now!
How do institutions grade them?
RTX Corporation Grades
The following table presents recent institutional grades for RTX Corporation:
| Grading Company | Action | New Grade | Date |
|---|---|---|---|
| Citigroup | Maintain | Buy | 2026-02-05 |
| UBS | Maintain | Neutral | 2026-01-28 |
| JP Morgan | Maintain | Overweight | 2026-01-28 |
| RBC Capital | Maintain | Outperform | 2026-01-28 |
| Citigroup | Maintain | Buy | 2026-01-13 |
| UBS | Downgrade | Neutral | 2026-01-05 |
| JP Morgan | Maintain | Overweight | 2025-12-19 |
| B of A Securities | Maintain | Buy | 2025-10-27 |
| UBS | Maintain | Buy | 2025-10-22 |
| Goldman Sachs | Maintain | Neutral | 2025-10-22 |
Huntington Ingalls Industries, Inc. Grades
The following table presents recent institutional grades for Huntington Ingalls Industries, Inc.:
| Grading Company | Action | New Grade | Date |
|---|---|---|---|
| Goldman Sachs | Maintain | Buy | 2026-01-20 |
| Citigroup | Maintain | Buy | 2026-01-13 |
| JP Morgan | Maintain | Neutral | 2025-11-03 |
| TD Cowen | Maintain | Buy | 2025-10-31 |
| Goldman Sachs | Maintain | Buy | 2025-10-31 |
| B of A Securities | Maintain | Underperform | 2025-08-13 |
| Barclays | Maintain | Equal Weight | 2025-08-04 |
| TD Cowen | Upgrade | Buy | 2025-07-10 |
| Barclays | Maintain | Equal Weight | 2025-05-05 |
| Goldman Sachs | Maintain | Buy | 2025-05-02 |
Which company has the best grades?
RTX Corporation holds a stronger consensus, with multiple “Buy,” “Outperform,” and “Overweight” ratings from leading firms. Huntington Ingalls shows a mix including “Buy” and “Neutral,” but also “Underperform” and “Equal Weight” grades. Investors may perceive RTX as having broader institutional confidence.
Risks specific to each company
The following categories identify critical pressure points and systemic threats facing both firms in the 2026 market environment:
1. Market & Competition
RTX Corporation
- Faces intense competition in aerospace & defense with diversified segments, pressuring margins.
Huntington Ingalls Industries, Inc.
- Operates in a niche shipbuilding market with high barriers but limited diversification.
2. Capital Structure & Debt
RTX Corporation
- Moderate debt levels with favorable interest coverage but weaker quick ratio signals liquidity risks.
Huntington Ingalls Industries, Inc.
- Similar debt-to-equity ratio but stronger liquidity and interest coverage, indicating better short-term safety.
3. Stock Volatility
RTX Corporation
- Beta at 0.418 suggests moderate volatility, lower than market average, providing some stability.
Huntington Ingalls Industries, Inc.
- Lower beta of 0.329 implies less sensitivity to market swings, enhancing risk control.
4. Regulatory & Legal
RTX Corporation
- Subject to extensive aerospace and defense regulations, including export controls and government contracts compliance.
Huntington Ingalls Industries, Inc.
- Faces stringent naval defense regulations and environmental compliance, with nuclear operations adding complexity.
5. Supply Chain & Operations
RTX Corporation
- Complex global supply chains vulnerable to geopolitical tensions and raw material price volatility.
Huntington Ingalls Industries, Inc.
- Operations heavily dependent on U.S. naval contracts, but less exposed to global supply disruptions.
6. ESG & Climate Transition
RTX Corporation
- Increasing pressure to reduce environmental impact in aerospace manufacturing and improve sustainability reporting.
Huntington Ingalls Industries, Inc.
- Nuclear operations create unique ESG challenges, but company invests in environmental management services.
7. Geopolitical Exposure
RTX Corporation
- Global footprint exposes it to trade tensions and shifting defense priorities internationally.
Huntington Ingalls Industries, Inc.
- Primarily focused on U.S. government contracts, limiting direct geopolitical risk but reliant on federal budgets.
Which company shows a better risk-adjusted profile?
Huntington Ingalls Industries shows a stronger risk-adjusted profile. Its safer liquidity position, lower stock volatility, and focused U.S.-based operations mitigate systemic risks better than RTX. RTX’s global exposure and weaker quick ratio amplify its operational and financial vulnerabilities. The most impactful risk for RTX is supply chain complexity amid geopolitical stress. For HII, regulatory and ESG risks from nuclear shipbuilding dominate. The recent data reveal HII’s Altman Z-Score in the safe zone (3.07) versus RTX’s grey zone (2.73), underscoring HII’s comparatively superior financial resilience.
Final Verdict: Which stock to choose?
RTX Corporation’s superpower lies in its robust growth engine and improving profitability, fueled by efficient capital allocation and expanding market presence. However, its relatively high valuation multiples and moderate liquidity ratios warrant caution. RTX suits investors targeting aggressive growth with a tolerance for premium pricing and cyclical sensitivity.
Huntington Ingalls Industries commands a durable moat through its specialized shipbuilding expertise and strong recurring defense contracts. It offers more stability and a healthier liquidity profile compared to RTX. HII fits well within a GARP strategy, appealing to those who seek steady growth combined with reasonable valuation and lower volatility.
If you prioritize high-growth potential and can accept valuation premiums, RTX outshines with its accelerating earnings and market momentum. However, if you seek better stability and a sustainable competitive advantage, HII offers superior risk-adjusted returns and a stronger moat. Each stock aligns with distinct investor profiles demanding balanced prudence.
Disclaimer: Investment carries a risk of loss of initial capital. The past performance is not a reliable indicator of future results. Be sure to understand risks before making an investment decision.
Go Further
I encourage you to read the complete analyses of RTX Corporation and Huntington Ingalls Industries, Inc. to enhance your investment decisions: