Home > Comparison > Industrials > NOC vs HII
The strategic rivalry between Northrop Grumman Corporation and Huntington Ingalls Industries defines aerospace and defense sector dynamics. Northrop Grumman operates as a diversified aerospace giant with advanced systems across air, space, and cyber domains. Huntington Ingalls focuses on naval shipbuilding and lifecycle services, emphasizing maritime defense. This analysis pits broad technological integration against specialized shipbuilding expertise to identify which trajectory offers superior risk-adjusted returns for a diversified portfolio.
Table of contents
Companies Overview
Northrop Grumman and Huntington Ingalls Industries dominate critical segments of the U.S. aerospace and defense market.
Northrop Grumman Corporation: Aerospace & Defense Powerhouse
Northrop Grumman leads as a global aerospace and defense giant. Its core revenue stems from designing and manufacturing advanced aircraft, missile systems, and cyber solutions. In 2026, the company strategically focuses on expanding its mission systems and space systems segments, leveraging innovation in hypersonics and unmanned aircraft. This diversification reinforces its competitive edge in next-gen defense technologies.
Huntington Ingalls Industries, Inc.: Naval Shipbuilding Specialist
Huntington Ingalls commands the U.S. military shipbuilding sector with a strong emphasis on designing and maintaining naval vessels. Its revenue engine relies heavily on building amphibious assault ships, aircraft carriers, and nuclear submarines for the Navy and Coast Guard. The 2026 strategy centers on lifecycle sustainment and nuclear support services, underlining its role as a cornerstone of America’s maritime defense infrastructure.
Strategic Collision: Similarities & Divergences
Both firms serve defense but diverge sharply in focus: Northrop Grumman pursues a diverse aerospace and cyber portfolio, while Huntington Ingalls anchors itself in shipbuilding and naval support. Their primary battleground is the U.S. defense budget allocation across air, space, and sea domains. This contrast yields distinct investment profiles—Northrop thrives on technological breadth; Huntington Ingalls on specialized maritime expertise.
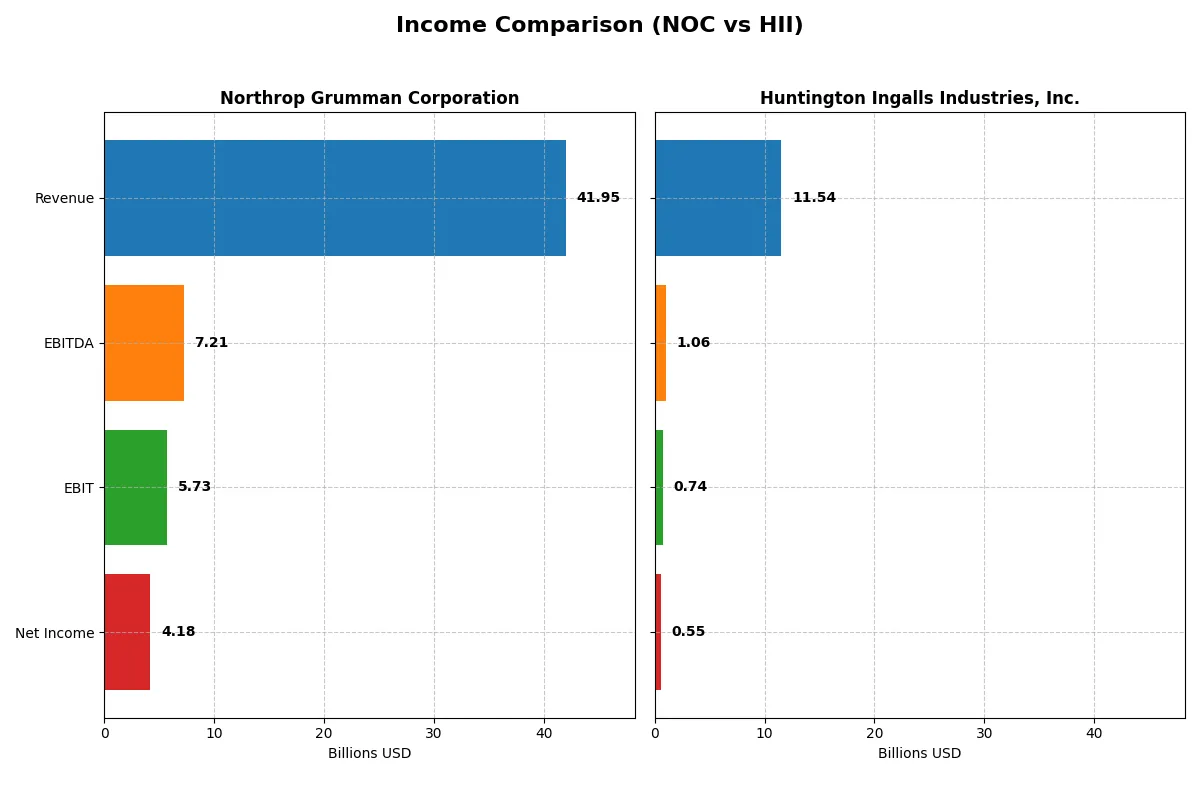
Income Statement Comparison
This data dissects the core profitability and scalability of both corporate engines to reveal who dominates the bottom line:
| Metric | Northrop Grumman Corporation (NOC) | Huntington Ingalls Industries, Inc. (HII) |
|---|---|---|
| Revenue | 41.95B | 11.54B |
| Cost of Revenue | 33.64B | 10.09B |
| Operating Expenses | 4.03B | 915M |
| Gross Profit | 8.31B | 1.45B |
| EBITDA | 7.21B | 1.06B |
| EBIT | 5.73B | 738M |
| Interest Expense | 665M | 95M |
| Net Income | 4.18B | 550M |
| EPS | 29.14 | 13.96 |
| Fiscal Year | 2025 | 2024 |
Income Statement Analysis: The Bottom-Line Duel
This income statement comparison reveals which company drives profitability and operational efficiency more effectively in their sector.
Northrop Grumman Corporation Analysis
Northrop Grumman’s revenue steadily climbed from $35.7B in 2021 to $41.95B in 2025, showing a 17.6% growth over five years. Net income, however, declined sharply by 40.3% over the same period, ending at $4.18B in 2025. Gross margins held near 19.8%, while net margins remained favorable at 9.97%. The firm improved EBIT margin to 13.66%, reflecting solid operational control despite a slight dip in gross profit last year.
Huntington Ingalls Industries, Inc. Analysis
Huntington Ingalls’ revenue grew from $9.36B in 2020 to $11.54B in 2024, a 23.2% rise. Net income fell 21% over this period, reaching $550M in 2024. Gross margin stayed neutral at 12.57%, with net margin at a modest 4.77%. EBIT margin hovered at 6.4%. The latest year showed weaker momentum, with net income and EBIT shrinking, signaling margin pressure amid rising costs.
Margin Strength vs. Revenue Expansion
Northrop Grumman commands superior margins and operational efficiency, despite a recent net income decline. Huntington Ingalls posted stronger revenue growth percentage-wise but struggles with lower profitability and margin contraction. For investors prioritizing margin resilience and scale, Northrop Grumman’s profile offers more robust fundamental strength. Huntington’s profile suits those focusing on top-line growth but with caution on profitability risks.
Financial Ratios Comparison
These vital ratios act as a diagnostic tool to expose the underlying fiscal health, valuation premiums, and capital efficiency of the companies analyzed:
| Ratios | Northrop Grumman Corporation (NOC) | Huntington Ingalls Industries, Inc. (HII) |
|---|---|---|
| ROE | 25.1% | 11.8% |
| ROIC | 9.9% | 4.7% |
| P/E | 19.6 | 13.5 |
| P/B | 4.91 | 1.60 |
| Current Ratio | 1.10 | 1.08 |
| Quick Ratio | 1.10 | 1.01 |
| D/E (Debt-to-Equity) | 0.11 | 0.73 |
| Debt-to-Assets | 3.6% | 28.1% |
| Interest Coverage | -6.8 | 5.6 |
| Asset Turnover | 0.82 | 0.95 |
| Fixed Asset Turnover | 3.27 | 3.13 |
| Payout ratio | 31% | 37% |
| Dividend yield | 1.58% | 2.77% |
| Fiscal Year | 2025 | 2024 |
Efficiency & Valuation Duel: The Vital Signs
Ratios act as a company’s financial DNA, uncovering hidden risks and operational strengths that raw numbers often conceal.
Northrop Grumman Corporation
Northrop Grumman posts a strong ROE of 25.08%, signaling efficient use of equity. Its net margin near 10% supports solid profitability. The P/E ratio of 19.57 suggests a fairly valued stock, though a high price-to-book ratio of 4.91 raises caution. Dividend yield at 1.58% reflects moderate shareholder returns alongside steady reinvestment.
Huntington Ingalls Industries, Inc.
HII’s ROE of 11.79% indicates moderate profitability, with a lower net margin of 4.77%. The stock trades at a more attractive P/E of 13.54, signaling relative valuation strength. A dividend yield of 2.77% offers meaningful income. However, weaker ROIC at 4.74% points to challenges in capital efficiency compared to peers.
Balanced Profitability Meets Value Appeal
Northrop Grumman delivers superior profitability and operational efficiency but at a premium valuation. Huntington Ingalls offers more attractive valuation and dividend income but lags in returns on capital. Investors seeking growth may prefer Northrop’s profile, while value-focused investors might lean toward HII’s conservative risk-reward mix.
Which one offers the Superior Shareholder Reward?
Northrop Grumman (NOC) offers a balanced distribution with a 1.58% dividend yield and a 31% payout ratio, supported by solid free cash flow coverage (1.73x). Its buyback program is robust, enhancing shareholder returns sustainably. Huntington Ingalls (HII) yields a higher 2.77% dividend but with a riskier payout ratio of 37%, and minimal free cash flow backing (0.07x). HII’s buybacks are modest, raising sustainability concerns. I see NOC’s disciplined capital allocation and stronger buyback intensity as delivering a more attractive total return profile for 2026 investors.
Comparative Score Analysis: The Strategic Profile
The radar chart reveals the fundamental DNA and trade-offs of Northrop Grumman Corporation and Huntington Ingalls Industries, Inc.:
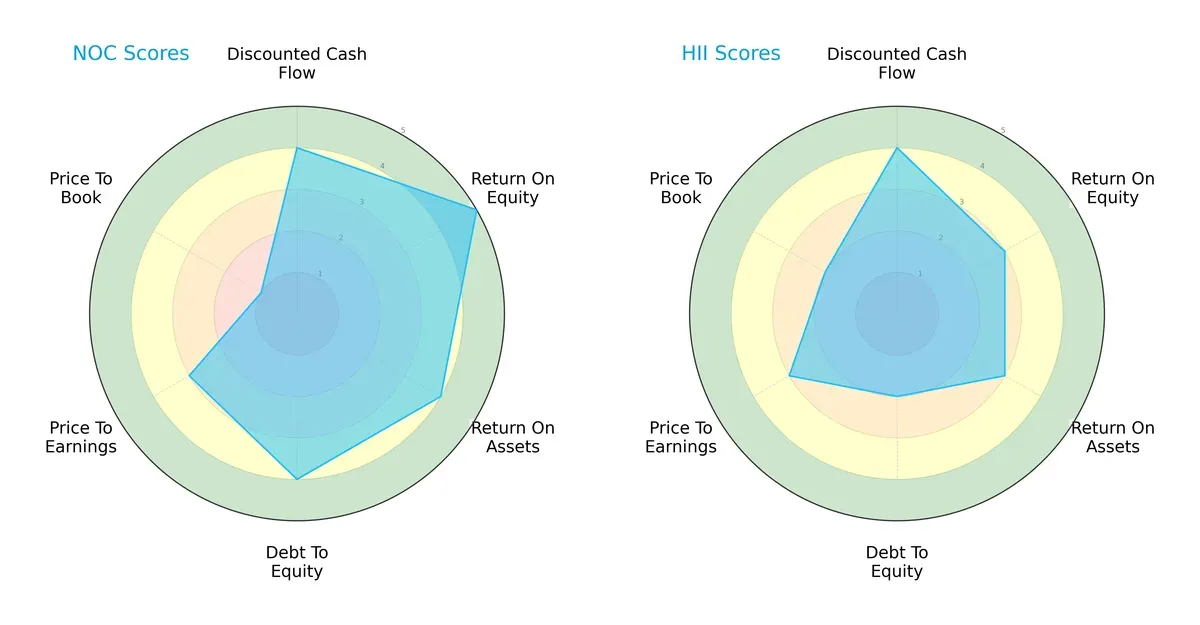
Northrop Grumman demonstrates a more balanced profile with strong ROE (5) and ROA (4) scores, indicating efficient asset use and profitability. Huntington Ingalls scores moderately across most metrics but shows weaker debt management (2). Both share similar DCF and P/E scores, yet Northrop’s very unfavorable P/B score (1) marks a valuation concern. Overall, Northrop leverages operational efficiency, while Huntington Ingalls leans on moderate financial stability.
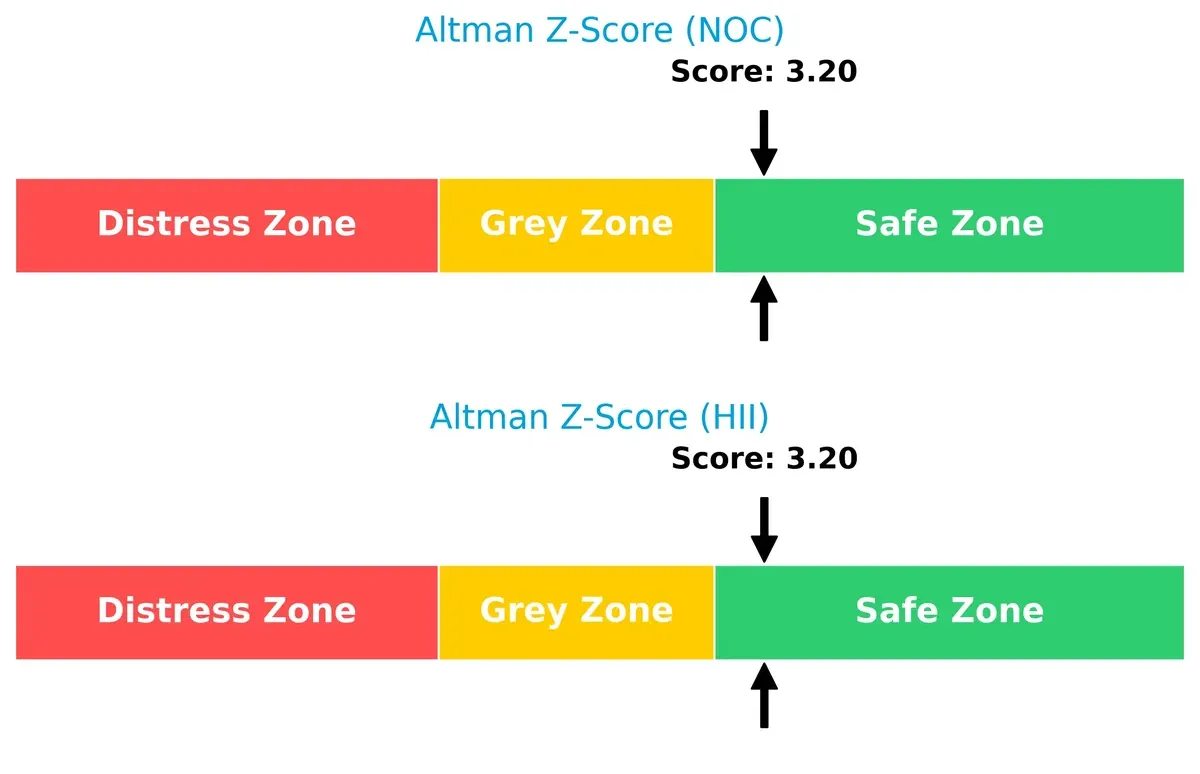
Bankruptcy Risk: Solvency Showdown
Both companies score safely above 3 on the Altman Z-Score, signaling robust long-term survival probabilities in this cycle:
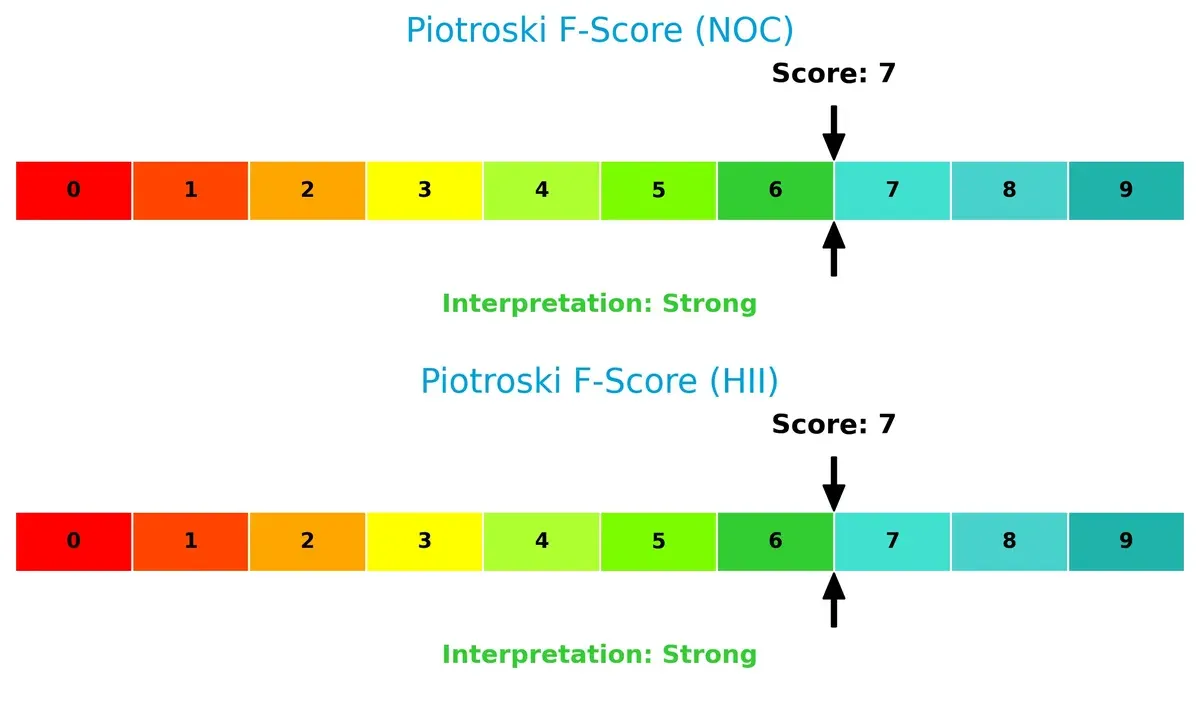
Financial Health: Quality of Operations
Northrop Grumman and Huntington Ingalls both achieve a strong Piotroski F-Score of 7, reflecting solid internal financial health without immediate red flags:
How are the two companies positioned?
This section dissects the operational DNA of Northrop Grumman and Huntington Ingalls by comparing their revenue distribution and internal strengths and weaknesses. The goal is to confront their economic moats to identify which model offers the most resilient and sustainable competitive advantage today.
Revenue Segmentation: The Strategic Mix
This visual comparison dissects how Northrop Grumman Corporation and Huntington Ingalls Industries diversify their income streams and where their primary sector bets lie:
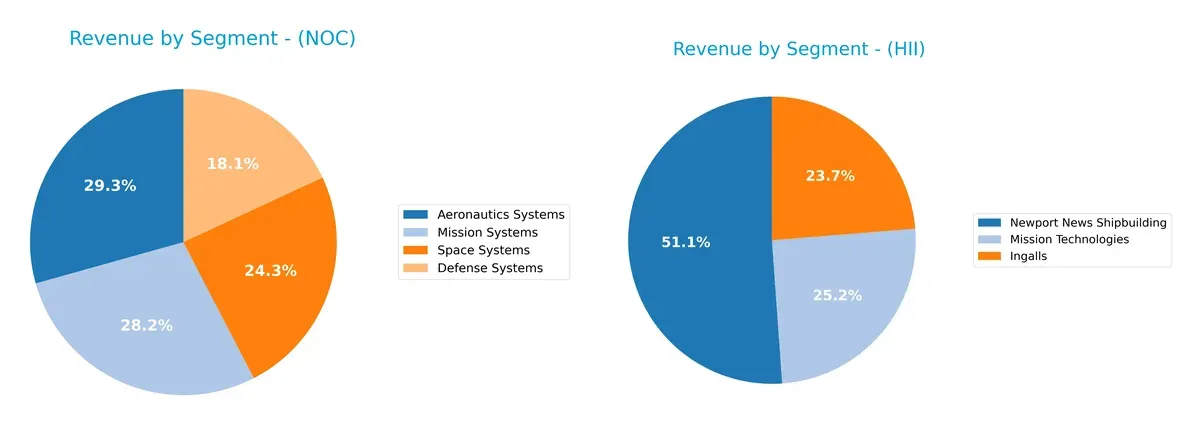
Northrop Grumman spreads revenue across Aeronautics Systems ($13B), Mission Systems ($12.5B), Space Systems ($10.8B), and Defense Systems ($8B). Huntington Ingalls leans heavily on Newport News Shipbuilding ($6B), with smaller contributions from Ingalls ($2.8B) and Mission Technologies ($2.9B). Northrop’s diversified segments reduce concentration risk and strengthen its ecosystem lock-in. Huntington Ingalls pivots on shipbuilding dominance, exposing it to sector-specific volatility but anchoring its infrastructure leadership.
Strengths and Weaknesses Comparison
This table compares the Strengths and Weaknesses of Northrop Grumman Corporation (NOC) and Huntington Ingalls Industries, Inc. (HII):
NOC Strengths
- Diversified revenue across Aeronautics, Defense, Mission, and Space Systems
- Strong profitability with 25.08% ROE, favorable WACC at 4.47%
- Low debt levels with 0.11 debt-to-equity and 3.61% debt-to-assets
- Solid liquidity shown by quick ratio of 1.1
- Global presence including significant US, Europe, Asia Pacific sales
- Favorable fixed asset turnover at 3.27
HII Strengths
- Favorable valuation metrics: P/E of 13.54 and reasonable PB of 1.6
- Favorable WACC of 5.07% and interest coverage of 7.77
- Higher dividend yield at 2.77%
- Favorable quick ratio of 1.01 supports liquidity
- Balanced debt-to-assets at 28.07% with neutral debt-to-equity of 0.73
- Focused market segments in shipbuilding and mission technologies
NOC Weaknesses
- Price-to-book ratio is unfavorable at 4.91, indicating possible overvaluation
- Net margin and ROIC neutral at about 10% and 9.93% respectively
- Moderate current ratio of 1.1 suggests limited buffer for short-term obligations
- Asset turnover is neutral at 0.82, indicating average operational efficiency
HII Weaknesses
- Net margin and ROIC are unfavorable at 4.77% and 4.74% respectively, reflecting weaker profitability
- Debt-to-equity at 0.73 is neutral but higher than NOC’s, indicating more leverage risk
- Lower ROE at 11.79%, neutral but modest compared to sector leaders
- Asset turnover neutral at 0.95, showing average asset use efficiency
Northrop Grumman demonstrates broad diversification and strong capital structure metrics, which support its competitive positioning. Huntington Ingalls maintains favorable valuation and liquidity but faces challenges in profitability and leverage. These factors shape each company’s strategic options going forward.
The Moat Duel: Analyzing Competitive Defensibility
A structural moat is the critical barrier protecting long-term profits from relentless competitive pressures. Let’s dissect how these two aerospace and defense giants defend their turf:
Northrop Grumman Corporation: Intangible Assets & Integrated Systems Moat
Northrop Grumman leverages deep intangible assets and integrated defense systems, reflected in a strong ROIC exceeding WACC by 5.5%. Despite a declining ROIC trend, its advanced aerospace tech and expanding ISR platforms could reinforce this moat in 2026.
Huntington Ingalls Industries, Inc.: Specialized Shipbuilding Moat
Huntington Ingalls relies on specialized naval shipbuilding expertise, a narrower moat compared to Northrop. Its ROIC lags below WACC and declines sharply, signaling value erosion. However, opportunities in nuclear support services might stabilize future profitability.
Intangible Assets vs. Specialized Manufacturing: The Moat Verdict
Northrop Grumman’s intangible asset-driven moat proves wider and more durable than Huntington’s specialized manufacturing moat. Northrop’s diversified tech portfolio better equips it to defend market share against emerging defense disruptors.
Which stock offers better returns?
Over the past 12 months, Northrop Grumman and Huntington Ingalls stocks have shown strong bullish trends, with significant price gains and accelerating momentum.
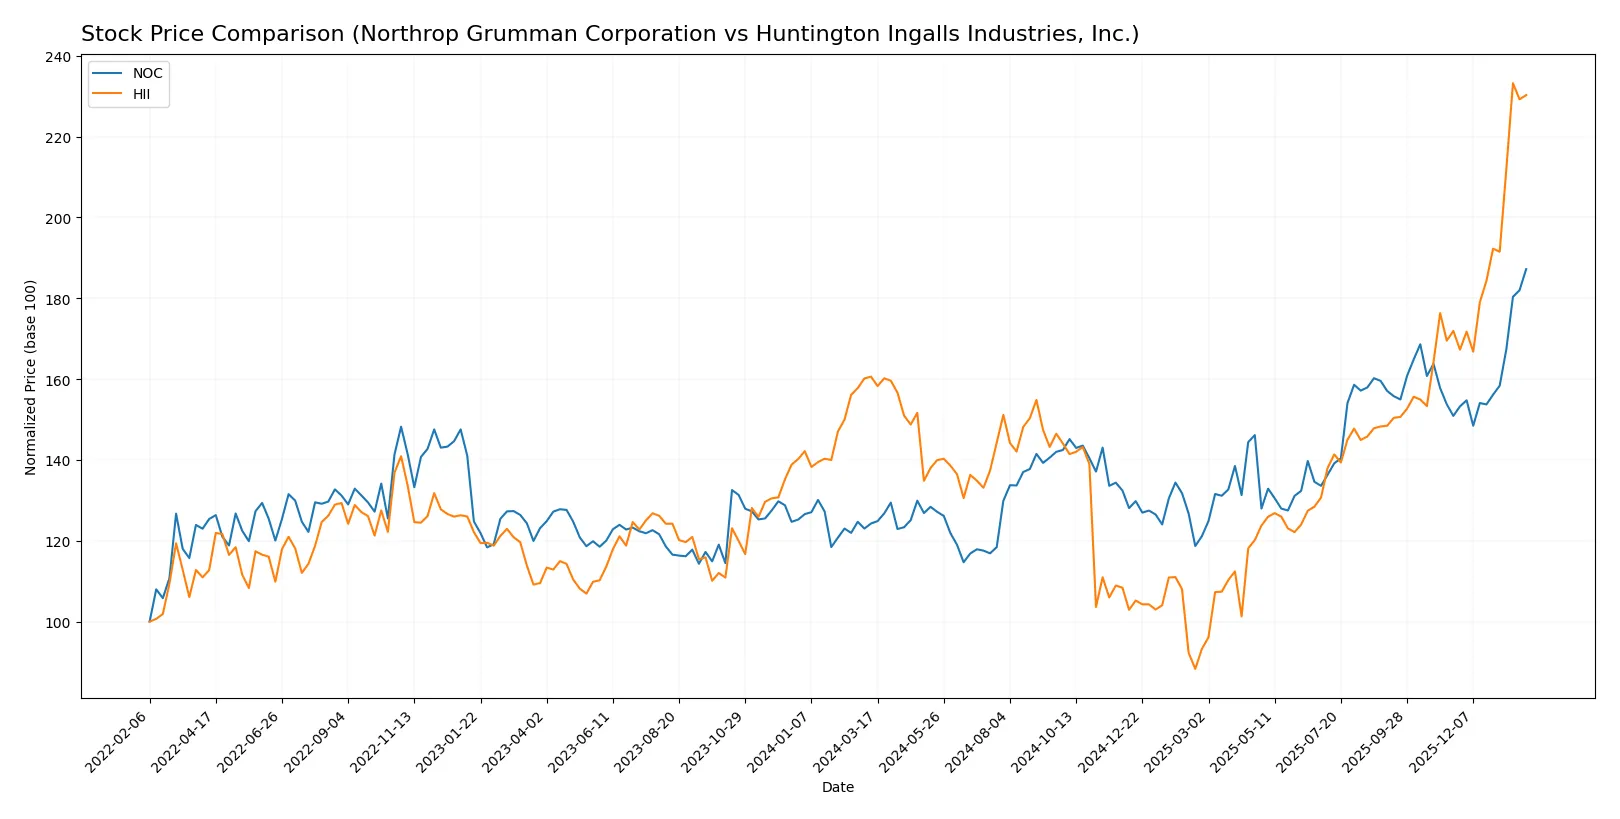
Trend Comparison
Northrop Grumman’s stock price rose 50.66% over the past year, marking a clear bullish trend with accelerating momentum and a high volatility level (std dev 57.5). The stock hit a low of 424.09 and a high of 692.26.
Huntington Ingalls’ stock gained 43.36% across the same period, also bullish with acceleration. Its volatility is slightly lower (std dev 52.5), with a low of 161.27 and a high of 425.9.
Northrop Grumman outperformed Huntington Ingalls in price appreciation, delivering the higher market return over the past 12 months.
Target Prices
Analysts present a bullish consensus on Northrop Grumman Corporation and Huntington Ingalls Industries, with target prices above current market levels.
| Company | Target Low | Target High | Consensus |
|---|---|---|---|
| Northrop Grumman Corporation | 623 | 815 | 732.25 |
| Huntington Ingalls Industries, Inc. | 264 | 425 | 367 |
Northrop Grumman’s consensus target of $732.25 exceeds its current price of $692.26, signaling upside potential. Huntington Ingalls’ target consensus of $367 is below its current price of $420.51, suggesting possible downside or market overvaluation.

Don’t Let Luck Decide Your Entry Point
Optimize your entry points with our advanced ProRealTime indicators. You’ll get efficient buy signals with precise price targets for maximum performance. Start outperforming now!
How do institutions grade them?
Northrop Grumman Corporation Grades
The following table summarizes recent grades from major financial institutions for Northrop Grumman Corporation:
| Grading Company | Action | New Grade | Date |
|---|---|---|---|
| B of A Securities | Maintain | Buy | 2026-01-28 |
| BTIG | Maintain | Buy | 2026-01-28 |
| UBS | Maintain | Buy | 2026-01-28 |
| RBC Capital | Maintain | Outperform | 2026-01-28 |
| Citigroup | Maintain | Buy | 2026-01-28 |
| UBS | Maintain | Buy | 2026-01-15 |
| Citigroup | Maintain | Buy | 2026-01-13 |
| Truist Securities | Downgrade | Hold | 2026-01-09 |
| Morgan Stanley | Maintain | Overweight | 2025-12-16 |
| Alembic Global | Upgrade | Overweight | 2025-12-15 |
Huntington Ingalls Industries, Inc. Grades
This table presents recent grades assigned to Huntington Ingalls Industries, Inc. by leading analysts:
| Grading Company | Action | New Grade | Date |
|---|---|---|---|
| Goldman Sachs | Maintain | Buy | 2026-01-20 |
| Citigroup | Maintain | Buy | 2026-01-13 |
| JP Morgan | Maintain | Neutral | 2025-11-03 |
| Goldman Sachs | Maintain | Buy | 2025-10-31 |
| TD Cowen | Maintain | Buy | 2025-10-31 |
| B of A Securities | Maintain | Underperform | 2025-08-13 |
| Barclays | Maintain | Equal Weight | 2025-08-04 |
| TD Cowen | Upgrade | Buy | 2025-07-10 |
| Barclays | Maintain | Equal Weight | 2025-05-05 |
| Goldman Sachs | Maintain | Buy | 2025-05-02 |
Which company has the best grades?
Northrop Grumman consistently earns Buy and Outperform ratings from top firms, reflecting stronger consensus confidence. Huntington Ingalls shows mixed ratings, including Underperform and Neutral, indicating more cautious sentiment. Investors may interpret Northrop Grumman’s grades as a signal of comparatively higher analyst conviction.
Risks specific to each company
The following categories identify the critical pressure points and systemic threats facing both firms in the 2026 market environment:
1. Market & Competition
Northrop Grumman Corporation
- Dominates aerospace and defense with diverse segments, but faces intense competition from established rivals.
Huntington Ingalls Industries, Inc.
- Focuses on military shipbuilding, a niche with fewer competitors but reliant on U.S. Navy contracts.
2. Capital Structure & Debt
Northrop Grumman Corporation
- Low debt-to-equity ratio (0.11) signals financial strength and prudent capital allocation.
Huntington Ingalls Industries, Inc.
- Higher debt-to-equity (0.73) increases financial risk but manageable given solid interest coverage.
3. Stock Volatility
Northrop Grumman Corporation
- Extremely low beta (0.049) indicates stock stability, appealing in volatile markets.
Huntington Ingalls Industries, Inc.
- Beta (0.354) suggests moderate volatility, exposing investors to higher market risk.
4. Regulatory & Legal
Northrop Grumman Corporation
- Subject to rigorous aerospace and defense regulations; geopolitical tensions could increase compliance costs.
Huntington Ingalls Industries, Inc.
- Naval shipbuilding faces strict government oversight and potential delays from defense contract regulations.
5. Supply Chain & Operations
Northrop Grumman Corporation
- Complex global supply chains vulnerable to disruptions but benefits from diversified product lines.
Huntington Ingalls Industries, Inc.
- Supply chain concentrated on shipbuilding materials; risk of delays and cost overruns is significant.
6. ESG & Climate Transition
Northrop Grumman Corporation
- Increasing pressure to reduce carbon footprint; aerospace propulsion systems face scrutiny.
Huntington Ingalls Industries, Inc.
- Naval shipbuilding’s environmental compliance demands are rising, with costly transition efforts underway.
7. Geopolitical Exposure
Northrop Grumman Corporation
- Global operations expose it to international trade tensions and export controls.
Huntington Ingalls Industries, Inc.
- Primarily focused on U.S. defense contracts, limiting direct geopolitical risks but dependent on government stability.
Which company shows a better risk-adjusted profile?
Northrop Grumman’s most impactful risk lies in complex global supply chains and regulatory compliance, while Huntington Ingalls faces significant financial leverage and operational concentration risks. Northrop Grumman’s low debt, minimal stock volatility, and diversified portfolio give it a superior risk-adjusted profile. The recent low beta and strong interest coverage ratios clearly justify my preference for Northrop Grumman in a cautious investment strategy.
Final Verdict: Which stock to choose?
Northrop Grumman Corporation’s superpower lies in its robust capital efficiency and solid return on equity, signaling strong value creation despite a slight decline in profitability. Its moderate liquidity calls for vigilance, especially in volatile markets. This profile suits an Aggressive Growth portfolio seeking exposure to defense sector strength.
Huntington Ingalls Industries, Inc. offers a strategic moat through its specialized shipbuilding capabilities, supported by steady recurring revenues. It presents a more conservative risk profile relative to Northrop, with stable liquidity and manageable debt levels. This makes it appealing for a GARP (Growth at a Reasonable Price) portfolio focused on stability and niche expertise.
If you prioritize capital efficiency and high returns with a tolerance for cyclical dips, Northrop Grumman outshines due to its value creation and market momentum. However, if you seek better stability and a defined moat in a specialized industrial niche, Huntington Ingalls offers a safer harbor despite its current profitability challenges.
Disclaimer: Investment carries a risk of loss of initial capital. The past performance is not a reliable indicator of future results. Be sure to understand risks before making an investment decision.
Go Further
I encourage you to read the complete analyses of Northrop Grumman Corporation and Huntington Ingalls Industries, Inc. to enhance your investment decisions: