Home > Comparison > Industrials > LMT vs HII
The strategic rivalry between Lockheed Martin Corporation and Huntington Ingalls Industries defines the aerospace and defense sector’s competitive landscape. Lockheed Martin operates as a diversified industrial giant with broad technology integration across air, space, and missile systems. Huntington Ingalls focuses on specialized shipbuilding and naval support services, emphasizing precision and lifecycle sustainment. This analysis contrasts their operational models to identify which trajectory offers superior risk-adjusted returns for a diversified industrial portfolio.
Table of contents
Companies Overview
Lockheed Martin and Huntington Ingalls Industries stand as pivotal players in the U.S. aerospace and defense market.
Lockheed Martin Corporation: Aerospace & Defense Powerhouse
Lockheed Martin dominates as a global leader in defense technology. It generates revenue through four key segments: Aeronautics, Missiles and Fire Control, Rotary and Mission Systems, and Space. In 2026, it strategically emphasizes integrating space and ground-based systems to enhance secure intelligence distribution, solidifying its position as a critical U.S. government contractor.
Huntington Ingalls Industries, Inc.: Naval Shipbuilding Specialist
Huntington Ingalls Industries excels in military ship design and construction, focusing on amphibious assault ships, aircraft carriers, and submarines. Its revenue stems from shipbuilding and lifecycle sustainment services for the U.S. Navy and Coast Guard. The company prioritizes advanced nuclear support services and mission-based IT solutions to reinforce U.S. maritime defense capabilities in 2026.
Strategic Collision: Similarities & Divergences
Both companies specialize in aerospace and defense but diverge sharply in focus: Lockheed Martin pursues a broad technology systems integration approach, while Huntington Ingalls concentrates on naval shipbuilding. The primary battleground lies in securing U.S. government contracts, yet their investment profiles differ—Lockheed offers diversified aerospace exposure, whereas Huntington delivers niche maritime defense expertise.
Income Statement Comparison
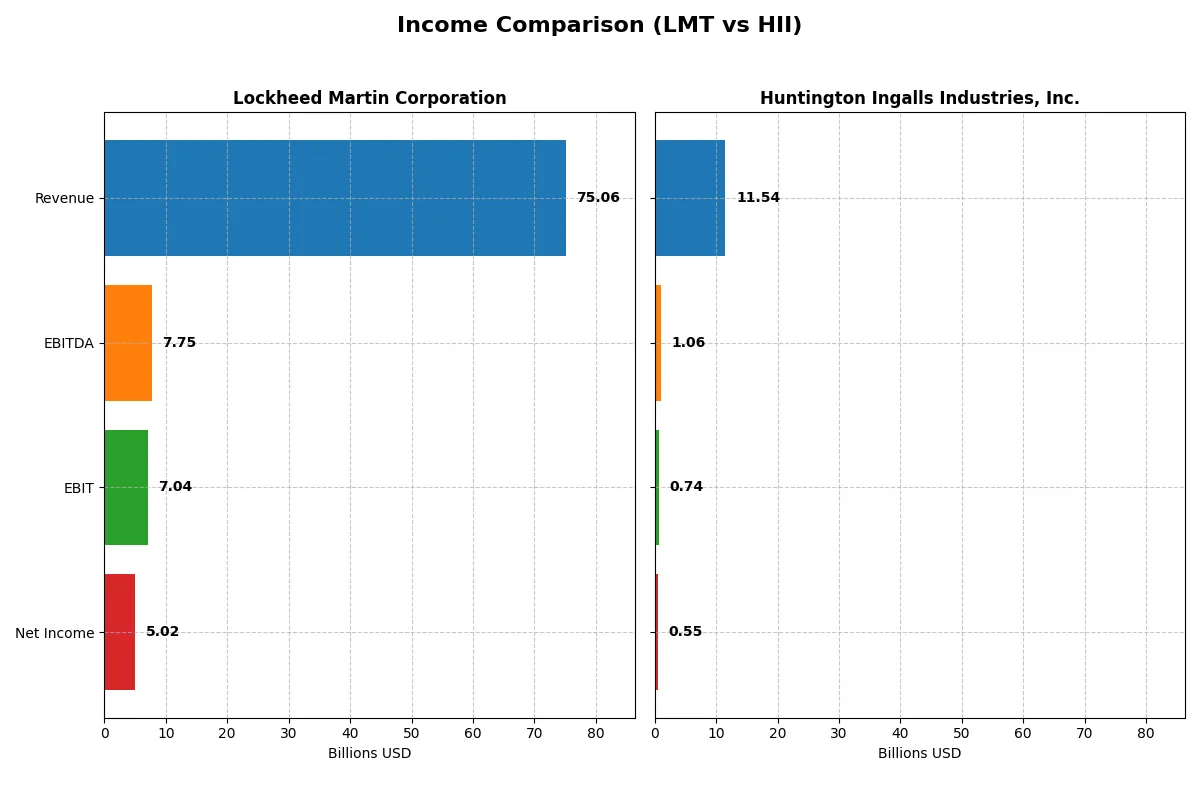
This data dissects the core profitability and scalability of both corporate engines to reveal who dominates the bottom line:
| Metric | Lockheed Martin (LMT) | Huntington Ingalls (HII) |
|---|---|---|
| Revenue | 75.1B | 11.5B |
| Cost of Revenue | 67.4B | 10.1B |
| Operating Expenses | -103M | 915M |
| Gross Profit | 7.6B | 1.45B |
| EBITDA | 7.75B | 1.06B |
| EBIT | 7.04B | 738M |
| Interest Expense | 1.12B | 95M |
| Net Income | 5.02B | 550M |
| EPS | 21.56 | 13.96 |
| Fiscal Year | 2025 | 2024 |
Income Statement Analysis: The Bottom-Line Duel
Comparing these income statements unveils which company runs its operations with greater efficiency and sustainable profitability.
Lockheed Martin Corporation Analysis
Lockheed Martin’s revenue climbs steadily, reaching $75B in 2025, but net income declines to $5B, reflecting margin pressure. Gross margin holds at 10.15%, while net margin remains favorable at 6.68%. Despite a 5.65% revenue rise in 2025, EBIT and net margin shrink, signaling rising costs or operational challenges.
Huntington Ingalls Industries, Inc. Analysis
Huntington Ingalls posts modest revenue growth to $11.5B in 2024, yet net income dips to $550M. Gross margin stands neutral at 12.57%, with a net margin of 4.77%. However, a nearly 12% drop in gross profit and 22% EBIT decline indicate weakening profitability and margin contraction over the latest year.
Margin Resilience vs. Profitability Strain
Lockheed Martin sustains higher absolute profits and better margins despite recent margin erosion, while Huntington Ingalls faces sharper profitability declines relative to its size. Lockheed’s scale and margin profile offer stronger fundamental earnings power. Investors prioritizing robust profit generation may favor Lockheed’s profile over Huntington’s more volatile margin trends.
Financial Ratios Comparison
These vital ratios act as a diagnostic tool to expose the underlying fiscal health, valuation premiums, and capital efficiency of the companies compared below:
| Ratios | Lockheed Martin (LMT) | Huntington Ingalls (HII) |
|---|---|---|
| ROE | 74.65% | 11.79% |
| ROIC | 17.39% | 4.74% |
| P/E | 22.26 | 13.54 |
| P/B | 16.62 | 1.60 |
| Current Ratio | 1.09 | 1.08 |
| Quick Ratio | 0.94 | 1.01 |
| D/E | 0.17 | 0.73 |
| Debt-to-Assets | 1.95% | 28.07% |
| Interest Coverage | 6.92 | 5.63 |
| Asset Turnover | 1.25 | 0.95 |
| Fixed Asset Turnover | 8.46 | 3.13 |
| Payout ratio | 62.41% | 37.45% |
| Dividend yield | 2.80% | 2.77% |
| Fiscal Year | 2025 | 2024 |
Efficiency & Valuation Duel: The Vital Signs
Ratios act as a company’s DNA, exposing hidden risks and operational excellence critical for informed investing decisions.
Lockheed Martin Corporation
Lockheed Martin posts a robust 74.65% ROE and a solid 6.68% net margin, signaling strong profitability. Its P/E of 22.26 is neutral, suggesting fair valuation, though a high PB of 16.62 appears stretched. The firm rewards shareholders with a 2.8% dividend yield, reflecting balanced capital allocation and shareholder returns.
Huntington Ingalls Industries, Inc.
HII shows modest profitability with an 11.79% ROE and 4.77% net margin, indicating operational challenges. Its P/E of 13.54 is attractive, implying undervaluation versus peers. The company yields 2.77% in dividends but displays weaker ROIC at 4.74%, which may signal less efficient capital use relative to cost of capital.
Profitability Strength vs. Valuation Appeal
Lockheed Martin offers superior profitability and capital efficiency but trades at a premium valuation and stretched book value. Huntington Ingalls presents a cheaper entry point with moderate returns but less operational efficiency. Investors seeking growth and operational strength may prefer Lockheed Martin, while value-oriented investors might lean toward Huntington Ingalls.
Which one offers the Superior Shareholder Reward?
I compare Lockheed Martin (LMT) and Huntington Ingalls Industries (HII) on dividend yield, payout ratios, and buyback intensity. LMT yields 2.8% with a 62% payout ratio, supported by strong free cash flow coverage (~81%). HII yields 2.77% with a 37% payout ratio but barely covers dividends with free cash flow (~7%). LMT’s robust buybacks outpace HII’s modest activity, enhancing total returns. LMT’s distribution model balances dividends and buybacks sustainably, while HII’s thin free cash flow raises risk. I conclude LMT offers a superior, more reliable shareholder reward in 2026.
Comparative Score Analysis: The Strategic Profile
The radar chart below exposes the core DNA and trade-offs of Lockheed Martin and Huntington Ingalls Industries, highlighting their distinctive financial strengths and weaknesses:
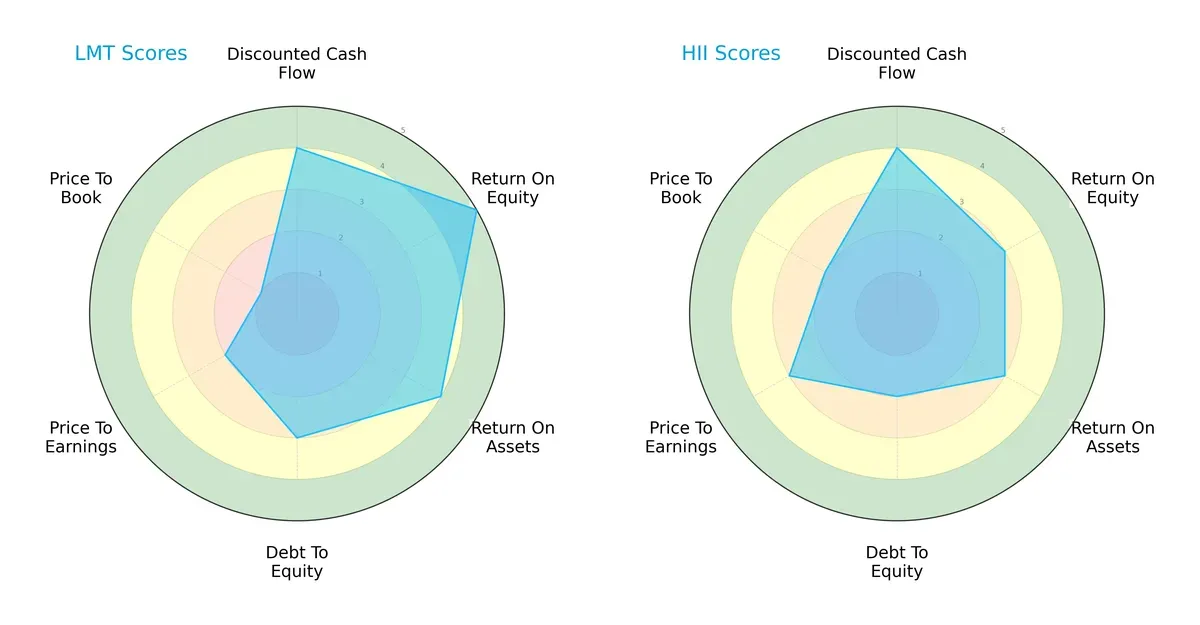
Lockheed Martin (LMT) excels in return on equity (5) and return on assets (4), demonstrating superior efficiency in profit generation and asset utilization. Huntington Ingalls Industries (HII) holds a more conservative debt profile (2 vs. 3) and better valuation scores (PE 3, PB 2 vs. 2 and 1), suggesting less financial risk and more attractive pricing. LMT’s profile is sharply tilted toward operational efficiency, while HII offers a more balanced risk-reward mix.
Bankruptcy Risk: Solvency Showdown
Lockheed Martin’s Altman Z-Score of 3.69 outpaces Huntington Ingalls’ 3.20, indicating a stronger buffer against bankruptcy in today’s volatile cycle:
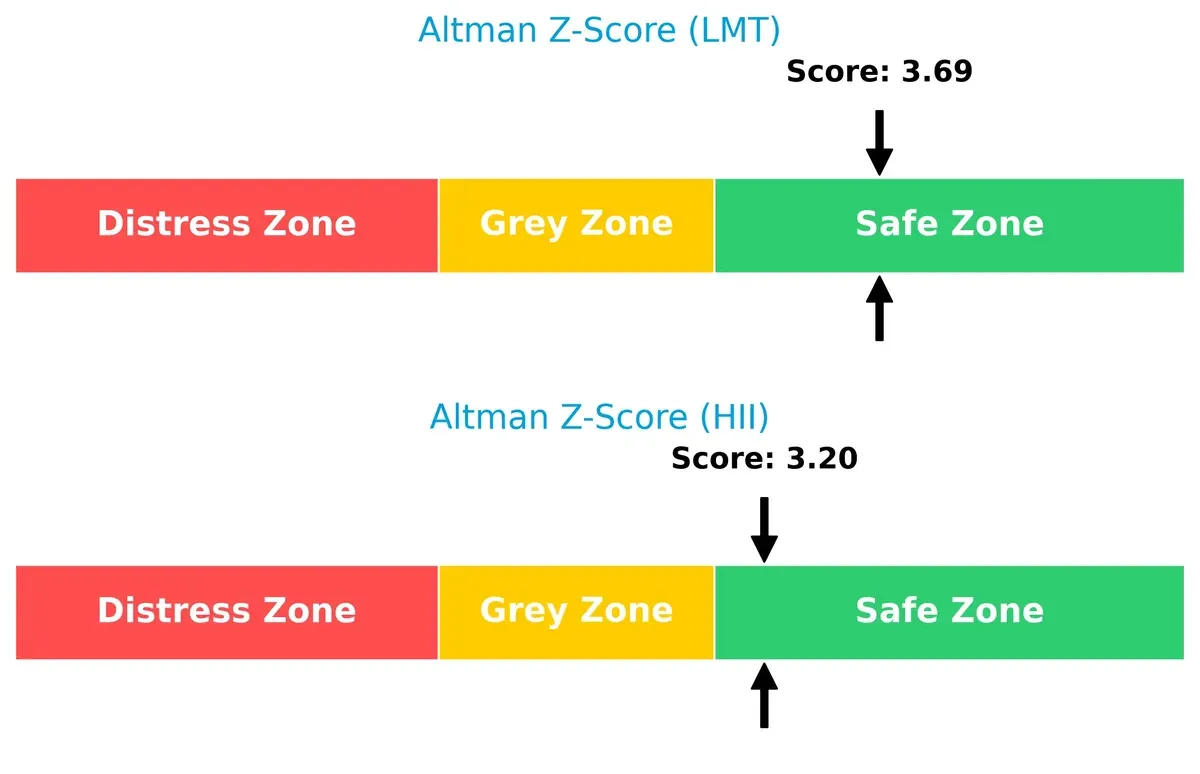
Both firms reside comfortably in the safe zone, but LMT’s higher score signals a more resilient capital structure and better long-term survival odds amid market uncertainties.
Financial Health: Quality of Operations
Huntington Ingalls scores a 7 on the Piotroski F-Score, surpassing Lockheed Martin’s 6, reflecting stronger operational and financial quality:
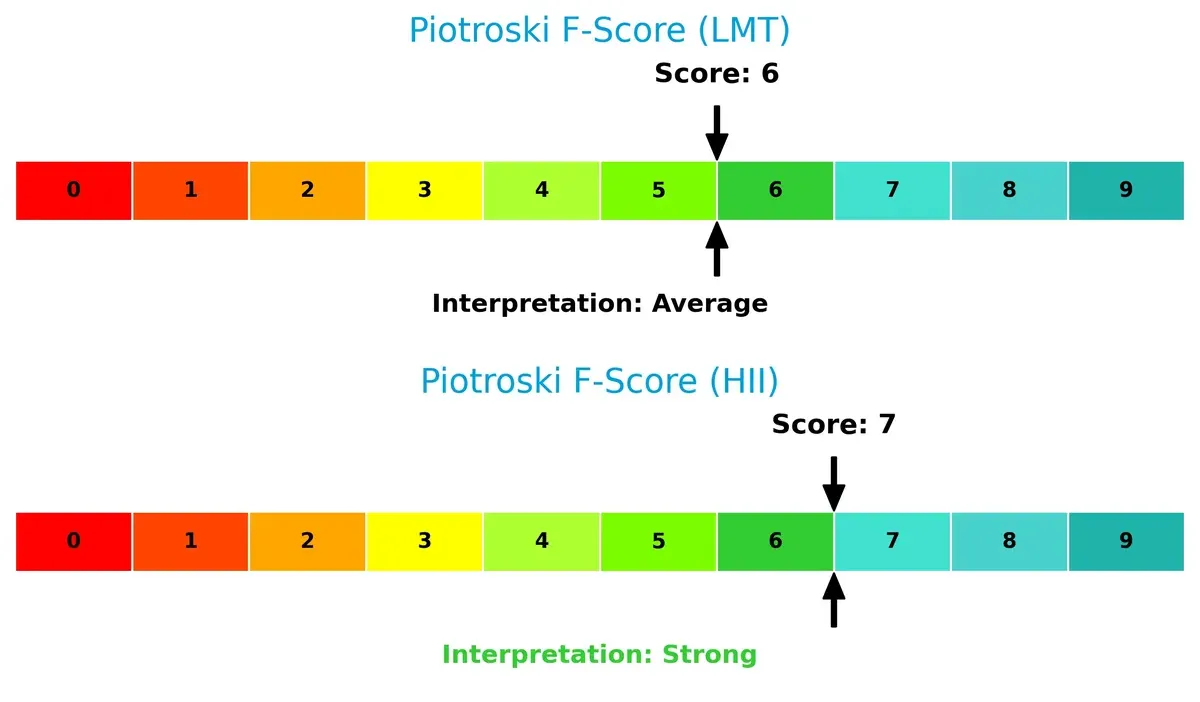
HII exhibits fewer red flags in profitability, leverage, and efficiency metrics. LMT’s slightly lower score suggests room for improvement in internal financial controls, though both companies maintain solid financial health.
How are the two companies positioned?
This section dissects the operational DNA of Lockheed Martin and Huntington Ingalls by comparing revenue distribution and internal dynamics. The goal is to confront their economic moats, revealing which model offers the most resilient, sustainable competitive advantage today.
Revenue Segmentation: The Strategic Mix
This visual comparison dissects how Lockheed Martin and Huntington Ingalls diversify their income streams and highlights their primary sector bets:
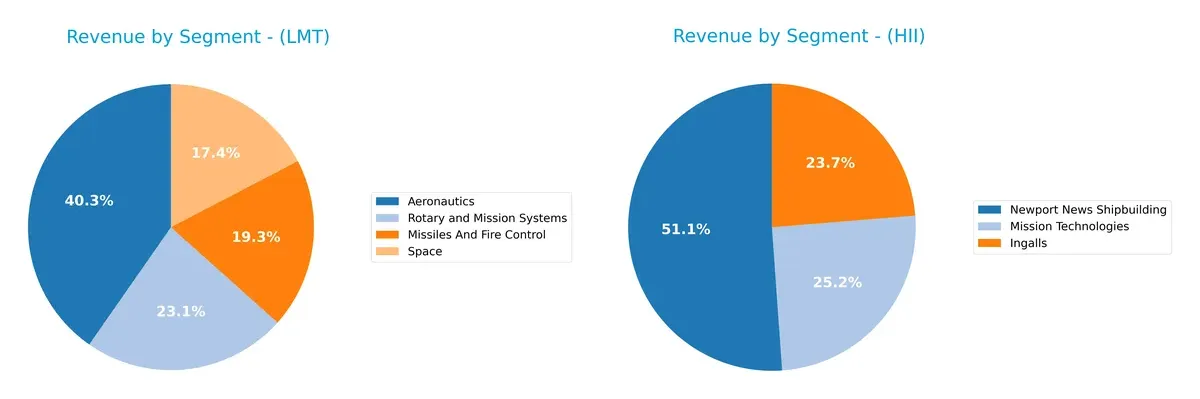
Lockheed Martin anchors its revenue around Aeronautics at $30.3B, with strong contributions from Rotary and Mission Systems ($17.3B) and Space ($13B). Huntington Ingalls relies heavily on Newport News Shipbuilding at $6B, with smaller streams from Ingalls ($2.77B) and Mission Technologies ($2.94B). Lockheed Martin shows a more diversified portfolio across aerospace and defense, reducing concentration risk. Huntington Ingalls pivots on shipbuilding dominance, exposing it to sector-specific cycles.
Strengths and Weaknesses Comparison
This table compares the strengths and weaknesses of Lockheed Martin Corporation and Huntington Ingalls Industries, Inc.:
Lockheed Martin Strengths
- Diversified revenue across Aeronautics, Missiles, Rotary, and Space
- High ROE of 74.65% and ROIC of 17.39%, well above WACC
- Strong global presence with significant US and international sales
- Favorable debt metrics with low debt-to-assets at 1.95%
- High asset turnover indicating efficient use of assets
- Dividend yield at 2.8%
Huntington Ingalls Strengths
- Favorable PE of 13.54 and reasonable PB of 1.6
- Favorable WACC at 5.07% and interest coverage at 7.77
- Focused revenue streams in shipbuilding and mission tech with steady revenues
- Quick ratio above 1.0 indicating good short-term liquidity
- Favorable fixed asset turnover at 3.13
- Dividend yield at 2.77%
Lockheed Martin Weaknesses
- High PB ratio of 16.62 signals expensive valuation
- Neutral net margin at 6.68%, lower than expected for size
- Quick ratio below 1.0 suggests limited immediate liquidity
- Heavy reliance on US market (53.7B of total revenue)
- Moderate dividend yield limits income appeal
Huntington Ingalls Weaknesses
- Unfavorable net margin at 4.77% and ROIC at 4.74%, below cost of capital
- Higher debt-to-equity ratio at 0.73 reflecting more leverage
- Neutral ROE of 11.79% indicates weaker profitability
- Less diversified revenue streams focused on shipbuilding
- No reported international revenue, limiting global presence
Lockheed Martin’s broad diversification and strong capital efficiency contrast with Huntington Ingalls’ narrower focus and weaker profitability. This highlights Lockheed’s strategic advantage in innovation and global reach, while Huntington faces challenges in margin expansion and diversification.
The Moat Duel: Analyzing Competitive Defensibility
A structural moat is the only reliable barrier protecting long-term profits from relentless competitive erosion in aerospace and defense:
Lockheed Martin Corporation: Network Effects and Intangible Assets Fortress
I identify Lockheed Martin’s moat in its deep network effects and proprietary defense technologies. This translates into a high ROIC exceeding WACC by 12.5%, signaling value creation despite a declining trend. Expansion into space and missile defense in 2026 could reinforce this advantage.
Huntington Ingalls Industries, Inc.: Specialized Shipbuilding Niche
HII’s moat rests on specialized shipbuilding and nuclear maintenance, a narrower moat than Lockheed’s diversified portfolio. Its ROIC trails WACC, indicating value destruction amid shrinking margins. Growth hinges on naval contracts and innovation but faces profitability pressure in 2026.
Verdict: Network Effects vs. Specialized Production
Lockheed Martin’s wider moat benefits from scalable network effects and innovation, outperforming Huntington Ingalls’ niche shipbuilding moat. Lockheed is better poised to defend and grow market share amid evolving defense demands.
Which stock offers better returns?
Over the past year, both Lockheed Martin Corporation and Huntington Ingalls Industries, Inc. showed strong price appreciation with accelerating bullish trends and increasing buyer dominance.
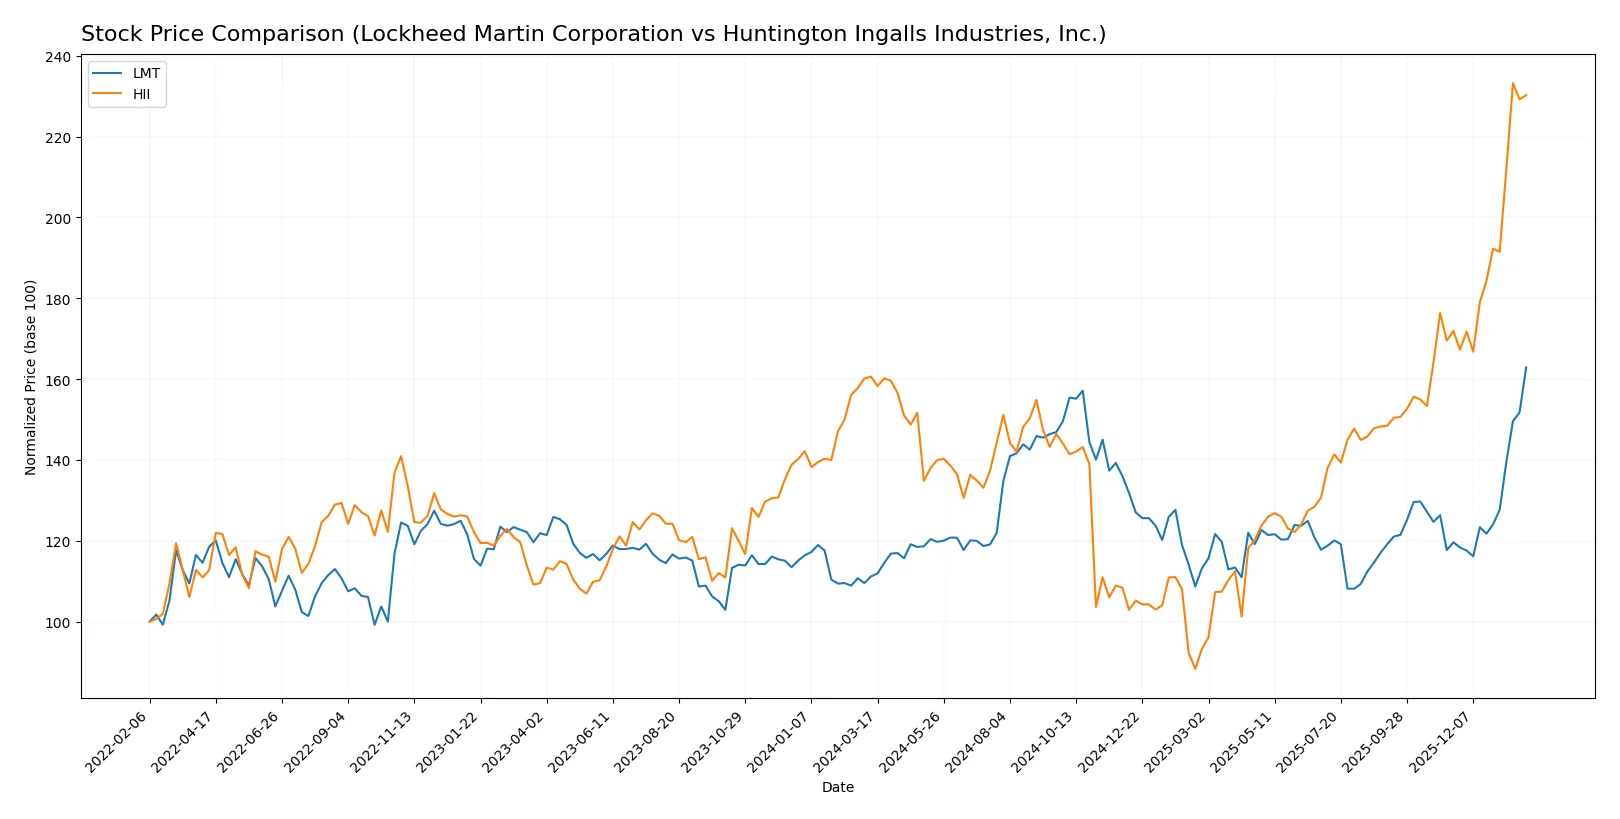
Trend Comparison
Lockheed Martin’s stock rose 46.5% over 12 months, showing an accelerating bullish trend from 421.01 to a high of 634.22. Recent months saw a 36.17% gain with strong upward momentum.
Huntington Ingalls gained 43.36% over the year with acceleration, moving from 161.27 to 425.9. The recent trend shows a 33.93% rise, maintaining a robust bullish slope.
Lockheed Martin slightly outperformed Huntington Ingalls in total price appreciation and recent momentum, delivering the higher market return over the period.
Target Prices
Analysts present a cautiously optimistic consensus for Lockheed Martin and Huntington Ingalls Industries.
| Company | Target Low | Target High | Consensus |
|---|---|---|---|
| Lockheed Martin Corporation | 519 | 695 | 607.7 |
| Huntington Ingalls Industries, Inc. | 264 | 425 | 367 |
Lockheed Martin’s consensus target of 607.7 sits modestly below its current price of 634.22, signaling limited upside. Huntington Ingalls shows upside potential, with a consensus target below its current price of 420.51, hinting at possible valuation pressure.

Don’t Let Luck Decide Your Entry Point
Optimize your entry points with our advanced ProRealTime indicators. You’ll get efficient buy signals with precise price targets for maximum performance. Start outperforming now!
How do institutions grade them?
Here is a summary of recent institutional grades for Lockheed Martin Corporation and Huntington Ingalls Industries, Inc.:
Lockheed Martin Corporation Grades
The following table shows recent grades assigned by reputable grading firms to Lockheed Martin:
| Grading Company | Action | New Grade | Date |
|---|---|---|---|
| RBC Capital | Maintain | Sector Perform | 2026-01-30 |
| TD Cowen | Maintain | Hold | 2026-01-30 |
| UBS | Maintain | Neutral | 2026-01-15 |
| Citigroup | Maintain | Neutral | 2026-01-13 |
| Jefferies | Maintain | Hold | 2026-01-12 |
| Truist Securities | Upgrade | Buy | 2026-01-09 |
| JP Morgan | Downgrade | Neutral | 2025-12-19 |
| Morgan Stanley | Downgrade | Equal Weight | 2025-12-16 |
| UBS | Maintain | Neutral | 2025-10-22 |
| Bernstein | Maintain | Market Perform | 2025-10-20 |
Huntington Ingalls Industries, Inc. Grades
Below are recent institutional grades for Huntington Ingalls Industries from established grading entities:
| Grading Company | Action | New Grade | Date |
|---|---|---|---|
| Goldman Sachs | Maintain | Buy | 2026-01-20 |
| Citigroup | Maintain | Buy | 2026-01-13 |
| JP Morgan | Maintain | Neutral | 2025-11-03 |
| Goldman Sachs | Maintain | Buy | 2025-10-31 |
| TD Cowen | Maintain | Buy | 2025-10-31 |
| B of A Securities | Maintain | Underperform | 2025-08-13 |
| Barclays | Maintain | Equal Weight | 2025-08-04 |
| TD Cowen | Upgrade | Buy | 2025-07-10 |
| Barclays | Maintain | Equal Weight | 2025-05-05 |
| Goldman Sachs | Maintain | Buy | 2025-05-02 |
Which company has the best grades?
Huntington Ingalls Industries has received more consistent “Buy” ratings from top firms like Goldman Sachs and Citigroup. Lockheed Martin’s grades cluster around “Hold” and “Neutral,” with some recent downgrades. This suggests investors may perceive Huntington Ingalls as having stronger near-term growth prospects or valuation appeal.
Risks specific to each company
The following categories identify the critical pressure points and systemic threats facing both firms in the 2026 market environment:
1. Market & Competition
Lockheed Martin Corporation
- Dominates with diversified aerospace & defense segments, strong U.S. government ties, but high exposure to budget cycles.
Huntington Ingalls Industries, Inc.
- Focuses on military shipbuilding, niche market but highly dependent on U.S. Navy contracts and defense spending.
2. Capital Structure & Debt
Lockheed Martin Corporation
- Low debt-to-equity (0.17) and strong interest coverage (6.3) indicate conservative leverage and financial stability.
Huntington Ingalls Industries, Inc.
- Higher debt-to-equity (0.73) and solid interest coverage (7.77) reflect moderate leverage but manageable financial risk.
3. Stock Volatility
Lockheed Martin Corporation
- Very low beta (0.245) suggests low stock volatility, appealing for risk-averse investors.
Huntington Ingalls Industries, Inc.
- Slightly higher beta (0.354) indicates moderate volatility but still below market average.
4. Regulatory & Legal
Lockheed Martin Corporation
- Faces stringent U.S. government compliance and export controls, with risk from shifting defense policies.
Huntington Ingalls Industries, Inc.
- Subject to heavy regulation in naval shipbuilding and nuclear services, with potential environmental liabilities.
5. Supply Chain & Operations
Lockheed Martin Corporation
- Complex global supply chains for advanced tech; risks include delays and cost inflation.
Huntington Ingalls Industries, Inc.
- Concentrated shipbuilding operations with potential for bottlenecks and dependency on specialized suppliers.
6. ESG & Climate Transition
Lockheed Martin Corporation
- Increasing pressure to improve ESG practices, especially in emissions and sustainable innovation.
Huntington Ingalls Industries, Inc.
- High scrutiny on nuclear operations and environmental management; ESG transition risks are material.
7. Geopolitical Exposure
Lockheed Martin Corporation
- Significant exposure to global defense contracts and geopolitical tensions, which can both boost and disrupt revenues.
Huntington Ingalls Industries, Inc.
- Primarily U.S.-focused but influenced by international defense dynamics and regulatory shifts.
Which company shows a better risk-adjusted profile?
Lockheed Martin’s most impactful risk lies in geopolitical exposure and budget dependency but benefits from robust capital structure and low volatility. Huntington Ingalls faces greater operational and regulatory risks tied to its niche naval focus and higher leverage. Lockheed Martin shows a superior risk-adjusted profile, supported by a safer Altman Z-score (3.69 vs. 3.20) and more favorable financial ratios. The recent low beta and strong interest coverage reinforce Lockheed’s defensive stance amid defense sector uncertainties.
Final Verdict: Which stock to choose?
Lockheed Martin Corporation’s superpower lies in its efficient capital deployment, consistently generating returns well above its cost of capital. This cash machine demonstrates strong operational resilience despite a declining profitability trend—a point of vigilance for investors. It suits portfolios targeting aggressive growth with a tolerance for cyclical challenges.
Huntington Ingalls Industries, Inc. benefits from a strategic moat built on steady government contracts and recurring revenue streams. While its value creation lags behind Lockheed Martin, it offers a more moderate risk profile with stable cash flow generation. It fits well in GARP portfolios seeking growth with a reasonable margin of safety.
If you prioritize robust value creation and operational efficiency, Lockheed Martin outshines due to its superior ROIC and strong market position. However, if you seek better stability and a more conservative growth approach, Huntington Ingalls offers a safer investment scenario despite weaker profitability metrics. Both require careful monitoring of their respective profitability trajectories.
Disclaimer: Investment carries a risk of loss of initial capital. The past performance is not a reliable indicator of future results. Be sure to understand risks before making an investment decision.
Go Further
I encourage you to read the complete analyses of Lockheed Martin Corporation and Huntington Ingalls Industries, Inc. to enhance your investment decisions: