Home > Comparison > Industrials > LHX vs HII
The strategic rivalry between L3Harris Technologies and Huntington Ingalls Industries shapes the aerospace and defense sector’s evolution. L3Harris operates as a diversified technology leader, focusing on advanced mission systems and communications. Huntington Ingalls specializes as a capital-intensive shipbuilder, delivering naval vessels and lifecycle services. This analysis pits innovation against manufacturing scale to identify which trajectory offers superior risk-adjusted returns for a balanced, industrials-focused portfolio.
Table of contents
Companies Overview
L3Harris Technologies and Huntington Ingalls Industries define key pillars in the aerospace and defense sector, shaping U.S. military capabilities.
L3Harris Technologies, Inc.: Integrated Defense Innovator
L3Harris dominates aerospace and defense with multi-mission ISR systems and advanced communication solutions. Its revenue stems from integrated mission systems, space payloads, and tactical communications. In 2026, the company emphasizes cutting-edge electro-optical tech and battlefield network integration, reinforcing its position in mission-critical government and commercial contracts worldwide.
Huntington Ingalls Industries, Inc.: Naval Shipbuilding Powerhouse
Huntington Ingalls leads as the U.S. Navy’s primary military shipbuilder, focusing on amphibious assault ships, aircraft carriers, and nuclear subs. It generates revenue through ship construction, overhaul, and life-cycle sustainment services. The company’s 2026 strategy centers on expanding naval nuclear support and technical solutions, serving defense and federal clients with high-end IT and unmanned systems.
Strategic Collision: Similarities & Divergences
Both firms serve the U.S. defense sector but diverge sharply: L3Harris prioritizes integrated technology systems while Huntington Ingalls specializes in naval shipbuilding craftsmanship. Their battleground is defense modernization—L3Harris with ISR and cyber solutions, Huntington with fleet sustainment and nuclear support. This contrast highlights distinct investment profiles: tech-driven innovation versus heavy industrial expertise.
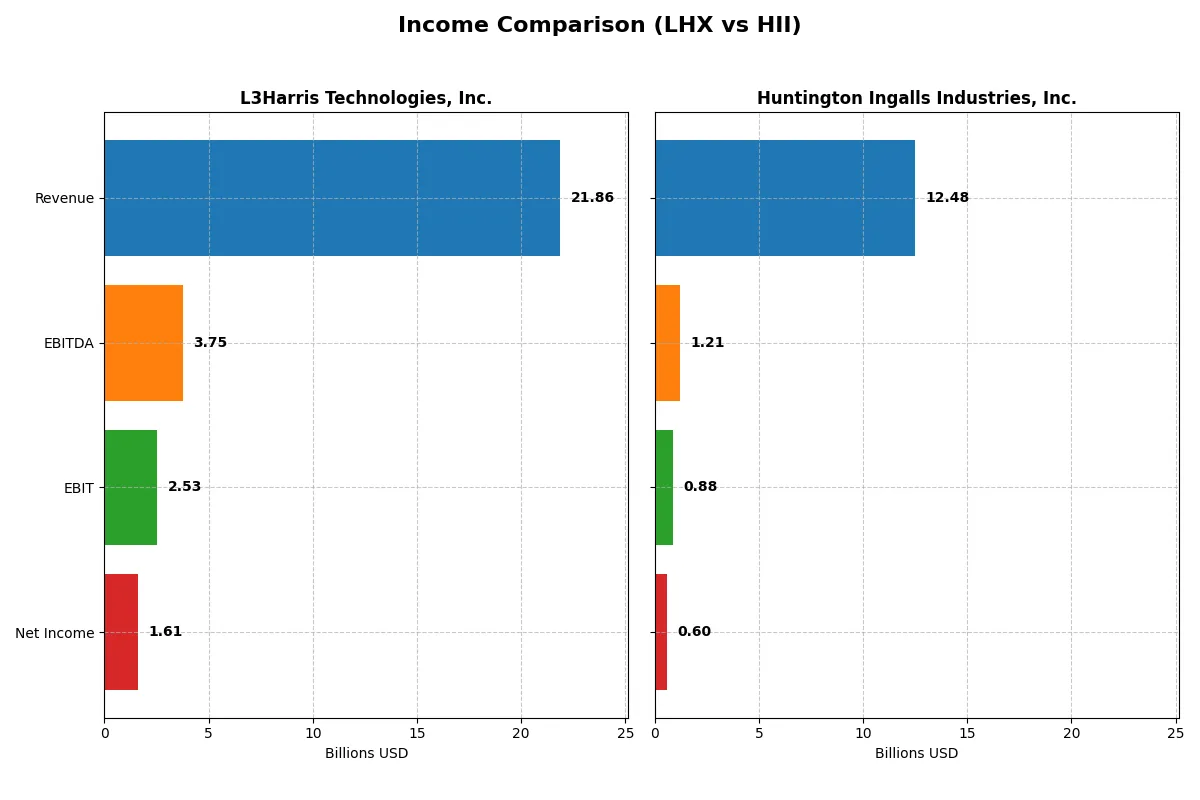
Income Statement Comparison
This data dissects the core profitability and scalability of both corporate engines to reveal who dominates the bottom line:
| Metric | L3Harris Technologies, Inc. (LHX) | Huntington Ingalls Industries, Inc. (HII) |
|---|---|---|
| Revenue | 21.9B | 12.5B |
| Cost of Revenue | 16.2B | 10.9B |
| Operating Expenses | 3.43B | 977M |
| Gross Profit | 5.63B | 1.59B |
| EBITDA | 3.75B | 1.21B |
| EBIT | 2.53B | 882M |
| Interest Expense | 597M | 105M |
| Net Income | 1.61B | 605M |
| EPS | 8.57 | 15.39 |
| Fiscal Year | 2025 | 2025 |
Income Statement Analysis: The Bottom-Line Duel
This income statement comparison reveals how efficiently each company converts revenue into profit in a competitive market environment.
L3Harris Technologies, Inc. Analysis
L3Harris’s revenue grew modestly by 2.5% in 2025, reaching $21.9B, while net income rose to $1.61B. Its gross margin improved to 25.7%, signaling strong cost control. The net margin at 7.35% remains favorable, reflecting solid operational efficiency despite a slight revenue growth slowdown. Momentum in profitability is evident with an 11.3% EBIT increase.
Huntington Ingalls Industries, Inc. Analysis
Huntington Ingalls expanded revenue by 8.2% to $12.5B in 2025, outpacing L3Harris’s top-line growth. Gross margin held steady at 12.7%, and net margin stayed at 4.85%. EBIT surged 19.5%, showing improved operating leverage. The company’s net income climbed to $605M, supported by controlled expenses and favorable interest costs.
Margin Strength vs. Growth Momentum
L3Harris delivers superior margins, with a gross margin more than double Huntington’s and a net margin reflecting better profitability per dollar earned. However, Huntington Ingalls outperforms in revenue and EBIT growth, signaling stronger momentum. For investors prioritizing margin quality and efficiency, L3Harris stands out. Those favoring growth trajectory may find Huntington’s profile more compelling.
Financial Ratios Comparison
These vital ratios act as a diagnostic tool to expose the underlying fiscal health, valuation premiums, and capital efficiency of the companies compared below:
| Ratios | L3Harris Technologies, Inc. (LHX) | Huntington Ingalls Industries, Inc. (HII) |
|---|---|---|
| ROE | 8.18% | 11.93% |
| ROIC | 5.37% | 9.03% |
| P/E | 35.53 | 22.09 |
| P/B | 2.91 | 2.63 |
| Current Ratio | 1.19 | 1.13 |
| Quick Ratio | 1.02 | 1.06 |
| D/E | 0.53 | 0.62 |
| Debt-to-Assets | 25.35% | 24.68% |
| Interest Coverage | 3.68 | 5.79 |
| Asset Turnover | 0.53 | 0.98 |
| Fixed Asset Turnover | 8.20 | 3.35 |
| Payout Ratio | 56.23% | 35.21% |
| Dividend Yield | 1.58% | 1.59% |
| Fiscal Year | 2025 | 2025 |
Efficiency & Valuation Duel: The Vital Signs
Ratios act as a company’s DNA, revealing hidden risks and operational excellence that shape investor confidence and valuation insights.
L3Harris Technologies, Inc.
L3Harris shows moderate profitability with an 8.18% ROE and a 7.35% net margin, signaling operational stability but limited growth leverage. The stock trades at a stretched P/E of 35.53, suggesting high expectations. Dividend yield stands at 1.58%, reflecting balanced shareholder returns amid neutral reinvestment signals.
Huntington Ingalls Industries, Inc.
Huntington Ingalls delivers stronger core profitability with an 11.93% ROE but a weaker 4.85% net margin, indicating margin pressure. Its valuation at a P/E of 22.09 appears more reasonable. The 1.59% dividend yield complements a slightly higher free cash flow efficiency, pointing to shareholder value focus alongside neutral growth indications.
Valuation Discipline Meets Operational Efficiency
Huntington Ingalls offers a more attractive risk-reward profile with better profitability and a reasonable P/E. L3Harris’s stretched valuation demands careful scrutiny amid moderate returns. Investors favoring operational efficiency and valuation discipline may find Huntington’s profile more aligned with prudent risk management.
Which one offers the Superior Shareholder Reward?
I see L3Harris Technologies (LHX) delivers a balanced distribution with a 1.58% dividend yield and a 56% payout ratio, supported by strong free cash flow at 86% coverage. Their buyback program is moderate but consistent, enhancing total returns sustainably. Huntington Ingalls Industries (HII) offers a slightly lower 1.59% dividend yield with a 35% payout ratio, indicating more retained earnings for growth. However, HII’s buybacks are less aggressive relative to its free cash flow, which is only 66% covered, raising sustainability concerns. I judge LHX’s distribution philosophy more durable for long-term value and total shareholder return in 2026.
Comparative Score Analysis: The Strategic Profile
The radar chart reveals the fundamental DNA and trade-offs of L3Harris Technologies and Huntington Ingalls Industries, highlighting their financial strengths and weaknesses:
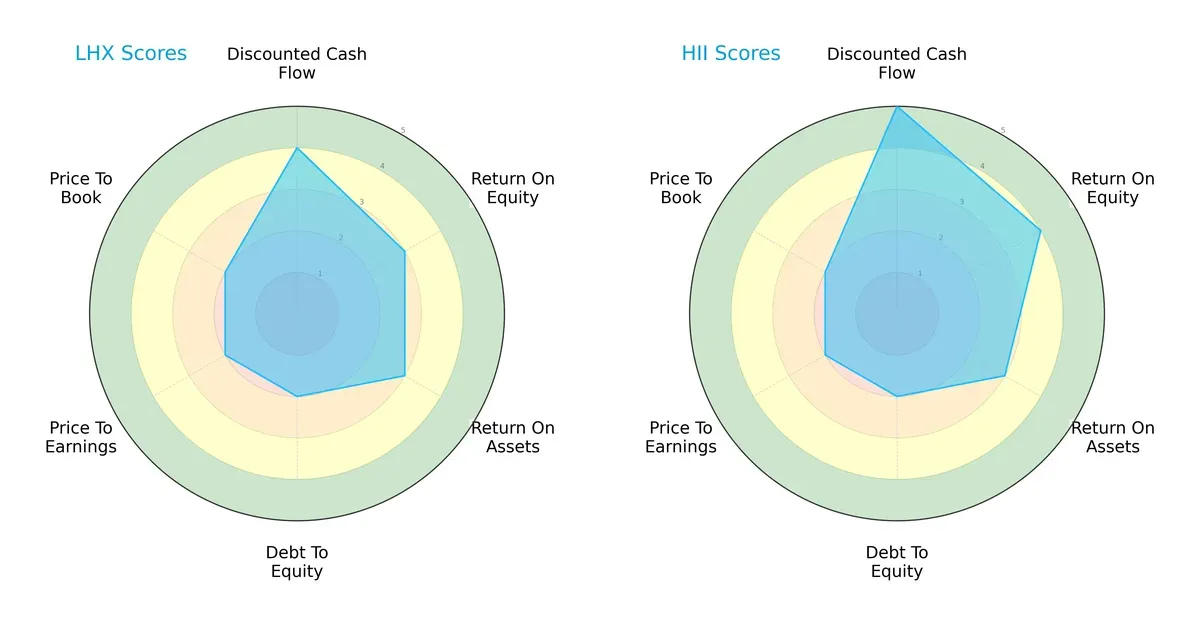
Huntington Ingalls leads in discounted cash flow (5 vs. 4) and return on equity (4 vs. 3), signaling stronger profitability and valuation discipline. Both firms share moderate return on assets and identical debt-to-equity and valuation scores, reflecting balanced leverage and market pricing. L3Harris presents a more uniform profile, while Huntington Ingalls relies on its superior cash flow and equity returns for competitive advantage.
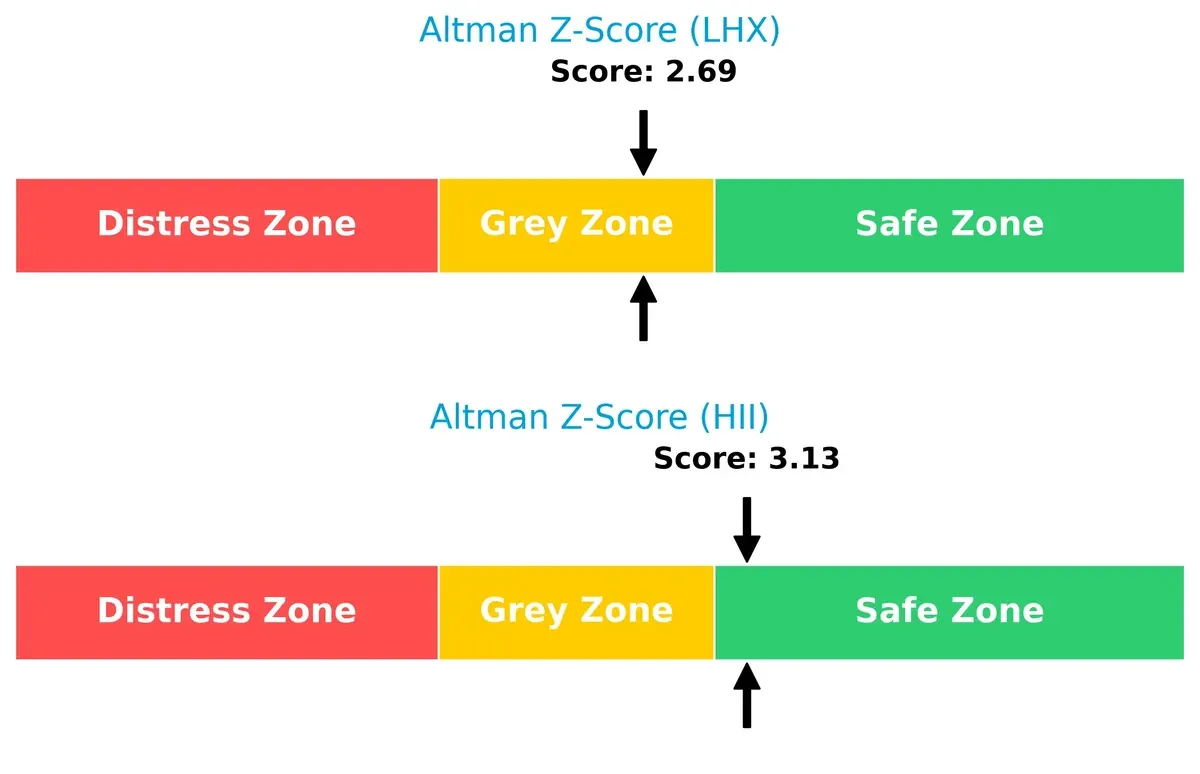
Bankruptcy Risk: Solvency Showdown
The Altman Z-Score shows Huntington Ingalls (3.13) safely outperforms L3Harris (2.69), indicating stronger solvency and lower bankruptcy risk in the current economic cycle:
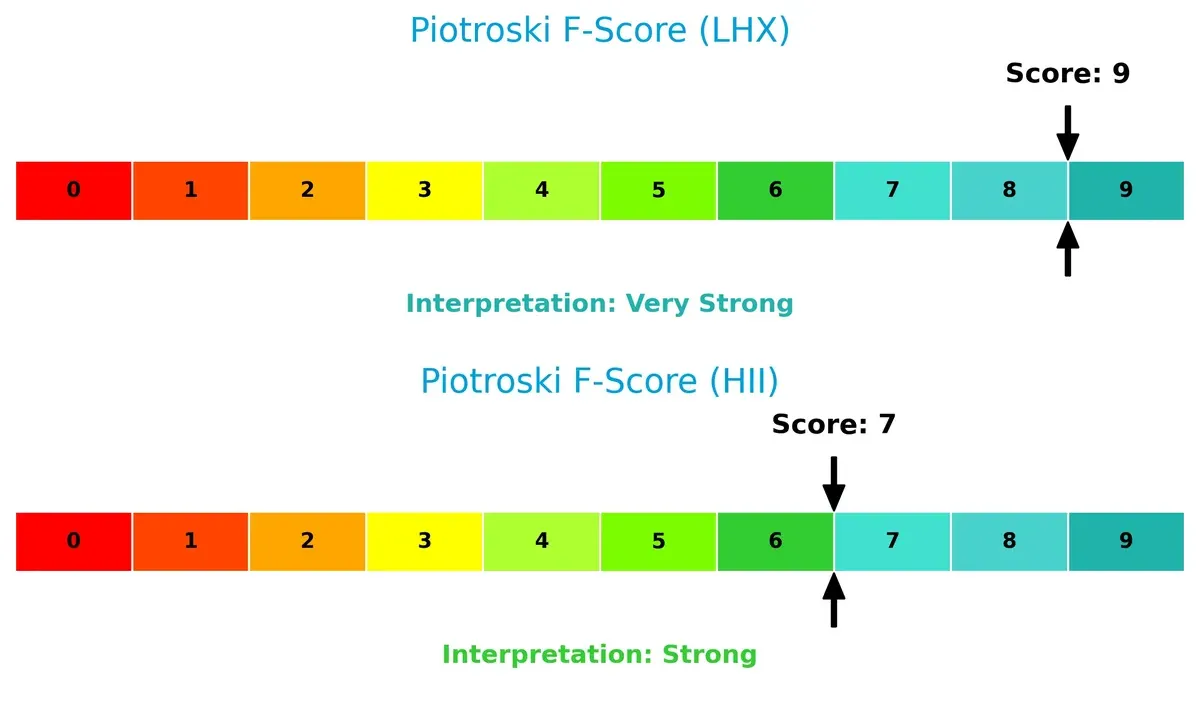
Financial Health: Quality of Operations
L3Harris scores a perfect 9 on the Piotroski scale, surpassing Huntington Ingalls’ strong 7, revealing superior financial health and operational quality with fewer internal red flags:
How are the two companies positioned?
This section dissects the operational DNA of LHX and HII by comparing their revenue distribution and internal strengths and weaknesses. The goal is to confront their economic moats and identify which model offers the most resilient, sustainable competitive advantage today.
Revenue Segmentation: The Strategic Mix
This visual comparison dissects how L3Harris Technologies and Huntington Ingalls diversify their income streams and highlights their primary sector bets for 2025:
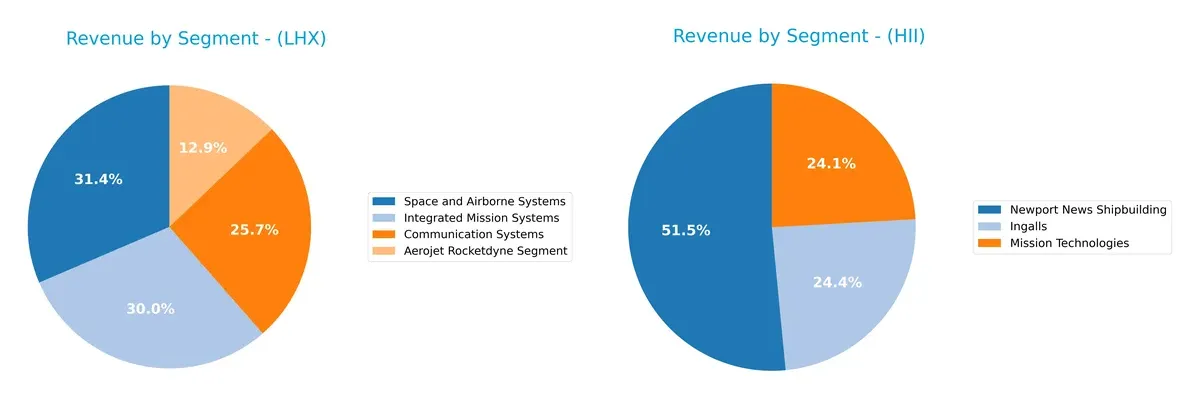
L3Harris dominates with a broad portfolio: Space and Airborne Systems leads at $6.95B, closely followed by Integrated Mission Systems ($6.63B) and Communication Systems ($5.67B). Huntington Ingalls leans heavily on Newport News Shipbuilding, which anchors $6.51B, dwarfing its other segments. L3Harris’s diversification reduces concentration risk and leverages an ecosystem lock-in, while Huntington Ingalls’s reliance on shipbuilding signals infrastructure dominance but exposes it to sector cyclicality.
Strengths and Weaknesses Comparison
This table compares the Strengths and Weaknesses of L3Harris Technologies, Inc. and Huntington Ingalls Industries, Inc.:
LHX Strengths
- Diverse revenue from four major segments totaling over 22B
- Favorable quick ratio and debt to assets ratio
- High fixed asset turnover indicates efficient use of fixed assets
HII Strengths
- Strong market position in shipbuilding with 6.5B revenue segment
- Favorable interest coverage and fixed asset turnover ratios
- Slightly higher ROE and ROIC indicating better capital returns
LHX Weaknesses
- Unfavorable ROE and relatively high PE suggest valuation and profitability concerns
- Neutral net margin and moderate current ratio pose liquidity caution
- Net margin at 7.35% lags industry leaders
HII Weaknesses
- Lower net margin at 4.85% indicates weaker profitability
- Less diversified revenue streams concentrated in shipbuilding
- Slightly higher debt to equity ratio may increase financial risk
LHX shows a broad product diversification and sound asset efficiency but struggles with profitability metrics. HII benefits from strong capital returns and interest coverage, yet faces profitability and diversification challenges. These factors shape their strategic focus on operational efficiency and financial management.
The Moat Duel: Analyzing Competitive Defensibility
A structural moat shields long-term profits from competitive erosion, making it the critical defense for sustaining economic value:
L3Harris Technologies, Inc.: Integration-Driven Cost Advantage
L3Harris leverages integrated mission systems and communication tech to maintain cost advantages visible in solid margins. However, its declining ROIC signals weakening moat strength in 2026.
Huntington Ingalls Industries, Inc.: Specialized Shipbuilding Expertise
Huntington Ingalls’ moat rests on specialized naval shipbuilding, supporting a rising ROIC and expanding profitability. This niche focus enhances its competitive position beyond L3Harris’s broad aerospace footprint.
Cost Efficiency vs. Specialized Expertise: The Moat Battle
Huntington Ingalls holds the deeper moat with a robust, growing ROIC and focused domain expertise. L3Harris’s broader integration faces margin pressures, leaving it less equipped to defend market share.
Which stock offers better returns?
The past year shows strong upward momentum for both L3Harris Technologies, Inc. and Huntington Ingalls Industries, Inc., with notable acceleration in price gains and rising trading volumes.
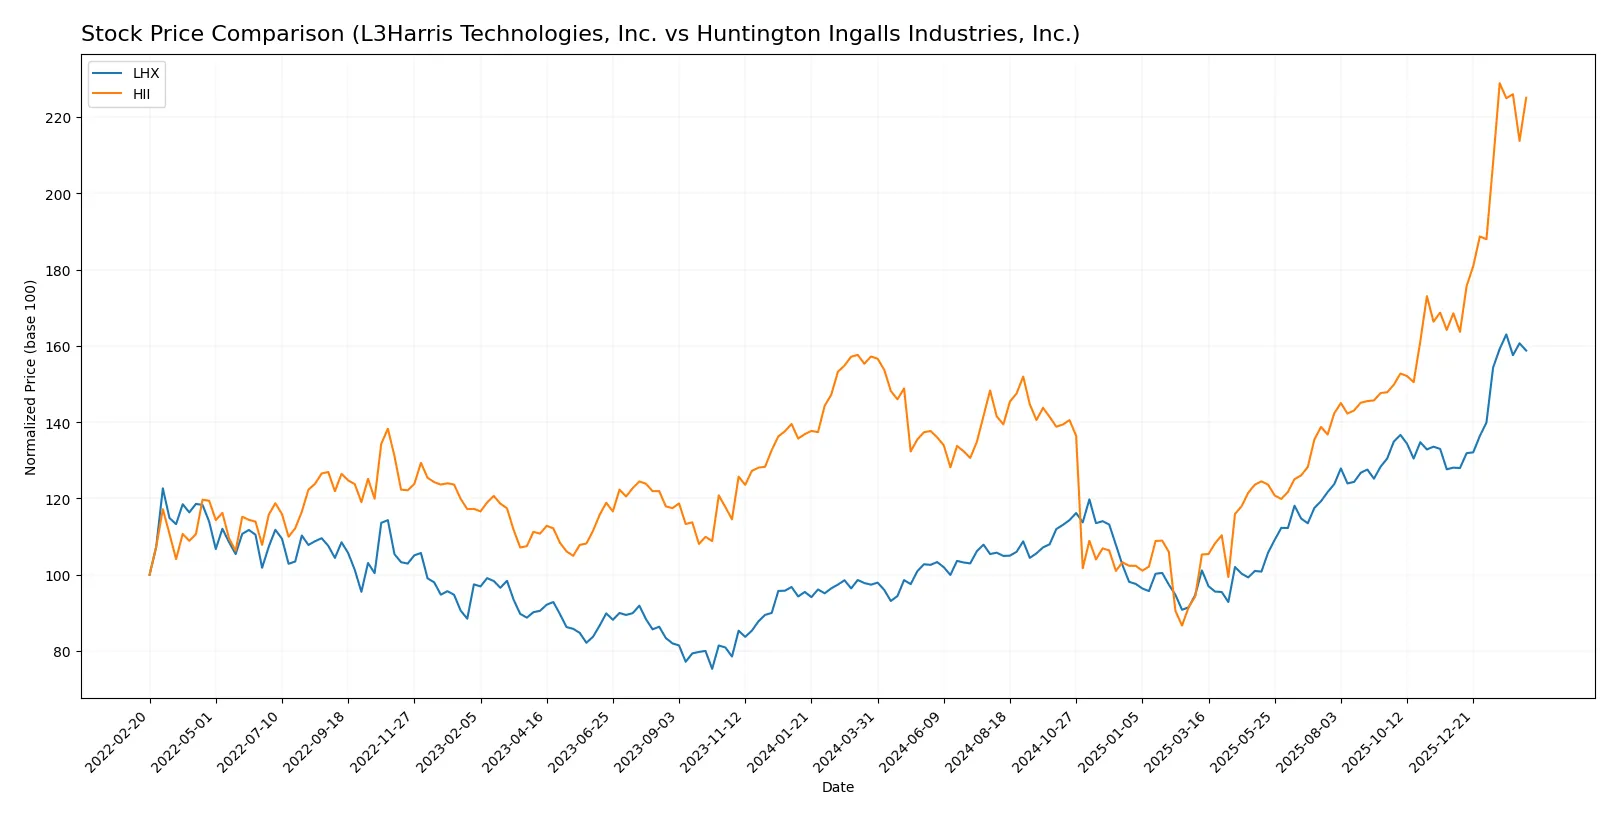
Trend Comparison
L3Harris Technologies, Inc. gained 63.02% over the past 12 months, marking a bullish trend with accelerating momentum and a high volatility of 37.57%. It traded between 197.61 and 354.73.
Huntington Ingalls Industries, Inc. rose 43.15% in the same period, also bullish with acceleration. Volatility was higher at 56.48%, and prices ranged from 161.27 to 425.9.
L3Harris Technologies delivered stronger market performance with a higher overall price increase despite Huntington Ingalls’ greater volatility and higher absolute price range.
Target Prices
Analysts present a bullish consensus for L3Harris Technologies and Huntington Ingalls Industries.
| Company | Target Low | Target High | Consensus |
|---|---|---|---|
| L3Harris Technologies, Inc. | 323 | 367 | 352.25 |
| Huntington Ingalls Industries, Inc. | 264 | 421 | 368 |
The consensus target prices for both stocks exceed current prices, signaling analyst confidence in further appreciation. LHX trades near its target median, while HII is close to its high range.

Don’t Let Luck Decide Your Entry Point
Optimize your entry points with our advanced ProRealTime indicators. You’ll get efficient buy signals with precise price targets for maximum performance. Start outperforming now!
How do institutions grade them?
L3Harris Technologies, Inc. Grades
Here are recent grades issued by major financial institutions for L3Harris Technologies, Inc.:
| Grading Company | Action | New Grade | Date |
|---|---|---|---|
| Citigroup | maintain | Buy | 2026-02-05 |
| JP Morgan | maintain | Overweight | 2026-02-05 |
| Morgan Stanley | maintain | Overweight | 2026-02-02 |
| RBC Capital | maintain | Sector Perform | 2026-01-30 |
| UBS | maintain | Neutral | 2026-01-15 |
| RBC Capital | maintain | Sector Perform | 2026-01-14 |
| Citigroup | maintain | Buy | 2026-01-13 |
| Morgan Stanley | upgrade | Overweight | 2025-12-16 |
| JP Morgan | maintain | Overweight | 2025-11-04 |
| UBS | maintain | Neutral | 2025-10-31 |
Huntington Ingalls Industries, Inc. Grades
Below are the latest ratings from recognized institutions for Huntington Ingalls Industries, Inc.:
| Grading Company | Action | New Grade | Date |
|---|---|---|---|
| B of A Securities | upgrade | Neutral | 2026-02-12 |
| Citigroup | maintain | Buy | 2026-02-10 |
| Goldman Sachs | maintain | Buy | 2026-01-20 |
| Citigroup | maintain | Buy | 2026-01-13 |
| JP Morgan | maintain | Neutral | 2025-11-03 |
| TD Cowen | maintain | Buy | 2025-10-31 |
| Goldman Sachs | maintain | Buy | 2025-10-31 |
| B of A Securities | maintain | Underperform | 2025-08-13 |
| Barclays | maintain | Equal Weight | 2025-08-04 |
| TD Cowen | upgrade | Buy | 2025-07-10 |
Which company has the best grades?
L3Harris Technologies holds consistently positive grades, including multiple “Buy” and “Overweight” ratings. Huntington Ingalls shows a mix of “Buy” and “Neutral” grades with some prior “Underperform” ratings. L3Harris’s stronger consensus may signal greater institutional confidence, potentially influencing investor perception and interest.
Risks specific to each company
In 2026’s complex market landscape, these categories highlight critical pressure points and systemic threats facing both L3Harris Technologies, Inc. (LHX) and Huntington Ingalls Industries, Inc. (HII):
1. Market & Competition
L3Harris Technologies, Inc. (LHX)
- Faces intense competition in aerospace & defense tech with pressure on margins.
Huntington Ingalls Industries, Inc. (HII)
- Competes in specialized naval shipbuilding with fewer direct competitors but high contract dependency.
2. Capital Structure & Debt
LHX
- Debt-to-assets at 25.35% is favorable; moderate leverage with interest coverage of 4.24x.
HII
- Similar leverage at 24.68%, but stronger interest coverage at 8.4x reduces default risk.
3. Stock Volatility
LHX
- Beta 0.64 indicates moderate volatility, less risky than broader market.
HII
- Lower beta 0.33 signals defensive stock with reduced price swings.
4. Regulatory & Legal
LHX
- Exposure to evolving defense regulations and export controls in multiple jurisdictions.
HII
- Heavily regulated due to nuclear shipbuilding; compliance costs and legal risks are significant.
5. Supply Chain & Operations
LHX
- Complex global supply chains for ISR and communication systems vulnerable to disruptions.
HII
- Concentrated U.S. shipyard operations face labor and materials supply challenges.
6. ESG & Climate Transition
LHX
- Moderate ESG risks; technology focus offers opportunities in clean defense solutions.
HII
- Greater pressure to address environmental impact of shipbuilding and nuclear operations.
7. Geopolitical Exposure
LHX
- Global footprint exposes it to geopolitical tensions affecting international contracts.
HII
- Primarily U.S.-focused, which limits geopolitical risk but increases dependency on government budgets.
Which company shows a better risk-adjusted profile?
LHX’s main risk is market competition with margin pressure in a global arena. HII’s most significant threat lies in regulatory and legal risks linked to nuclear shipbuilding. Despite a higher beta, LHX’s diversified portfolio and moderate leverage present a balanced risk. HII’s low volatility and stronger interest coverage enhance financial stability. However, HII’s regulatory burden and contract concentration raise caution. On a risk-adjusted basis, HII edges slightly ahead due to its safer Altman Z-score (3.13 safe zone vs. LHX’s 2.69 grey zone) and robust interest coverage, despite facing tougher regulatory challenges.
Final Verdict: Which stock to choose?
L3Harris Technologies, Inc. (LHX) boasts unmatched operational efficiency and a strong cash flow generation engine. Its main point of vigilance remains the declining profitability and value destruction, signaling risks if market conditions worsen. LHX fits investors with an appetite for aggressive growth but who can tolerate earnings volatility.
Huntington Ingalls Industries, Inc. (HII) stands out for its sustainable competitive moat, demonstrated by a rising ROIC well above its cost of capital. Its conservative financial profile offers better stability relative to LHX, making it appealing for growth-at-a-reasonable-price (GARP) investors seeking durable profitability.
If you prioritize aggressive expansion and operational leverage, LHX presents a compelling scenario despite its value erosion. However, if you seek a durable moat with improving capital efficiency and greater financial safety, HII outshines as the more prudent choice. Both require careful risk management aligned with your investment horizon.
Disclaimer: Investment carries a risk of loss of initial capital. The past performance is not a reliable indicator of future results. Be sure to understand risks before making an investment decision.
Go Further
I encourage you to read the complete analyses of L3Harris Technologies, Inc. and Huntington Ingalls Industries, Inc. to enhance your investment decisions: