Home > Comparison > Financial Services > USB vs HBAN
The strategic rivalry between U.S. Bancorp and Huntington Bancshares defines the current trajectory of the regional banking sector. U.S. Bancorp operates as a diversified financial services powerhouse with a broad footprint and multiple segments, while Huntington Bancshares focuses on regional commercial and consumer banking with a specialized vehicle finance division. This analysis will assess which company’s operational model offers a superior risk-adjusted profile for investors seeking stable growth within financial services.

Table of contents
Companies Overview
U.S. Bancorp and Huntington Bancshares are key regional players reshaping the U.S. banking landscape.
U.S. Bancorp: Midwest Banking Powerhouse
U.S. Bancorp dominates as a financial services holding company. It generates revenue through diversified segments: Corporate and Commercial Banking, Wealth Management, Payment Services, and Treasury functions. Its 2021 focus sharpened on expanding digital channels and deepening its presence in the Midwest and West through 2,230 branches and 4,059 ATMs, emphasizing broad customer reach and service integration.
Huntington Bancshares Incorporated: Regional Banking Innovator
Huntington Bancshares operates as a bank holding company with a focus on commercial, consumer, and mortgage banking. Revenue streams stem from Consumer and Business Banking, Commercial Banking, Vehicle Finance, and Private Client wealth management. In 2022, the firm concentrated on expanding its 1,000-branch footprint across 11 states while enhancing specialty banking and vehicle finance services to capture diverse regional clients.
Strategic Collision: Similarities & Divergences
Both banks pursue growth in the regional banking sector but differ in scale and strategic emphasis. U.S. Bancorp leverages a broad, integrated financial services model with a large geographic footprint, while Huntington focuses on specialized segments like vehicle finance and regional commercial banking. Their primary battleground is customer acquisition in Midwest and adjacent markets. These distinctions yield unique investment profiles: diversified scale versus niche specialization.
Income Statement Comparison
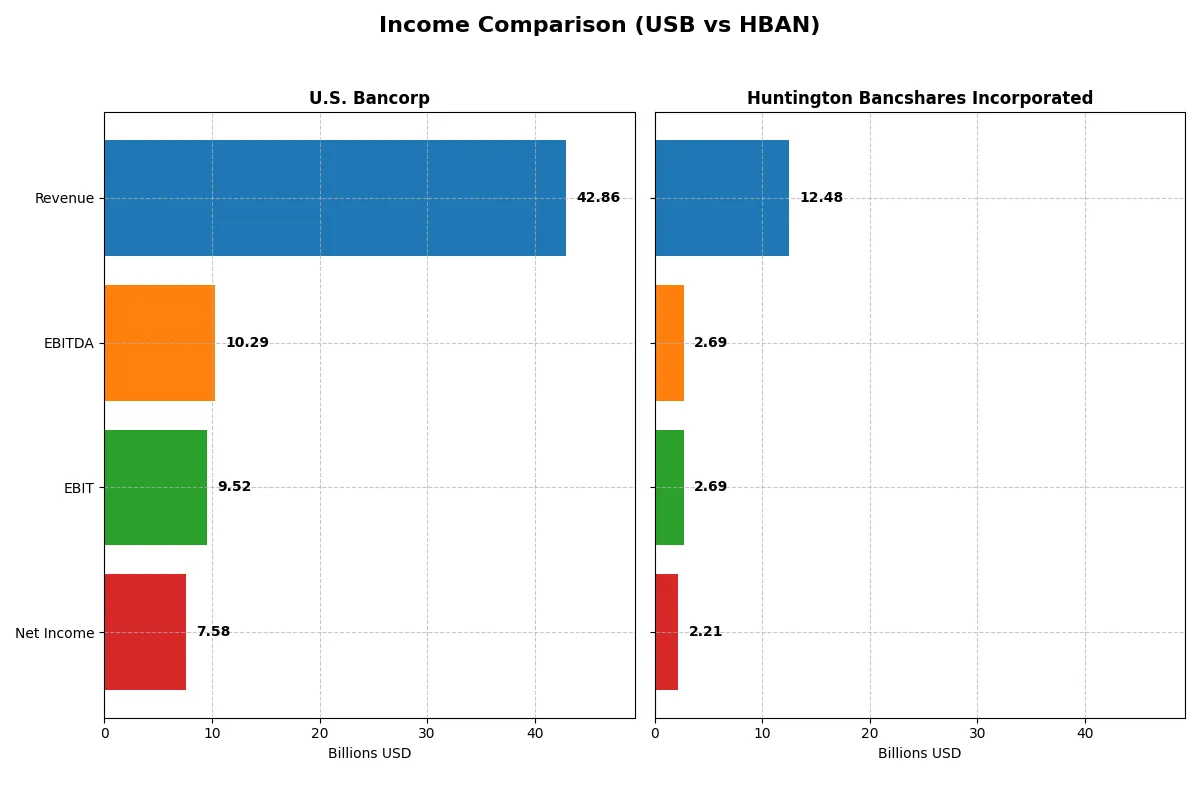
This data dissects the core profitability and scalability of both corporate engines to reveal who dominates the bottom line:
| Metric | U.S. Bancorp (USB) | Huntington Bancshares (HBAN) |
|---|---|---|
| Revenue | 42.9B | 12.5B |
| Cost of Revenue | 15.9B | 4.8B |
| Operating Expenses | 17.4B | 5.0B |
| Gross Profit | 26.9B | 7.7B |
| EBITDA | 10.3B | 2.7B |
| EBIT | 9.5B | 2.7B |
| Interest Expense | 14.3B | 4.3B |
| Net Income | 7.6B | 2.2B |
| EPS | 4.62 | 1.41 |
| Fiscal Year | 2025 | 2025 |
Income Statement Analysis: The Bottom-Line Duel
Comparing these income statements reveals how each company converts revenue into profit, spotlighting their operational efficiency and growth momentum.
U.S. Bancorp Analysis
U.S. Bancorp’s revenue rose steadily to $42.9B in 2025, but net income slipped slightly to $7.6B. The gross margin remains strong at 62.8%, and the net margin at 17.7% signals solid profitability. Recent years show improved EBIT growth (+20%) and EPS growth (+22%), indicating rising operational efficiency despite flat revenue growth.
Huntington Bancshares Incorporated Analysis
Huntington Bancshares grew revenue by 4.4% to $12.5B in 2025, with net income climbing 10.6% to $2.2B. Its gross margin at 61.7% and net margin at 17.7% mirror U.S. Bancorp’s profitability. EBIT and EPS growth remain healthy, reflecting momentum in cost management and earnings expansion amid moderate revenue gains.
Margin Strength vs. Growth Momentum
U.S. Bancorp boasts larger scale and higher absolute profits, but its net income contraction over five years contrasts with Huntington’s 71% net income surge. Huntington’s faster growth and efficient margin management present a more dynamic profile. Investors seeking growth may prefer Huntington, while those valuing scale and steady margins might lean toward U.S. Bancorp.
Financial Ratios Comparison
These vital ratios act as a diagnostic tool to expose underlying fiscal health, valuation premiums, and capital efficiency for the companies compared below:
| Ratios | U.S. Bancorp (USB) | Huntington Bancshares (HBAN) |
|---|---|---|
| ROE | 11.6% | 9.1% |
| ROIC | 11.1% | -1.7% |
| P/E | 10.95 | 11.61 |
| P/B | 1.27 | 1.05 |
| Current Ratio | 2.73 | 0.10 |
| Quick Ratio | 2.73 | 0.10 |
| D/E | 1.20 | 0.76 |
| Debt-to-Assets | 11.3% | 8.2% |
| Interest Coverage | 0.66 | 0.62 |
| Asset Turnover | 0.062 | 0.055 |
| Fixed Asset Turnover | 11.38 | 9.45 |
| Payout ratio | 41.5% | 41.5% |
| Dividend yield | 3.79% | 3.57% |
| Fiscal Year | 2025 | 2025 |
Efficiency & Valuation Duel: The Vital Signs
Financial ratios act as the company’s DNA, uncovering hidden risks and operational strengths that guide investment decisions.
U.S. Bancorp
U.S. Bancorp exhibits solid profitability with a neutral 11.6% ROE and a favorable 17.7% net margin. Its stock trades at an attractive 10.95 P/E and 1.27 P/B, indicating reasonable valuation. The 3.79% dividend yield underlines a shareholder-friendly policy amid balanced reinvestment.
Huntington Bancshares Incorporated
Huntington delivers a lower 9.1% ROE and comparable 17.7% net margin but faces challenges with a slightly stretched 11.6 P/E. Its 1.05 P/B ratio suggests modest valuation. The 3.57% dividend yield supports returns, though operational efficiencies and reinvestment appear constrained.
Premium Valuation vs. Operational Safety
U.S. Bancorp offers a better balance of valuation and profitability with more favorable ratios. Huntington’s slightly unfavorable operational metrics and tighter liquidity caution investors seeking resilience. U.S. Bancorp suits those prioritizing steady income and measured risk.
Which one offers the Superior Shareholder Reward?
I find U.S. Bancorp (USB) and Huntington Bancshares (HBAN) both pay dividends with similar yields around 3.6% to 4.6%. USB’s dividend yield stands at 3.79% with a 41% payout ratio and a strong buyback program enhancing total returns. HBAN yields slightly lower at 3.57% but maintains a conservative 41% payout ratio. USB’s distribution combines steady dividends with aggressive buybacks, while HBAN leans more on dividends and modest buybacks. USB’s capital allocation better balances shareholder rewards and growth, making its model more sustainable. I conclude USB offers a superior total return profile in 2026 due to its balanced, shareholder-friendly distribution strategy.
Comparative Score Analysis: The Strategic Profile
The radar chart reveals the fundamental DNA and trade-offs of both firms, highlighting their core financial strengths and valuation nuances:
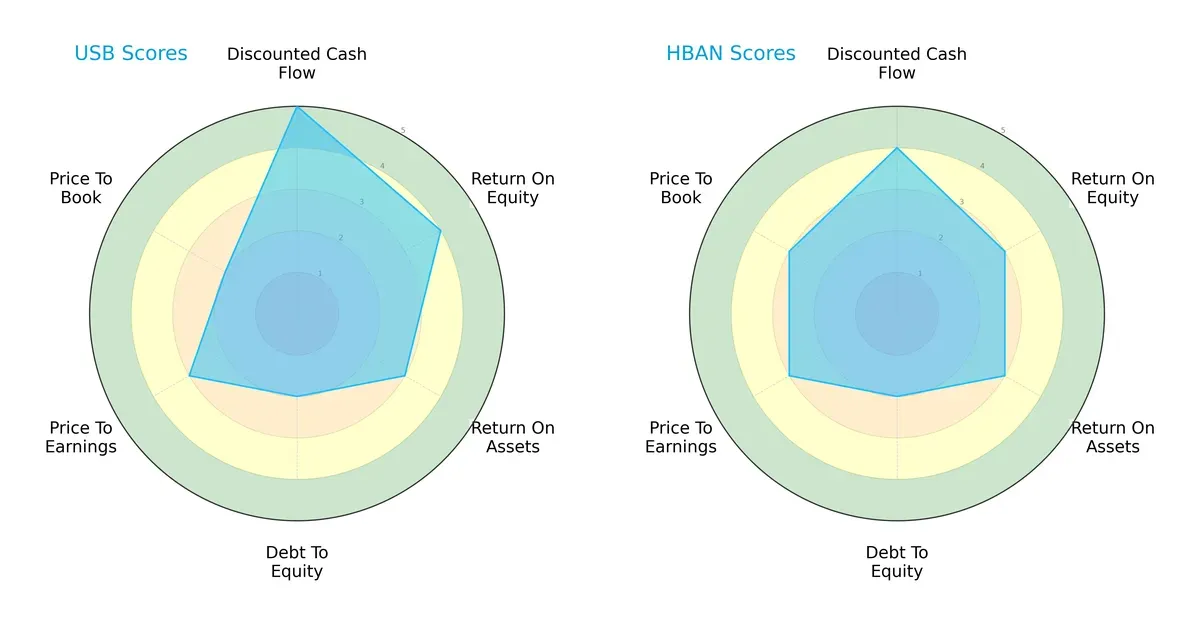
U.S. Bancorp (USB) leads in discounted cash flow (5 vs. 4) and return on equity (4 vs. 3), indicating stronger profitability and cash flow discipline. Both firms share average return on assets (3) and debt-to-equity (2), signaling comparable asset use and leverage risk. Huntington Bancshares (HBAN) holds a slight edge in price-to-book (3 vs. 2), suggesting relatively better valuation support. USB presents a more balanced profile with clear cash flow and equity returns advantages, while HBAN relies more on valuation metrics.
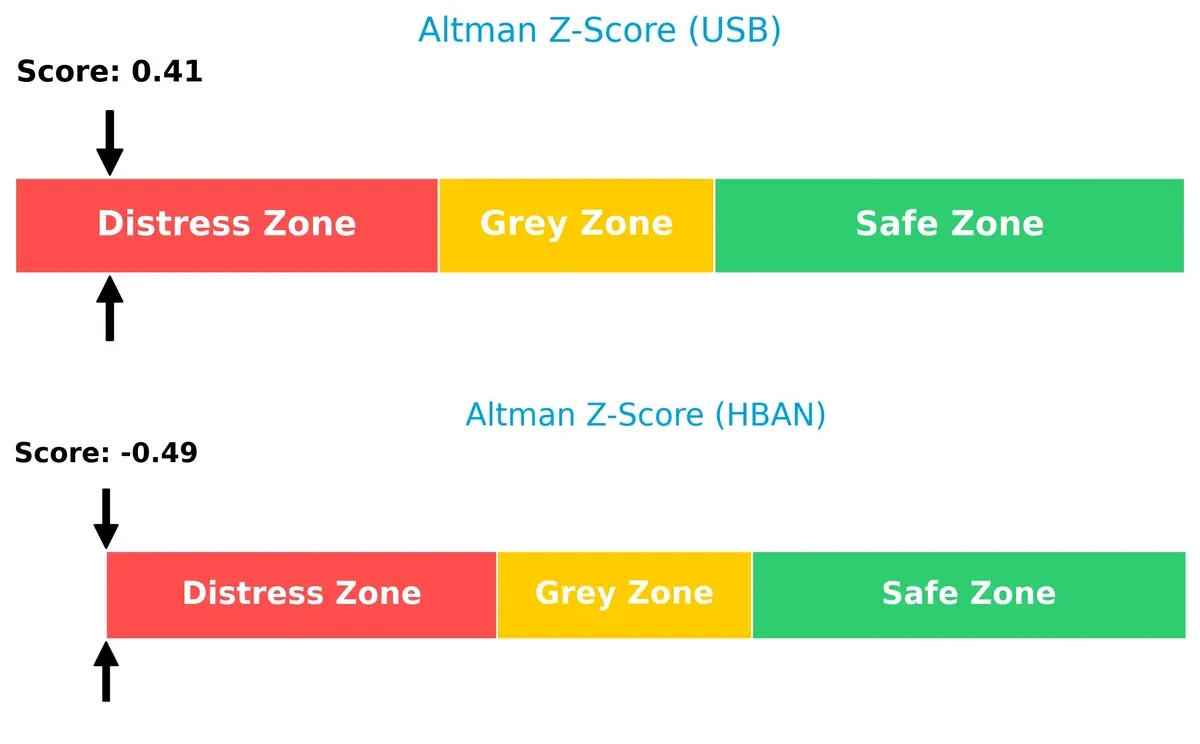
Bankruptcy Risk: Solvency Showdown
USB’s Altman Z-Score of 0.41 slightly outperforms HBAN’s -0.49, yet both remain deep in the distress zone, signaling heightened bankruptcy risk in this cycle:
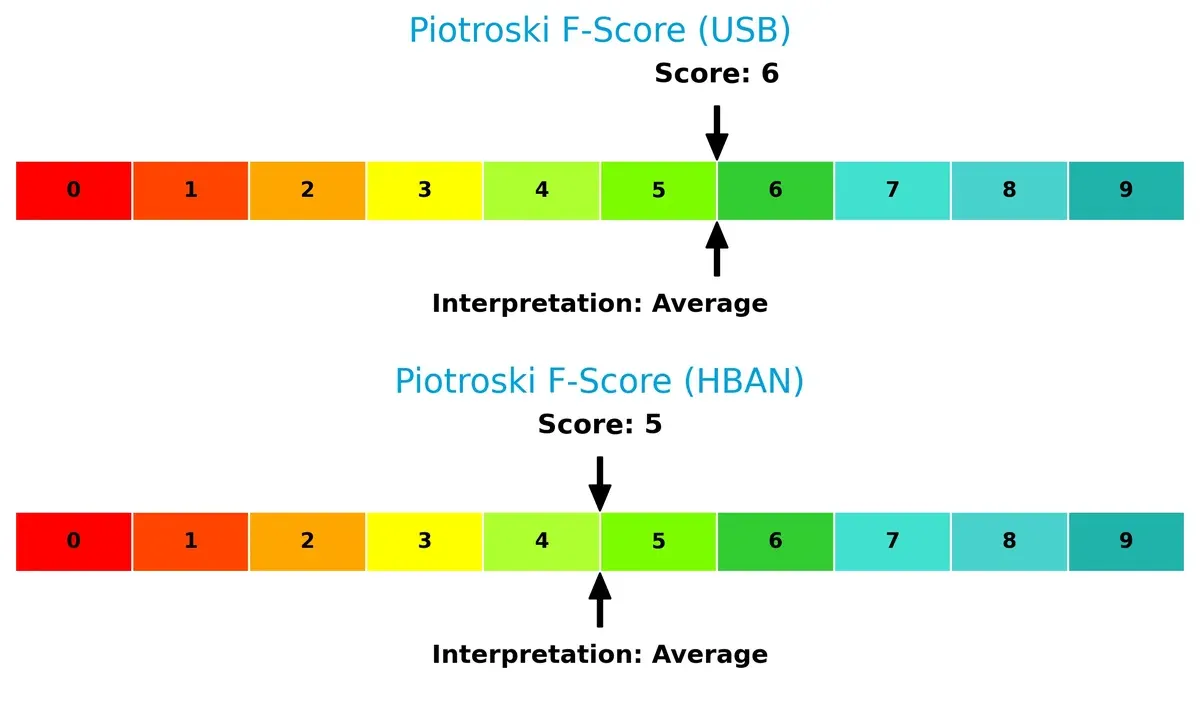
Financial Health: Quality of Operations
USB scores 6 on the Piotroski F-Score, just above HBAN’s 5, suggesting marginally stronger internal financial health; neither company, however, reaches peak quality thresholds:
How are the two companies positioned?
This section dissects the operational DNA of U.S. Bancorp and Huntington Bancshares by comparing their revenue distribution and internal dynamics. The goal is to confront their economic moats and identify which model offers the most resilient, sustainable competitive advantage today.
Revenue Segmentation: The Strategic Mix
This visual comparison dissects how U.S. Bancorp and Huntington Bancshares diversify their income streams and where their primary sector bets lie:
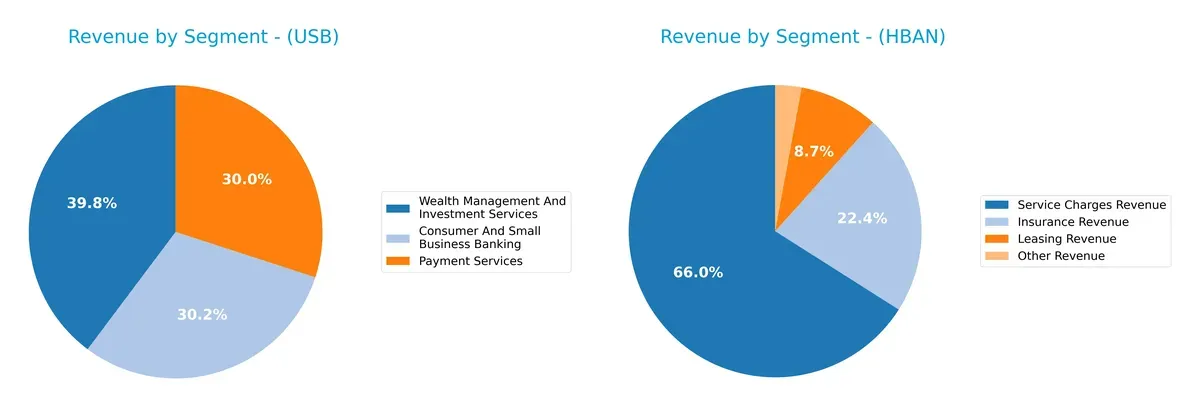
U.S. Bancorp anchors its revenue on Wealth Management and Payment Services, generating $12.2B and $9.2B respectively in 2024. Consumer and Small Business Banking closely follows at $9.3B, showcasing a well-balanced portfolio. Huntington Bancshares pivots on Service Charges ($227M) and Cards & Payment Processing, but with a far narrower scope. USB’s diversification reduces risk and signals ecosystem lock-in, while HBAN’s concentration highlights vulnerability to sector shifts.
Strengths and Weaknesses Comparison
This table compares the strengths and weaknesses of U.S. Bancorp and Huntington Bancshares Incorporated:
U.S. Bancorp Strengths
- Diversified revenue streams with strong Wealth Management and Payment Services
- Favorable net margin at 17.68%
- Solid current and quick ratios at 2.73
- Favorable price-to-earnings at 10.95
- Competitive dividend yield of 3.79%
- Favorable debt-to-assets ratio at 11.26%
Huntington Bancshares Incorporated Strengths
- Favorable net margin at 17.71%
- Favorable price-to-earnings at 11.61
- Favorable price-to-book at 1.05
- Favorable dividend yield of 3.57%
- Favorable debt-to-assets ratio at 8.21%
- Presence in cards and payment processing revenue
U.S. Bancorp Weaknesses
- Unfavorable return on invested capital (11.14% below WACC 11.59%)
- Elevated debt-to-equity ratio at 1.2
- Weak interest coverage at 0.66
- Low asset turnover of 0.06
Huntington Bancshares Incorporated Weaknesses
- Negative return on invested capital (-1.69%)
- Unfavorable return on equity at 9.08%
- Very low liquidity ratios at 0.1 (current and quick)
- Unfavorable WACC at 12.76%
- Interest coverage weak at 0.62
- Unfavorable asset turnover at 0.06
U.S. Bancorp demonstrates broader diversification and stronger liquidity metrics, supporting resilience. Huntington shows pockets of profitability but suffers from liquidity and capital efficiency challenges, impacting strategic flexibility.
The Moat Duel: Analyzing Competitive Defensibility
A structural moat is the only defense preserving long-term profits from relentless competition erosion. Let’s dissect the competitive moats of two regional banks:
U.S. Bancorp: Efficiency and Scale Lock-In
U.S. Bancorp’s moat stems from cost advantages and operational scale, reflected in rising ROIC despite current value destruction. Its diversified services and digital expansion could deepen this edge in 2026.
Huntington Bancshares: Struggling Value Creation Amid Competition
Huntington relies on traditional regional banking scale but suffers from declining ROIC and value destruction, unlike U.S. Bancorp’s improving profitability. Its opportunity lies in niche commercial lending growth or digital innovation.
Scale Efficiency vs. Traditional Regional Footprint
U.S. Bancorp possesses a wider, more durable moat, supported by improving capital returns and scale advantages. Huntington’s shrinking profitability signals weaker moat defense, leaving U.S. Bancorp better positioned to protect market share going forward.
Which stock offers better returns?
Over the past 12 months, both U.S. Bancorp and Huntington Bancshares show strong price appreciation with accelerating bullish trends and rising trading volumes.
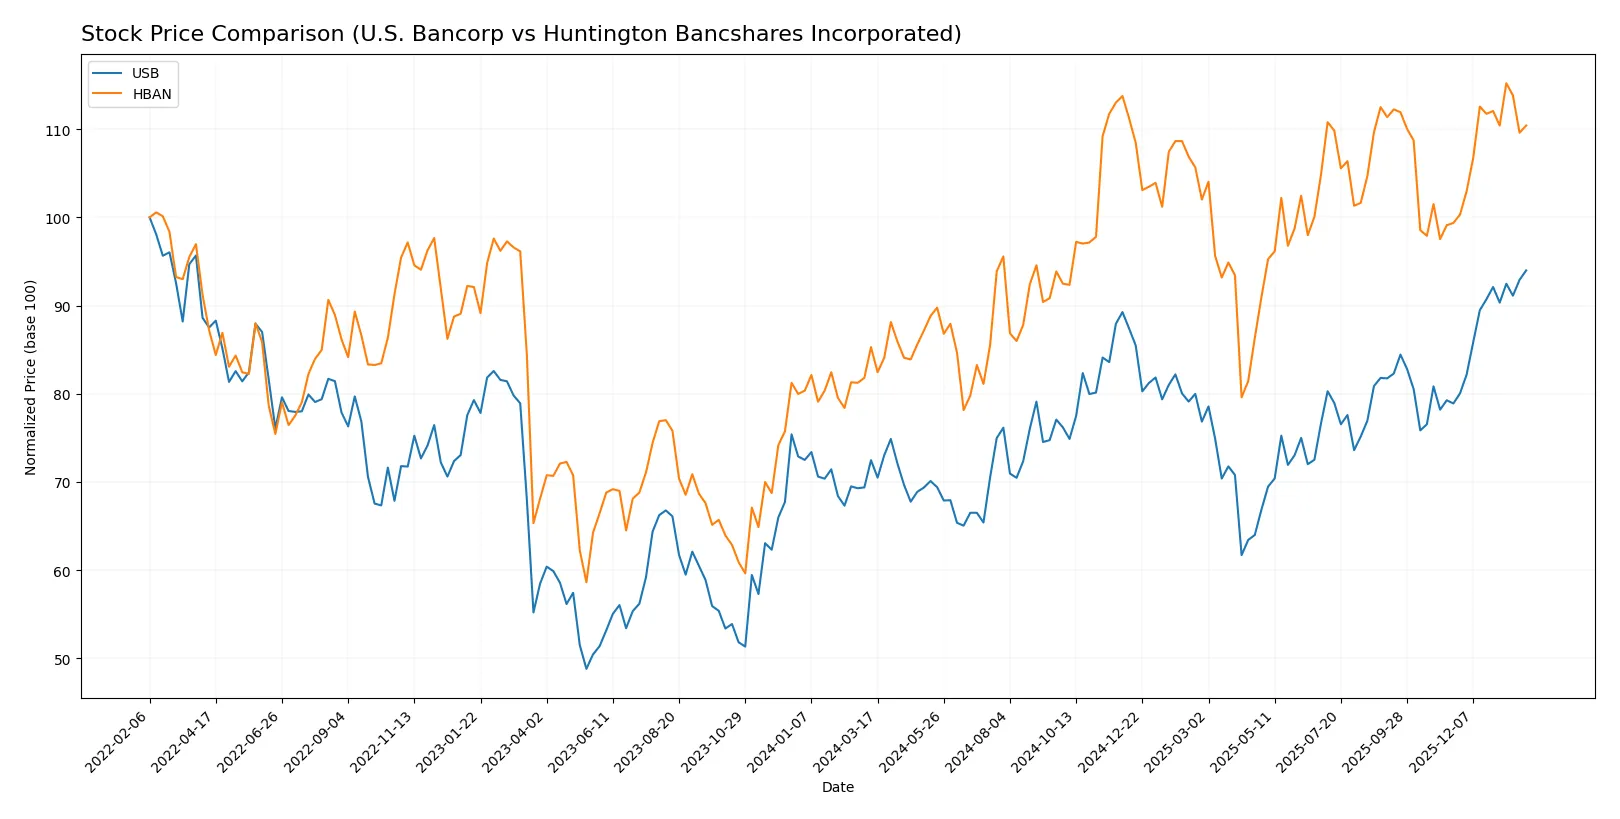
Trend Comparison
U.S. Bancorp’s stock rose 29.7% over the past year with accelerating momentum and a high volatility of 4.33, hitting a peak at 56.11 and a low of 36.83.
Huntington Bancshares gained 29.48% in the same period, also accelerating but with lower volatility at 1.59, reaching a high of 18.24 and a low of 12.37.
Both stocks exhibit bullish trends with volume increases, but U.S. Bancorp’s higher return and stronger recent momentum slightly edge out Huntington Bancshares.
Target Prices
Analysts show a constructive outlook for U.S. Bancorp and Huntington Bancshares with clearly defined target ranges.
| Company | Target Low | Target High | Consensus |
|---|---|---|---|
| U.S. Bancorp | 50 | 65 | 58.13 |
| Huntington Bancshares Incorporated | 16 | 23 | 20 |
For U.S. Bancorp, the consensus target of 58.13 slightly exceeds the current price of 56.11, signaling modest upside potential. Huntington Bancshares’ target consensus of 20 also suggests room for growth above its current 17.48 price.

Don’t Let Luck Decide Your Entry Point
Optimize your entry points with our advanced ProRealTime indicators. You’ll get efficient buy signals with precise price targets for maximum performance. Start outperforming now!
How do institutions grade them?
The following tables summarize recent institutional grades for U.S. Bancorp and Huntington Bancshares Incorporated:
U.S. Bancorp Grades
This table lists recent grades assigned by reputable equity research firms to U.S. Bancorp shares.
| Grading Company | Action | New Grade | Date |
|---|---|---|---|
| Argus Research | Maintain | Buy | 2026-01-22 |
| DA Davidson | Maintain | Buy | 2026-01-21 |
| Keefe, Bruyette & Woods | Maintain | Market Perform | 2026-01-21 |
| Truist Securities | Maintain | Hold | 2026-01-21 |
| TD Cowen | Maintain | Buy | 2026-01-21 |
| RBC Capital | Maintain | Outperform | 2026-01-21 |
| Oppenheimer | Maintain | Outperform | 2026-01-21 |
| TD Cowen | Maintain | Buy | 2026-01-07 |
| Wolfe Research | Downgrade | Peer Perform | 2026-01-07 |
| Barclays | Maintain | Overweight | 2026-01-05 |
Huntington Bancshares Incorporated Grades
This table shows recent grade updates from respected financial analysts for Huntington Bancshares Incorporated.
| Grading Company | Action | New Grade | Date |
|---|---|---|---|
| Truist Securities | Maintain | Buy | 2026-01-26 |
| Morgan Stanley | Maintain | Overweight | 2026-01-23 |
| Keefe, Bruyette & Woods | Maintain | Market Perform | 2026-01-23 |
| Barclays | Maintain | Equal Weight | 2026-01-05 |
| RBC Capital | Maintain | Outperform | 2025-12-19 |
| Piper Sandler | Maintain | Underweight | 2025-12-10 |
| DA Davidson | Maintain | Buy | 2025-10-28 |
| Keefe, Bruyette & Woods | Maintain | Market Perform | 2025-10-20 |
| Raymond James | Maintain | Strong Buy | 2025-10-20 |
| TD Cowen | Maintain | Buy | 2025-10-20 |
Which company has the best grades?
U.S. Bancorp receives predominantly “Buy” and “Outperform” ratings, with only one downgrade. Huntington Bancshares shows a broader range including a “Strong Buy” but also an “Underweight.” U.S. Bancorp’s consistently positive grades suggest stronger institutional confidence, impacting investor sentiment and risk perceptions.
Risks specific to each company
The following categories identify the critical pressure points and systemic threats facing both firms in the 2026 market environment:
1. Market & Competition
U.S. Bancorp
- Larger market cap of $87B supports stronger competitive positioning.
- Operates with a higher beta (1.09), indicating more sensitivity to market swings.
Huntington Bancshares Incorporated
- Smaller $27.5B market cap limits scale advantage.
- Lower beta (0.97) suggests slightly less volatility in competitive pressures.
2. Capital Structure & Debt
U.S. Bancorp
- Debt-to-equity ratio of 1.2 signals a leveraged balance sheet, a moderate risk in rising rate environments.
- Interest coverage ratio of 0.66 is weak, raising concerns about debt servicing ability.
Huntington Bancshares Incorporated
- Debt-to-equity ratio of 0.76 reflects more conservative leverage, enhancing financial flexibility.
- Interest coverage at 0.62 is similarly low, indicating vulnerability to interest rate hikes.
3. Stock Volatility
U.S. Bancorp
- Beta of 1.09 implies stock price likely to fluctuate more than the market.
Huntington Bancshares Incorporated
- Beta of 0.97 suggests less price volatility relative to the overall market.
4. Regulatory & Legal
U.S. Bancorp
- Larger scale may attract increased regulatory scrutiny and compliance costs.
Huntington Bancshares Incorporated
- Smaller footprint reduces regulatory burden but limits market influence.
5. Supply Chain & Operations
U.S. Bancorp
- Extensive branch network (2,230 locations) and 4,059 ATMs offer distribution resilience.
Huntington Bancshares Incorporated
- Approximately 1,000 branches concentrated in 11 states, less diversified geographically.
6. ESG & Climate Transition
U.S. Bancorp
- Larger institution likely faces higher ESG expectations and transition risks.
Huntington Bancshares Incorporated
- Smaller scale potentially offers more agility in adapting ESG strategies.
7. Geopolitical Exposure
U.S. Bancorp
- Operations focused in Midwest and West US regions, relatively lower geopolitical risk.
Huntington Bancshares Incorporated
- Concentrated in the Midwest with regional economic exposure, similar geopolitical profile.
Which company shows a better risk-adjusted profile?
U.S. Bancorp faces significant leverage and interest coverage risks but benefits from scale and market presence. Huntington Bancshares shows weaker liquidity ratios and negative ROIC but maintains lower leverage and volatility. Both are in financial distress per Altman Z-scores, yet USB’s stronger capital base and favorable global ratios suggest a marginally better risk-adjusted position. Recent data highlight USB’s challenging interest coverage as a key vulnerability to monitor closely.
Final Verdict: Which stock to choose?
U.S. Bancorp’s superpower lies in its robust liquidity and steady income generation, making it a reliable cash machine in banking. Its point of vigilance is the slightly unfavorable capital return versus cost of capital, signaling cautious capital allocation. It fits well in portfolios seeking consistent income with moderate growth.
Huntington Bancshares boasts a strategic moat through solid gross margins and a strong expansion in revenue and earnings, reflecting effective operational leverage. It offers a slightly riskier profile than U.S. Bancorp due to weaker capital efficiency and liquidity. It suits investors focused on growth at a reasonable price with some volatility tolerance.
If you prioritize stable income and financial resilience, U.S. Bancorp is the compelling choice due to its superior liquidity and favorable valuation metrics. However, if you seek growth potential and are willing to accept higher risk, Huntington Bancshares offers better earnings expansion despite its weaker moat. Both present analytical scenarios aligned with distinct investor profiles.
Disclaimer: Investment carries a risk of loss of initial capital. The past performance is not a reliable indicator of future results. Be sure to understand risks before making an investment decision.
Go Further
I encourage you to read the complete analyses of U.S. Bancorp and Huntington Bancshares Incorporated to enhance your investment decisions: