Home > Comparison > Financial Services > TFC vs HBAN
The strategic rivalry between Truist Financial Corporation and Huntington Bancshares Incorporated defines the regional banking landscape in the U.S. Truist operates a diversified, multi-segment financial services model with a broad geographic footprint. Huntington focuses on regional commercial and consumer banking with targeted niche services like vehicle finance. This head-to-head pits scale and diversification against focused market penetration. This analysis aims to identify which corporate trajectory offers superior risk-adjusted returns for a diversified portfolio in financial services.

Table of contents
Companies Overview
Truist Financial Corporation and Huntington Bancshares Incorporated stand as key players in the regional banking industry.
Truist Financial Corporation: Southeastern Banking Powerhouse
Truist Financial Corporation dominates the Southeastern and Mid-Atlantic US banking sector. Its core revenue arises from a diversified mix of consumer banking, commercial banking, and insurance services. In 2021, Truist focused strategically on expanding its digital banking capabilities and deepening wealth management offerings across 2,517 branches.
Huntington Bancshares Incorporated: Midwest Regional Bank Specialist
Huntington Bancshares serves the Midwest with a business model rooted in consumer, commercial, and vehicle finance banking. Revenue streams also include wealth management and treasury services. By 2022, Huntington emphasized growth in specialty commercial banking and private client services through approximately 1,000 branches across 11 states.
Strategic Collision: Similarities & Divergences
Both banks operate as regional financial services leaders but differ in scale and geographic focus. Truist pursues a broad, integrated banking and insurance strategy, while Huntington leans on specialized vehicle finance and niche commercial segments. Their primary competition unfolds in retail and commercial lending markets. Investors face distinct risk profiles: Truist’s vast footprint contrasts with Huntington’s targeted regional expertise.
Income Statement Comparison
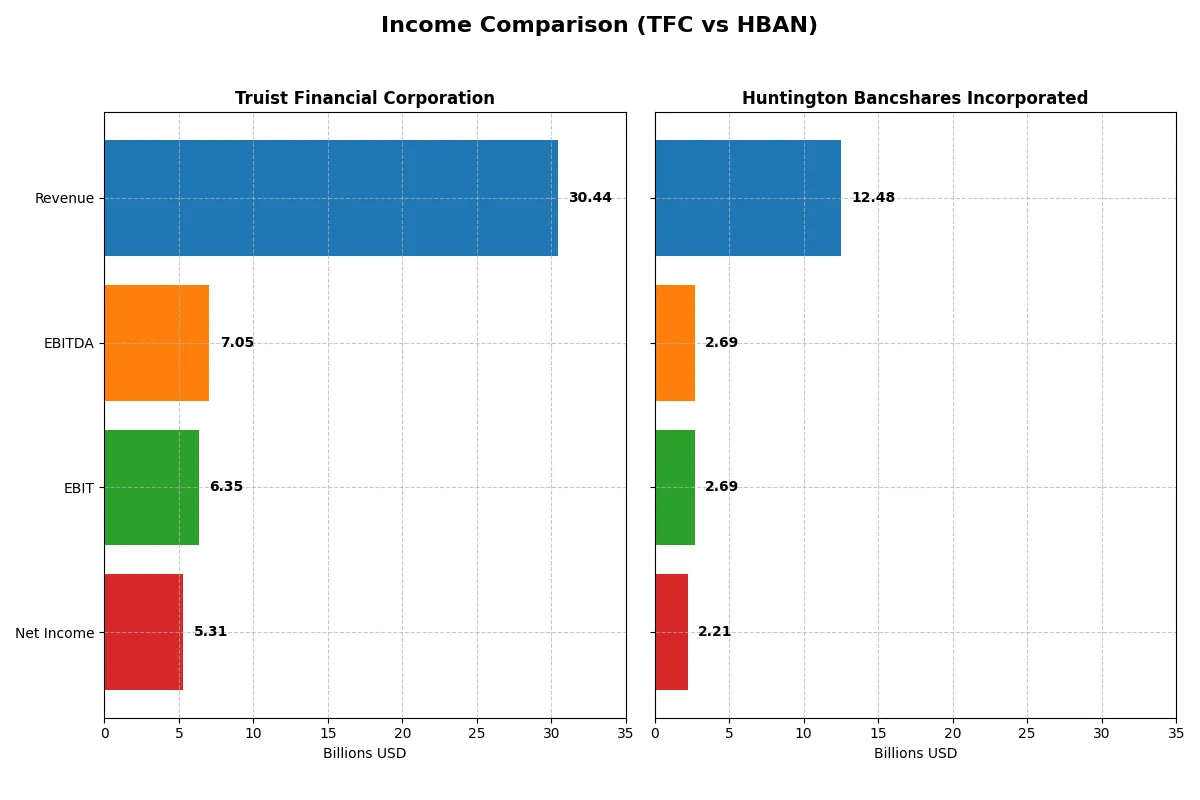
This data dissects the core profitability and scalability of both corporate engines to reveal who dominates the bottom line:
| Metric | Truist Financial Corporation (TFC) | Huntington Bancshares Incorporated (HBAN) |
|---|---|---|
| Revenue | 30.4B | 12.5B |
| Cost of Revenue | 11.5B | 4.8B |
| Operating Expenses | 12.6B | 5.0B |
| Gross Profit | 18.9B | 7.7B |
| EBITDA | 7.1B | 2.7B |
| EBIT | 6.3B | 2.7B |
| Interest Expense | 10.1B | 4.3B |
| Net Income | 5.3B | 2.2B |
| EPS | 3.86 | 1.41 |
| Fiscal Year | 2025 | 2025 |
Income Statement Analysis: The Bottom-Line Duel
This income statement comparison exposes how Truist and Huntington convert revenue into profits, revealing their operational efficiency and growth trajectories.
Truist Financial Corporation Analysis
Truist’s revenue surged 25.5% to $30.4B in 2025, with net income edging up to $5.3B despite a 12% net margin decline. Its gross margin remains robust at 62.2%, and EBIT margin rebounded strongly to 20.9%, signaling improved operating efficiency after past volatility. Interest expense at 33.2% of revenue weighs on profitability.
Huntington Bancshares Incorporated Analysis
Huntington posted moderate revenue growth of 4.4% to $12.5B in 2025, boosting net income by 13.9% to $2.2B. The bank maintains a solid gross margin of 61.7% and a healthy EBIT margin of 21.5%. Although interest expense is slightly higher at 34.6%, consistent margin expansion and steady EPS growth reflect disciplined cost control.
Margin Resilience vs. Revenue Expansion
Truist leads with scale and a sharp recent EBIT turnaround, yet its net margin contraction and elevated interest costs temper enthusiasm. Huntington’s steadier revenue growth and margin improvement paint a picture of consistent profit generation. For investors, Truist’s profile suits those prioritizing scale-driven momentum; Huntington appeals to those valuing steady margin resilience and earnings growth.
Financial Ratios Comparison
These vital ratios act as a diagnostic tool to expose the underlying fiscal health, valuation premiums, and capital efficiency of the companies:
| Ratios | Truist Financial Corporation (TFC) | Huntington Bancshares Incorporated (HBAN) |
|---|---|---|
| ROE | 8.14% | 9.08% |
| ROIC | 3.61% | -1.69% |
| P/E | 11.75 | 11.61 |
| P/B | 0.96 | 1.05 |
| Current Ratio | 0.87 | 0.10 |
| Quick Ratio | 0.87 | 0.10 |
| D/E | 1.07 | 0.76 |
| Debt-to-Assets | 12.75% | 8.21% |
| Interest Coverage | 0.63 | 0.62 |
| Asset Turnover | 0.056 | 0.055 |
| Fixed Asset Turnover | 9.60 | 9.45 |
| Payout ratio | 49.7% | 41.5% |
| Dividend yield | 4.23% | 3.57% |
| Fiscal Year | 2025 | 2025 |
Efficiency & Valuation Duel: The Vital Signs
Financial ratios act as the company’s DNA, uncovering hidden risks and operational excellence that shape investment decisions.
Truist Financial Corporation
Truist shows modest profitability with an 8.14% ROE and a solid 17.44% net margin, signaling operational efficiency. Its P/E of 11.75 and P/B under 1 suggest the stock is attractively valued, not stretched. A 4.23% dividend yield rewards shareholders, reflecting a balanced approach between income and reinvestment.
Huntington Bancshares Incorporated
Huntington posts a slightly higher 9.08% ROE and a 17.71% net margin, indicating efficient core operations. Its valuation remains reasonable with an 11.61 P/E and a P/B near 1. The 3.57% dividend yield provides steady return, although a negative ROIC signals potential capital allocation challenges that investors should monitor.
Balanced Valuation Meets Operational Reality
Truist offers a more favorable dividend yield and solid valuation with neutral overall ratio scores, while Huntington’s slightly better profitability contrasts with weaker capital efficiency. Investors prioritizing income and valuation stability may lean toward Truist; those focused on marginally higher returns but aware of risks might consider Huntington.
Which one offers the Superior Shareholder Reward?
I compare Truist Financial Corporation (TFC) and Huntington Bancshares (HBAN) on dividend yield, payout ratio, and buyback intensity. TFC yields 4.23% with a 49.7% payout ratio, while HBAN yields 3.57% with a 41.5% payout ratio in 2025. TFC’s higher yield and moderate payout indicate robust free cash flow coverage, supporting sustainable dividends. Both companies pursue buybacks, but TFC’s larger market cap and stronger capital allocation suggest more aggressive repurchases. HBAN’s lower payout ratio and consistent dividend growth show prudence but less immediate yield. I see TFC’s balance of yield and buybacks as offering superior total shareholder return and long-term value in 2026.
Comparative Score Analysis: The Strategic Profile
The radar chart reveals the fundamental DNA and trade-offs of Truist Financial Corporation and Huntington Bancshares Incorporated:
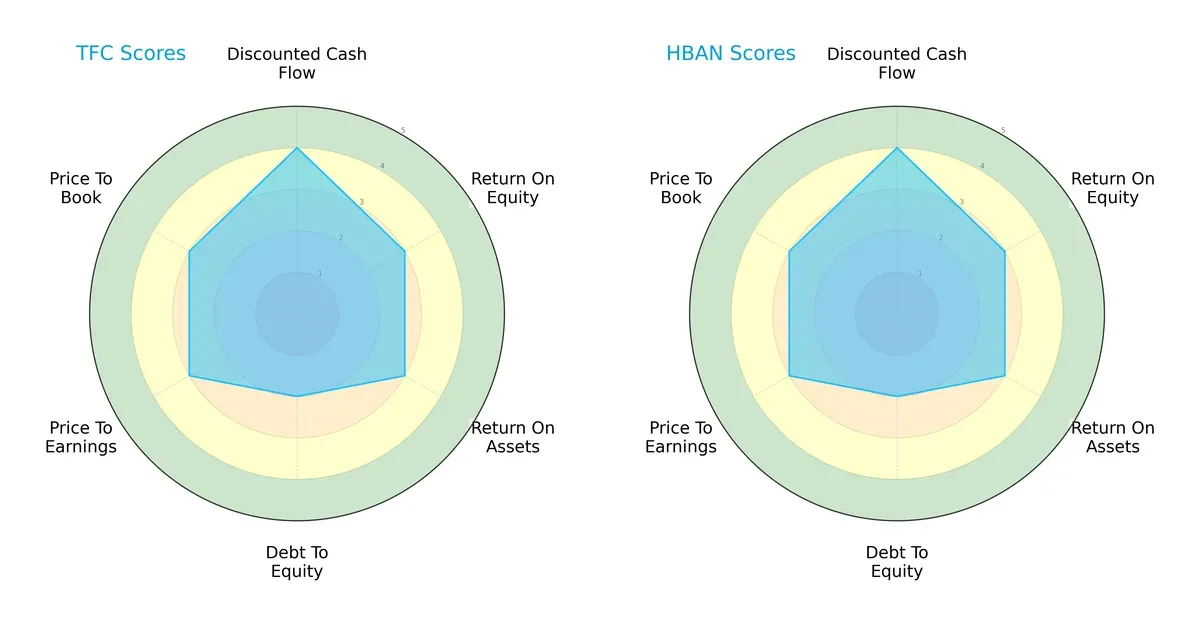
Both firms share identical scores across DCF, ROE, ROA, Debt/Equity, and valuation metrics, indicating similar strategic profiles. Each shows moderate efficiency in equity and asset utilization, with a favorable discounted cash flow outlook. Neither company exhibits a distinct competitive edge; rather, they rely on balanced financial discipline and valuation. This parity suggests investors should weigh external factors beyond these scores when choosing between them.
Bankruptcy Risk: Solvency Showdown
Truist’s Altman Z-Score slightly exceeds Huntington’s, yet both remain deep in the distress zone, signaling elevated bankruptcy risk in this cycle:
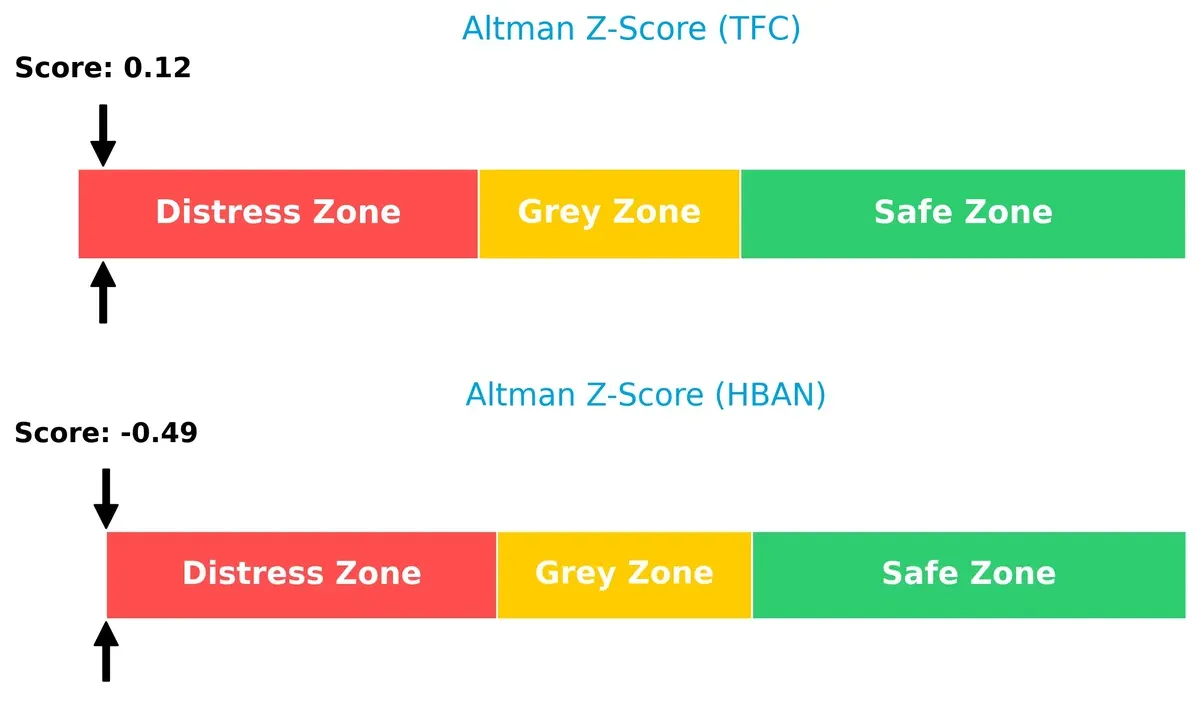
This implies significant financial vulnerability for both. Historically, firms in this zone face urgent restructuring or capital infusion. Investors must treat these scores as red flags, emphasizing caution despite other stable metrics.
Financial Health: Quality of Operations
Truist outperforms Huntington with a Piotroski F-Score of 7 versus 5, reflecting stronger internal financial health and operational quality:
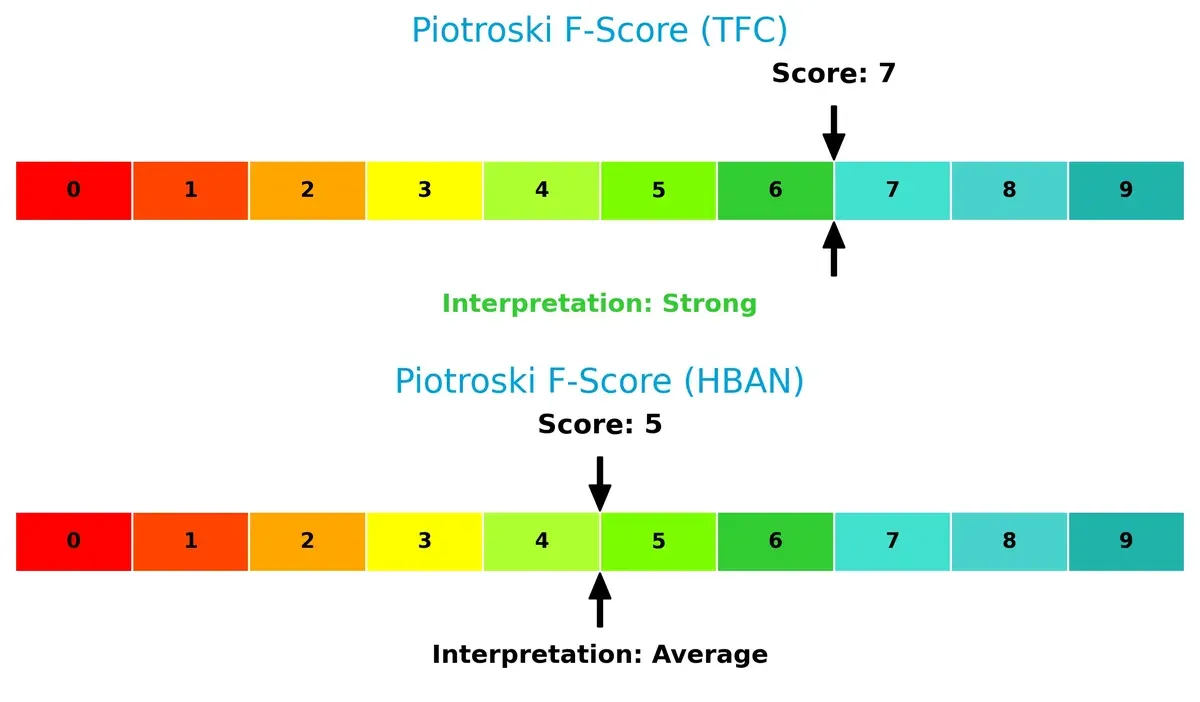
A score of 7 indicates robust profitability, liquidity, and efficiency, while 5 suggests Huntington’s internal metrics warrant closer scrutiny. Truist demonstrates fewer red flags, making it the comparatively healthier choice from a financial quality standpoint.
How are the two companies positioned?
This section dissects the operational DNA of Truist Financial Corporation and Huntington Bancshares by comparing their revenue distribution by segment and internal dynamics. The goal is to confront their economic moats to identify which model offers the most resilient and sustainable competitive advantage in today’s market.
Revenue Segmentation: The Strategic Mix
This visual comparison dissects how Truist Financial Corporation and Huntington Bancshares diversify income streams and where their primary sector bets lie:
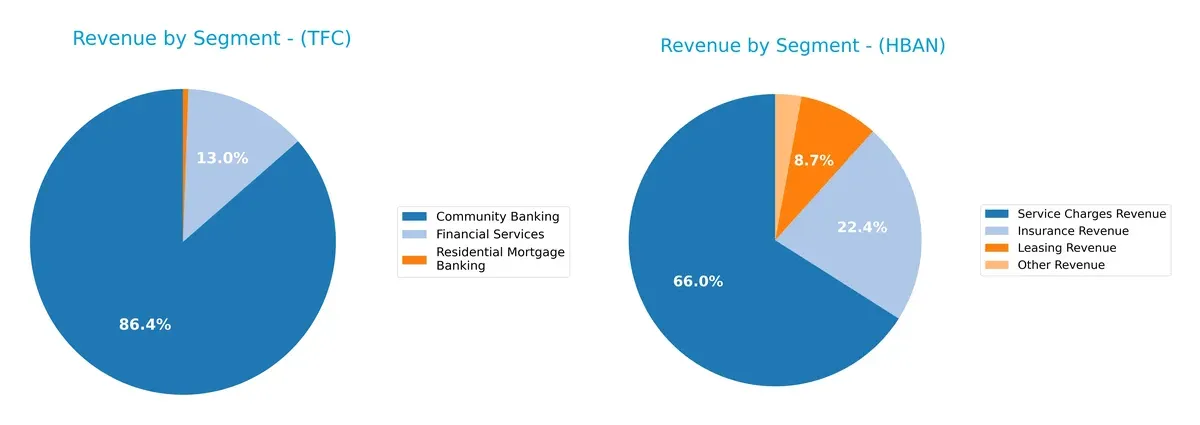
Truist Financial anchors its revenue predominantly in Community Banking with $153B in 2016, showing a concentrated income mix. Huntington Bancshares, by contrast, displays a more diversified portfolio with key streams: Service Charges at $227B, Insurance at $77B, and Leasing at $30B in 2024. Truist’s concentration risks contrast with Huntington’s strategic spread, which pivots on ecosystem lock-in through multiple fee-based services.
Strengths and Weaknesses Comparison
This table compares the strengths and weaknesses of Truist Financial Corporation and Huntington Bancshares Incorporated:
TFC Strengths
- Favorable net margin at 17.44%
- Attractive PE ratio at 11.75
- Strong fixed asset turnover at 9.6
- Solid dividend yield of 4.23%
- Favorable debt-to-assets ratio at 12.75%
HBAN Strengths
- Slightly higher net margin at 17.71%
- Favorable PE ratio at 11.61
- Strong fixed asset turnover at 9.45
- Favorable dividend yield at 3.57%
- Lower debt-to-assets ratio at 8.21%
TFC Weaknesses
- Unfavorable ROE at 8.14% below WACC
- Current ratio under 1 at 0.87
- High debt-to-equity at 1.07
- Low interest coverage at 0.63
- Negative asset turnover at 0.06
- Limited diversification with no dealer or insurance services
HBAN Weaknesses
- Negative ROIC at -1.69%
- WACC above ROE at 12.76%
- Very low current and quick ratios at 0.1
- Interest coverage low at 0.62
- Asset turnover low at 0.06
- Concentrated revenue in cards, service charges, and trust services
Both companies show strong profitability metrics but face challenges in returns on invested capital and liquidity ratios. Their financial structures suggest caution in debt management and operational efficiency, shaping strategic priorities around improving capital returns and diversifying revenue streams.
The Moat Duel: Analyzing Competitive Defensibility
A structural moat is the only shield preserving long-term profits from relentless competitive erosion. Let’s dissect how these two banks defend their turf:
Truist Financial Corporation: Intangible Assets Moat
Truist leans on its broad service portfolio and regional footprint, reflected in stable margins despite rising interest costs. Its 2026 outlook hinges on digital innovation to deepen client loyalty and fend off disruptors.
Huntington Bancshares Incorporated: Cost Advantage Moat
Huntington’s moat roots in operational efficiency and focused regional banking, delivering solid revenue and EPS growth. Its challenge is scaling profitably while expanding in competitive Midwestern markets in 2026.
Market Penetration vs. Operational Efficiency: Which Moat Holds Stronger?
Both firms shed value with declining ROIC trends, signaling weakening moats. Yet, Truist’s intangible assets offer a wider moat than Huntington’s cost focus. Truist better equips itself to defend market share amid rising competition.
Which stock offers better returns?
Over the past year, both Truist Financial Corporation and Huntington Bancshares delivered strong gains, with notable price acceleration and distinct trading volume dynamics.
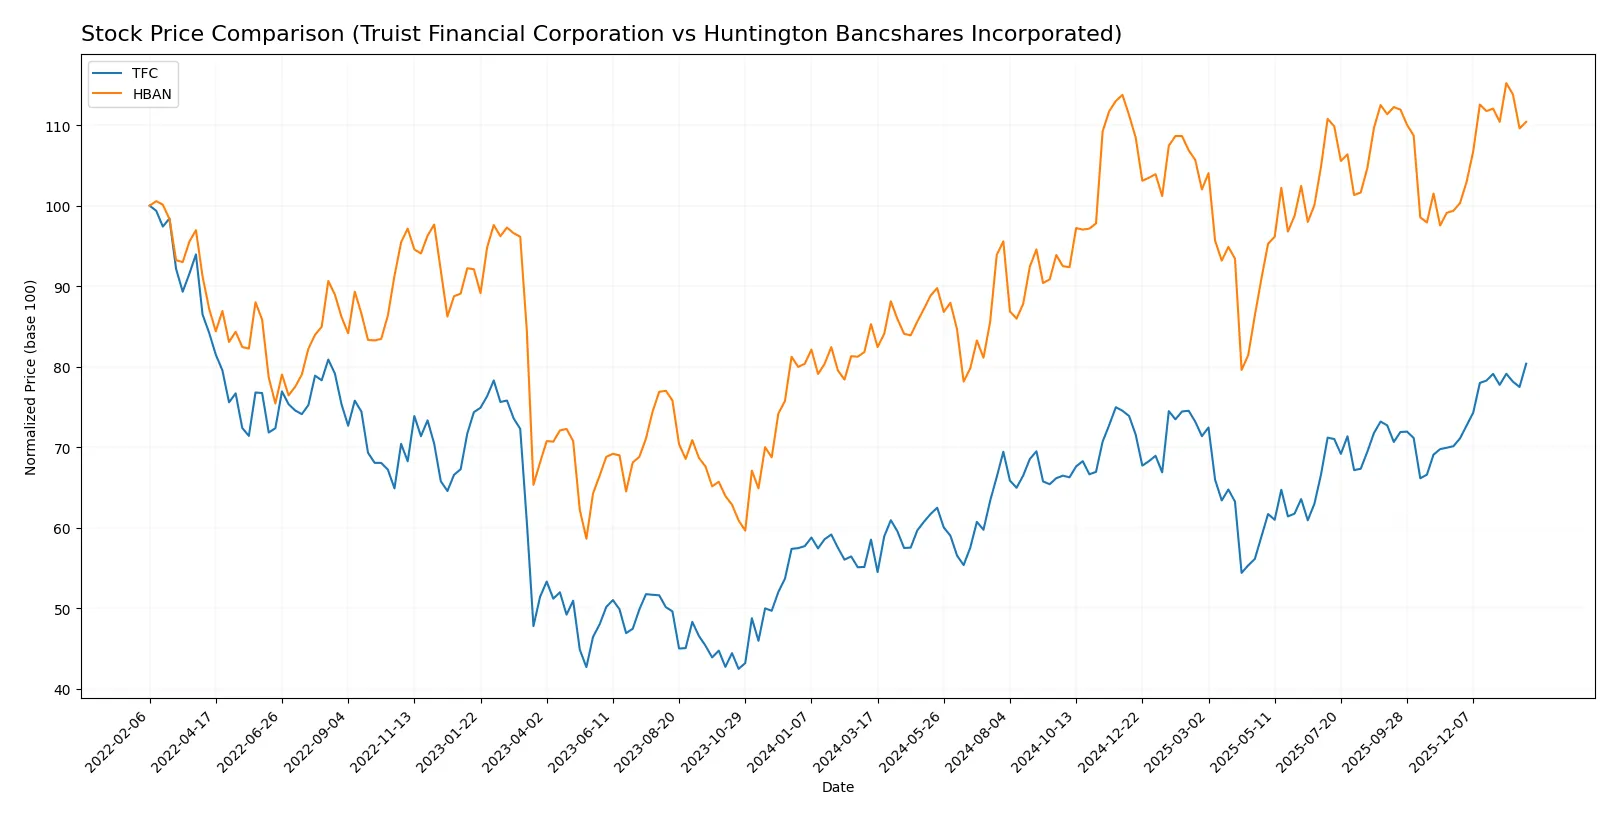
Trend Comparison
Truist Financial Corporation’s stock rose 37.34% over the last 12 months, showing a bullish trend with accelerating momentum and a high volatility of 4.03%. Its price ranged from 34.79 to 51.42.
Huntington Bancshares’ stock increased 29.48% in the same period, also bullish with acceleration but lower volatility at 1.59%. The price moved between 12.37 and 18.24.
Truist outperformed Huntington by nearly 8 percentage points, delivering the stronger market performance with higher volatility and more pronounced acceleration.
Target Prices
Analysts present a clear target price consensus for Truist Financial Corporation and Huntington Bancshares Incorporated.
| Company | Target Low | Target High | Consensus |
|---|---|---|---|
| Truist Financial Corporation | 50 | 58 | 54.38 |
| Huntington Bancshares Incorporated | 16 | 23 | 20 |
The consensus target prices indicate moderate upside potential for both banks. Truist’s consensus is roughly 6% above its current price, while Huntington’s target suggests about 14% upside.

Don’t Let Luck Decide Your Entry Point
Optimize your entry points with our advanced ProRealTime indicators. You’ll get efficient buy signals with precise price targets for maximum performance. Start outperforming now!
How do institutions grade them?
Institutional grades provide a snapshot of expert opinions on the two companies’ investment potential:
Truist Financial Corporation Grades
Below is a summary of recent institutional grades for Truist Financial Corporation:
| Grading Company | Action | New Grade | Date |
|---|---|---|---|
| Argus Research | Maintain | Buy | 2026-01-23 |
| Piper Sandler | Maintain | Neutral | 2026-01-22 |
| TD Cowen | Maintain | Buy | 2026-01-22 |
| TD Cowen | Maintain | Buy | 2026-01-07 |
| Raymond James | Maintain | Outperform | 2026-01-07 |
| Evercore ISI Group | Upgrade | Outperform | 2026-01-06 |
| Barclays | Downgrade | Underweight | 2026-01-05 |
| Citigroup | Maintain | Buy | 2025-12-31 |
| Keefe, Bruyette & Woods | Maintain | Market Perform | 2025-12-17 |
| Morgan Stanley | Maintain | Equal Weight | 2025-12-17 |
Huntington Bancshares Incorporated Grades
Below is a summary of recent institutional grades for Huntington Bancshares Incorporated:
| Grading Company | Action | New Grade | Date |
|---|---|---|---|
| Truist Securities | Maintain | Buy | 2026-01-26 |
| Morgan Stanley | Maintain | Overweight | 2026-01-23 |
| Keefe, Bruyette & Woods | Maintain | Market Perform | 2026-01-23 |
| Barclays | Maintain | Equal Weight | 2026-01-05 |
| RBC Capital | Maintain | Outperform | 2025-12-19 |
| Piper Sandler | Maintain | Underweight | 2025-12-10 |
| DA Davidson | Maintain | Buy | 2025-10-28 |
| Keefe, Bruyette & Woods | Maintain | Market Perform | 2025-10-20 |
| Raymond James | Maintain | Strong Buy | 2025-10-20 |
| TD Cowen | Maintain | Buy | 2025-10-20 |
Which company has the best grades?
Huntington Bancshares holds a slight edge with multiple strong buy and overweight ratings. Truist shows more mixed signals, including a recent downgrade. Investors may weigh Huntington’s stronger bullish sentiment against Truist’s broader grade dispersion.
Risks specific to each company
The following categories identify critical pressure points and systemic threats facing Truist Financial Corporation and Huntington Bancshares Incorporated in the 2026 market environment:
1. Market & Competition
Truist Financial Corporation
- Large regional presence in Southeastern and Mid-Atlantic US; faces intense competition from national banks and fintech disruptors.
Huntington Bancshares Incorporated
- Operates mainly in Midwest with smaller footprint; competes aggressively with regional banks and emerging digital lenders.
2. Capital Structure & Debt
Truist Financial Corporation
- Debt-to-equity ratio of 1.07 signals higher leverage; interest coverage at 0.63 is weak, raising refinancing risk concerns.
Huntington Bancshares Incorporated
- Lower leverage with debt-to-equity at 0.76; similar low interest coverage at 0.62, indicating vulnerability to rising rates.
3. Stock Volatility
Truist Financial Corporation
- Beta of 0.874 suggests below-market volatility, offering some stability in turbulent markets.
Huntington Bancshares Incorporated
- Beta near 0.966 indicates volatility close to market average, posing moderate price fluctuations risk.
4. Regulatory & Legal
Truist Financial Corporation
- Subject to stringent banking regulations impacting capital reserves; ongoing compliance costs may pressure margins.
Huntington Bancshares Incorporated
- Faces similar regulatory environment; smaller scale may limit resources to absorb increased compliance expenses.
5. Supply Chain & Operations
Truist Financial Corporation
- Extensive branch network (2,517 offices) requires high operational efficiency; technology investments critical to stay competitive.
Huntington Bancshares Incorporated
- Operates ~1,000 branches; operational scalability a risk if digital transformation lags peers.
6. ESG & Climate Transition
Truist Financial Corporation
- Increasing pressure to align lending and investment portfolios with climate goals; reputational risks from ESG lagging.
Huntington Bancshares Incorporated
- Faces similar ESG pressures; smaller asset base could hinder rapid capital reallocation toward sustainable sectors.
7. Geopolitical Exposure
Truist Financial Corporation
- Primarily US domestic operations reduce direct geopolitical risks but remain exposed to macroeconomic shifts.
Huntington Bancshares Incorporated
- Also US-focused; regional economic downturns could disproportionately impact revenue streams.
Which company shows a better risk-adjusted profile?
Truist’s most impactful risk is its elevated leverage and weak interest coverage, exposing it to refinancing risks amid rising rates. Huntington’s critical risk lies in operational scalability tied to its smaller footprint and lower Piotroski score. Despite both firms residing in the distress zone by Altman Z-Score, Truist’s stronger Piotroski score and larger scale support a better risk-adjusted profile. Recent data showing Truist’s higher fixed asset turnover and dividend yield reinforce its operational resilience relative to Huntington.
Final Verdict: Which stock to choose?
Truist Financial Corporation (TFC) shines as a cash-generating engine with a solid gross margin and strong operational leverage. Its superpower lies in efficient capital deployment, despite a point of vigilance on its declining return on invested capital. TFC suits portfolios seeking aggressive growth with a tolerance for cyclical risks.
Huntington Bancshares Incorporated (HBAN) boasts a strategic moat through steady revenue growth and disciplined expense control. Its recurring income stream offers relative safety compared to TFC’s volatility, fitting well within Growth at a Reasonable Price (GARP) portfolios aiming for balanced upside and stability.
If you prioritize aggressive growth fueled by operational efficiency, Truist stands out due to its robust cash flow and margin expansion. However, if you seek steadier growth with a more defensive profile, Huntington offers better stability and a proven ability to grow earnings with less financial risk. Both face challenges in maintaining economic moats, requiring cautious monitoring of profitability trends.
Disclaimer: Investment carries a risk of loss of initial capital. The past performance is not a reliable indicator of future results. Be sure to understand risks before making an investment decision.
Go Further
I encourage you to read the complete analyses of Truist Financial Corporation and Huntington Bancshares Incorporated to enhance your investment decisions: