Home > Comparison > Financial Services > PNC vs HBAN
The strategic rivalry between The PNC Financial Services Group, Inc. and Huntington Bancshares Incorporated shapes the competitive landscape of regional banking. PNC operates as a diversified financial services powerhouse with broad corporate and institutional offerings. Huntington focuses on consumer and commercial banking with niche vehicle finance capabilities. This analysis will identify which operational model delivers a superior risk-adjusted return, guiding investors seeking resilient exposure in the financial services sector.
Table of contents
Companies Overview
The PNC Financial Services Group and Huntington Bancshares are key regional banks shaping U.S. financial services.
The PNC Financial Services Group, Inc.: Diversified Regional Banking Powerhouse
PNC dominates as a diversified financial services company with a broad portfolio spanning retail banking, corporate lending, and asset management. Its primary revenue stems from consumer deposits, commercial loans, and wealth management services. In 2026, PNC’s strategic focus remains on expanding digital channels and enhancing corporate banking solutions to deepen client relationships.
Huntington Bancshares Incorporated: Regional Banking with Targeted Specialization
Huntington Bancshares operates as a regional bank holding company emphasizing consumer, commercial, and vehicle finance segments. Its revenue primarily comes from deposit products, loans, and treasury management services tailored to middle-market businesses and consumers. In 2026, Huntington prioritizes growth in specialty banking sectors and private client wealth management to differentiate its market position.
Strategic Collision: Similarities & Divergences
Both banks focus on regional banking, but PNC leverages a diversified model across consumer, corporate, and asset management, while Huntington emphasizes specialized commercial and vehicle finance niches. Their fiercest competition lies in mid-sized business lending and wealth management services. PNC’s broader scale contrasts with Huntington’s targeted approach, defining distinct risk profiles and growth avenues for investors.
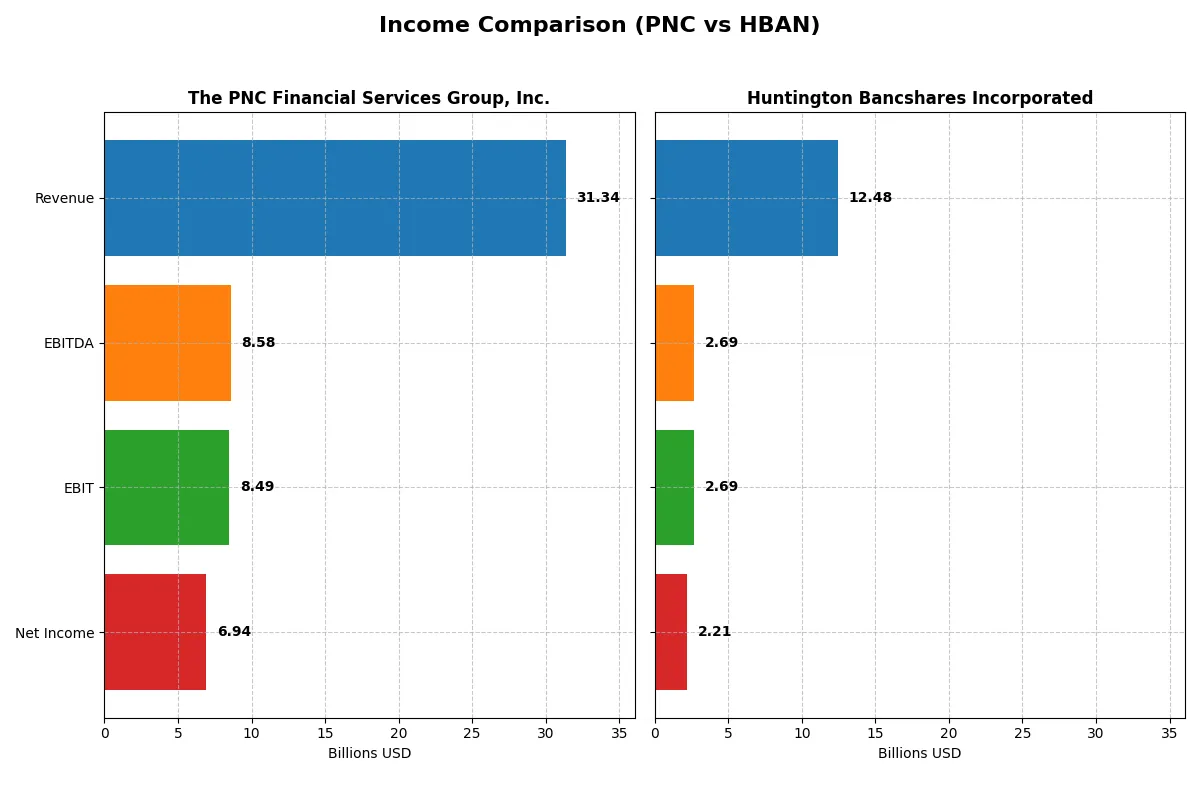
Income Statement Comparison
This data dissects the core profitability and scalability of both corporate engines to reveal who dominates the bottom line:
| Metric | The PNC Financial Services Group, Inc. (PNC) | Huntington Bancshares Incorporated (HBAN) |
|---|---|---|
| Revenue | 31.3B | 12.5B |
| Cost of Revenue | 8.9B | 4.8B |
| Operating Expenses | 13.97B | 5.02B |
| Gross Profit | 22.5B | 7.7B |
| EBITDA | 8.58B | 2.69B |
| EBIT | 8.49B | 2.69B |
| Interest Expense | 10.9B | 4.3B |
| Net Income | 6.94B | 2.21B |
| EPS | 16.62 | 1.41 |
| Fiscal Year | 2025 | 2025 |
Income Statement Analysis: The Bottom-Line Duel
This income statement comparison reveals which company converts revenue into profit most efficiently through recent market cycles.
The PNC Financial Services Group, Inc. Analysis
PNC’s revenue rose from 19.7B in 2021 to 31.3B in 2025, a 59% growth, while net income increased 22% to 6.9B. Its gross margin remains strong at 71.7%, with net margin expanding to 22.1%. Despite a 7% revenue dip in 2025, PNC improved EBIT and net income margins, demonstrating robust operational efficiency and earnings momentum.
Huntington Bancshares Incorporated Analysis
HBAN doubled revenue from 6.1B in 2021 to 12.5B in 2025, with net income surging 71% to 2.2B. Gross margin holds firm at 61.7%, while net margin stands at 17.7%. Revenue grew modestly by 4.4% in the latest year, supported by steady EBIT and net income expansion, signaling solid growth traction but slightly weaker profitability than PNC.
Margin Dominance vs. Growth Surge
PNC leads with superior margins and earnings quality, despite a recent revenue contraction. HBAN impresses with faster top-line and net income expansion but lags in profitability metrics. For investors, PNC offers a more resilient profit engine, while HBAN’s profile suits those prioritizing growth over margin strength.
Financial Ratios Comparison
These vital ratios act as a diagnostic tool to expose the underlying fiscal health, valuation premiums, and capital efficiency of the companies compared below:
| Ratios | The PNC Financial Services Group, Inc. (PNC) | Huntington Bancshares Incorporated (HBAN) |
|---|---|---|
| ROE | 11.4% | 9.1% |
| ROIC | 7.6% | -1.7% |
| P/E | 11.9 | 11.6 |
| P/B | 1.36 | 1.05 |
| Current Ratio | 0.81 | 0.10 |
| Quick Ratio | 0.81 | 0.10 |
| D/E | 0.94 | 0.76 |
| Debt-to-Assets | 9.96% | 8.21% |
| Interest Coverage | 0.78 | 0.62 |
| Asset Turnover | 0.05 | 0.06 |
| Fixed Asset Turnover | 0 | 9.45 |
| Payout ratio | 37.5% | 41.5% |
| Dividend yield | 3.16% | 3.57% |
| Fiscal Year | 2025 | 2025 |
Efficiency & Valuation Duel: The Vital Signs
Financial ratios act as the company’s DNA, exposing hidden risks and highlighting operational efficiency and valuation nuances.
The PNC Financial Services Group, Inc.
PNC shows solid profitability with an 11.45% ROE and a strong 22.13% net margin, signaling operational competence. Its valuation appears attractive, with a favorable P/E of 11.86 and P/B of 1.36, suggesting the stock is reasonably priced. The 3.16% dividend yield rewards shareholders, balancing growth with income.
Huntington Bancshares Incorporated
Huntington posts a weaker 9.08% ROE and a 17.71% net margin, reflecting less efficiency. Despite a slightly cheaper P/E of 11.61 and P/B of 1.05, its negative ROIC signals capital allocation challenges. Huntington offers a 3.57% dividend yield, favoring income-focused investors amid operational headwinds.
Balanced Profitability vs. Capital Efficiency Challenge
PNC delivers better operational returns and a sound valuation, while Huntington’s lower profitability and negative ROIC raise caution. Investors seeking stable profitability may prefer PNC; those prioritizing higher dividends despite risks might lean toward Huntington.
Which one offers the Superior Shareholder Reward?
I compare PNC and HBAN’s shareholder reward models by analyzing dividend yields, payout ratios, and buyback intensity. PNC yields 3.16% with a 37.5% payout ratio, showing moderate dividends supported by solid free cash flow. HBAN yields 3.57% with a 41.5% payout ratio, also maintaining dividends but with less buyback activity. PNC’s share repurchases are more aggressive, boosting total return sustainability. HBAN focuses on steady dividends with less buyback emphasis, risking slower capital return growth. I judge PNC offers superior shareholder reward in 2026 due to its balanced dividend and stronger buyback program, enhancing total return potential.
Comparative Score Analysis: The Strategic Profile
The radar chart reveals the fundamental DNA and trade-offs of The PNC Financial Services Group, Inc. and Huntington Bancshares Incorporated:
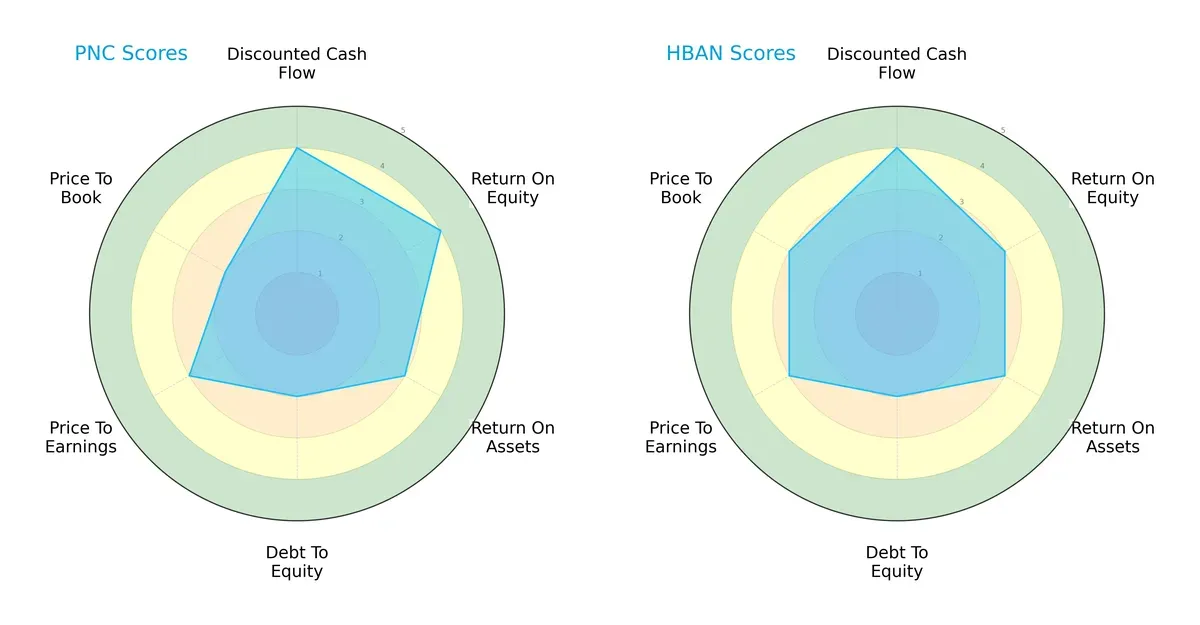
PNC shows strength in Return on Equity (4) and Discounted Cash Flow (4), while Huntington Bancshares matches PNC in DCF (4) but lags slightly in ROE (3). Both have moderate Return on Assets (3) and Debt-to-Equity (2) scores, but Huntington edges PNC in Price-to-Book valuation (3 vs. 2). PNC’s profile is more focused on profitability metrics, whereas Huntington offers a slightly better valuation balance. Overall, PNC exhibits a sharper profitability edge, but Huntington presents a more balanced valuation approach.
Bankruptcy Risk: Solvency Showdown
The Altman Z-Scores place both firms in the distress zone, signaling elevated bankruptcy risk in the current cycle:
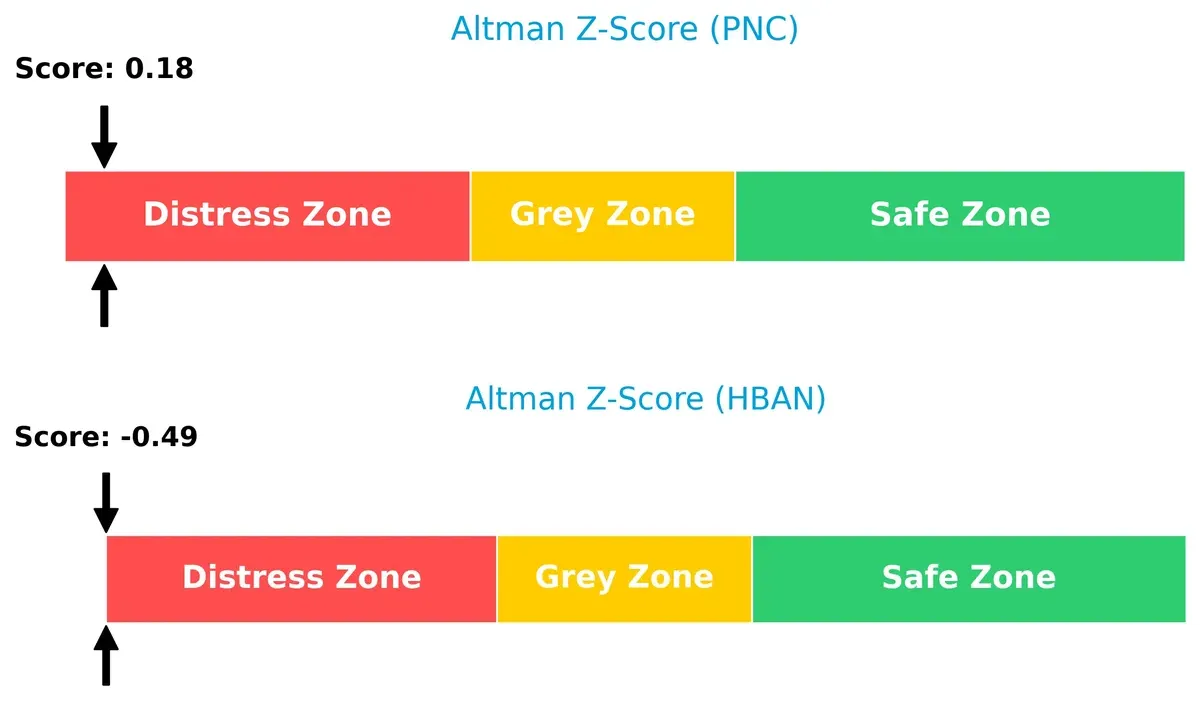
PNC’s Z-Score of 0.18 is marginally higher than Huntington’s -0.49, indicating slightly better solvency. Both firms face significant financial stress, demanding close monitoring for long-term survival risks.
Financial Health: Quality of Operations
PNC leads with a Piotroski F-Score of 7, reflecting strong internal financial health, while Huntington scores a middling 5, signaling average operational quality:
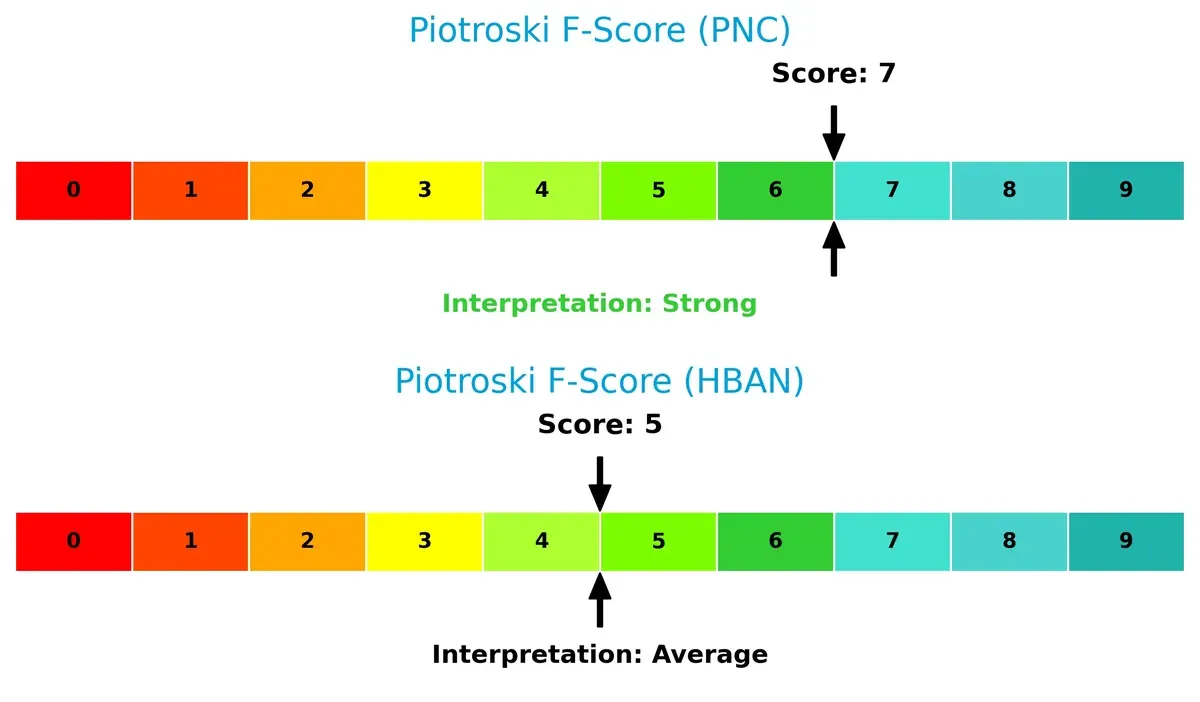
PNC demonstrates more robust profitability, liquidity, and efficiency metrics, whereas Huntington shows some red flags internally. Investors should weigh PNC’s superior financial strength against Huntington’s weaker operational signals carefully.
How are the two companies positioned?
This section dissects the operational DNA of PNC and HBAN by comparing their revenue distribution and internal dynamics. The goal is to confront their economic moats to reveal which model offers the most resilient, sustainable competitive advantage today.
Revenue Segmentation: The Strategic Mix
This visual comparison dissects how The PNC Financial Services Group, Inc. and Huntington Bancshares Incorporated diversify income streams and where their primary sector bets lie:
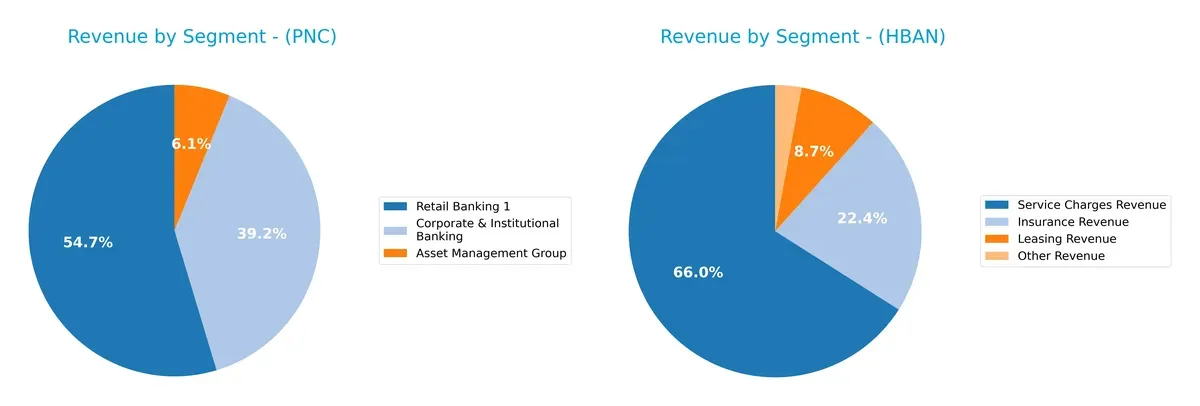
PNC anchors its revenue in Retail Banking at $12.9B, with strong Corporate & Institutional Banking at $9.3B, and a smaller Asset Management Group at $1.45B. This mix shows moderate diversification but leans heavily on retail deposits and loans. In contrast, HBAN spreads its 2023 revenue across Service Charges ($211M), Insurance ($74M), Leasing ($51M), and Other ($68M), reflecting a more fragmented, niche-focused model. PNC’s concentration in retail banking signals scale and ecosystem lock-in, while HBAN’s diversity limits reliance on any single segment but may dilute market power.
Strengths and Weaknesses Comparison
This table compares the strengths and weaknesses of The PNC Financial Services Group, Inc. and Huntington Bancshares Incorporated:
PNC Strengths
- Strong net margin at 22.13%
- Favorable P/E and P/B ratios
- Diversified revenue with large retail and corporate banking segments
- Low debt-to-assets ratio at 9.96%
- Attractive dividend yield at 3.16%
HBAN Strengths
- Favorable net margin and dividend yield at 3.57%
- Favorable P/E and P/B ratios
- Strong fixed asset turnover at 9.45
- Favorable debt-to-assets ratio at 8.21%
- Diverse revenue sources including cards and trust services
PNC Weaknesses
- Current ratio below 1 at 0.81, indicating liquidity risk
- Interest coverage below 1 at 0.78, signaling potential debt servicing issues
- WACC higher than ROIC, suggesting value destruction
- Low asset and fixed asset turnover
- ROE and ROIC neutral
HBAN Weaknesses
- Low current and quick ratios at 0.1, indicating weak liquidity
- Negative ROIC at -1.69% and low ROE at 9.08%
- Interest coverage below 1 at 0.62, raising solvency concerns
- Higher WACC at 12.76% than ROIC
- Higher proportion of unfavorable ratios at 50%
PNC shows solid profitability and diversified revenue but faces liquidity and efficiency challenges. HBAN has mixed profitability and liquidity concerns, with some operational strengths. Both firms must carefully manage capital and operational efficiency to support sustainable growth.
The Moat Duel: Analyzing Competitive Defensibility
A structural moat is the only safeguard against competitive forces eroding long-term profits. Here’s how PNC and Huntington Bancshares stand:
The PNC Financial Services Group, Inc.: Improving Profitability Amid Value Challenges
PNC’s moat stems from intangible assets and scale, reflected in stable margins and growing ROIC despite currently shedding value versus WACC. Expansion into diversified financial services may deepen its moat in 2026.
Huntington Bancshares Incorporated: Struggling Efficiency with Regional Focus
Huntington relies on cost advantages and local market penetration, but its declining ROIC and value destruction mark a weaker moat compared to PNC. Future growth hinges on reversing profitability trends and regional expansion.
Scale and Profitability vs. Regional Cost Advantage
PNC exhibits a wider, more resilient moat with improving profitability, while Huntington’s shrinking ROIC signals a vulnerable moat. PNC is better equipped to defend market share in evolving financial markets.
Which stock offers better returns?
The past year reveals strong upward momentum for both stocks, with PNC showing sharper gains and heightened trading activity compared to HBAN’s steadier climb.
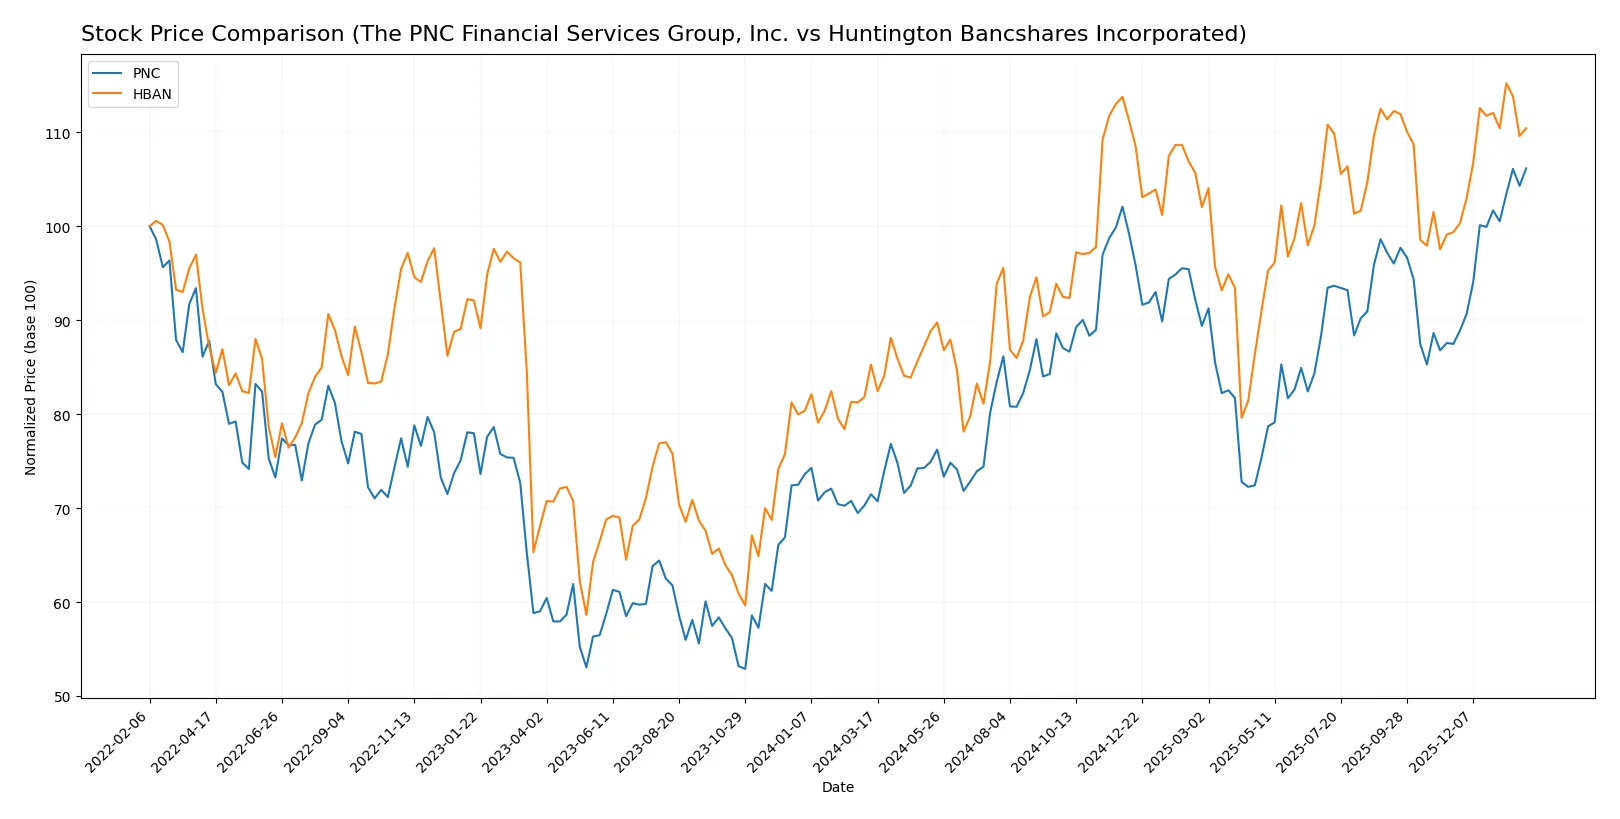
Trend Comparison
PNC’s stock rose 48.54% over the past year, marking a bullish trend with accelerating gains and significant volatility, ranging from $148.78 to $223.30.
HBAN’s stock increased 29.48% in the same period, also bullish with acceleration, but exhibited much lower volatility, fluctuating between $12.37 and $18.24.
PNC outperformed HBAN in market returns with a higher growth rate and more dynamic price movement during the analyzed timeframe.
Target Prices
Analysts present a clear target consensus for The PNC Financial Services Group and Huntington Bancshares.
| Company | Target Low | Target High | Consensus |
|---|---|---|---|
| The PNC Financial Services Group, Inc. | 206 | 284 | 239.1 |
| Huntington Bancshares Incorporated | 16 | 23 | 20 |
The PNC consensus target of 239.1 exceeds its current price of 223.3, indicating moderate upside potential. Huntington’s consensus target of 20 also suggests a valuation above its 17.48 price, reflecting cautious optimism.

Don’t Let Luck Decide Your Entry Point
Optimize your entry points with our advanced ProRealTime indicators. You’ll get efficient buy signals with precise price targets for maximum performance. Start outperforming now!
How do institutions grade them?
Institutional grades for both companies are summarized below:
The PNC Financial Services Group, Inc. Grades
The following table lists recent grades from recognized financial institutions for PNC:
| Grading Company | Action | New Grade | Date |
|---|---|---|---|
| Keefe, Bruyette & Woods | maintain | Market Perform | 2026-01-20 |
| Wells Fargo | maintain | Overweight | 2026-01-20 |
| Oppenheimer | maintain | Outperform | 2026-01-20 |
| RBC Capital | maintain | Outperform | 2026-01-20 |
| TD Cowen | maintain | Buy | 2026-01-20 |
| Morgan Stanley | maintain | Underweight | 2026-01-20 |
| TD Cowen | maintain | Buy | 2026-01-07 |
| Barclays | maintain | Overweight | 2026-01-05 |
| Truist Securities | maintain | Hold | 2025-12-18 |
| Keefe, Bruyette & Woods | maintain | Market Perform | 2025-12-17 |
Huntington Bancshares Incorporated Grades
Below are the recent institutional grades published for Huntington Bancshares:
| Grading Company | Action | New Grade | Date |
|---|---|---|---|
| Truist Securities | maintain | Buy | 2026-01-26 |
| Morgan Stanley | maintain | Overweight | 2026-01-23 |
| Keefe, Bruyette & Woods | maintain | Market Perform | 2026-01-23 |
| Barclays | maintain | Equal Weight | 2026-01-05 |
| RBC Capital | maintain | Outperform | 2025-12-19 |
| Piper Sandler | maintain | Underweight | 2025-12-10 |
| DA Davidson | maintain | Buy | 2025-10-28 |
| Keefe, Bruyette & Woods | maintain | Market Perform | 2025-10-20 |
| Raymond James | maintain | Strong Buy | 2025-10-20 |
| TD Cowen | maintain | Buy | 2025-10-20 |
Which company has the best grades?
Huntington Bancshares enjoys generally higher grades, including a Strong Buy from Raymond James and multiple Buy ratings. PNC’s grades cluster more around Market Perform and Outperform, with one Underweight. Investors may view Huntington’s stronger consensus as a signal of more optimistic institutional sentiment.
Risks specific to each company
The following categories identify critical pressure points and systemic threats facing both firms in the 2026 market environment:
1. Market & Competition
The PNC Financial Services Group, Inc.
- Faces intense regional banking rivalry; larger scale offers some competitive edge.
Huntington Bancshares Incorporated
- Competes in overlapping markets with smaller footprint; growth depends on regional penetration.
2. Capital Structure & Debt
The PNC Financial Services Group, Inc.
- Balanced debt-to-equity ratio (0.94) but weak interest coverage (0.78) signals moderate financial risk.
Huntington Bancshares Incorporated
- Slightly lower debt-to-equity (0.76) but poorer interest coverage (0.62) increases refinancing risks.
3. Stock Volatility
The PNC Financial Services Group, Inc.
- Beta near 1 (0.992) indicates stock moves in line with market, moderate volatility.
Huntington Bancshares Incorporated
- Slightly lower beta (0.966) suggests marginally less sensitivity to market swings.
4. Regulatory & Legal
The PNC Financial Services Group, Inc.
- Larger regulatory footprint increases compliance costs but provides scale advantages.
Huntington Bancshares Incorporated
- Smaller scale may limit regulatory burden but less capacity to absorb shocks.
5. Supply Chain & Operations
The PNC Financial Services Group, Inc.
- Extensive branch and ATM network (2,591 branches) demands complex operational management.
Huntington Bancshares Incorporated
- Smaller network (~1,000 branches) simplifies operations but limits physical reach.
6. ESG & Climate Transition
The PNC Financial Services Group, Inc.
- Increasing pressure to decarbonize lending portfolio; ESG compliance critical for reputation.
Huntington Bancshares Incorporated
- ESG efforts less visible; may lag peers, risking stakeholder criticism.
7. Geopolitical Exposure
The PNC Financial Services Group, Inc.
- Primarily US-focused, limiting direct geopolitical risks but sensitive to domestic economic policy.
Huntington Bancshares Incorporated
- Also US-centric; regional economic shifts could disproportionately affect revenue.
Which company shows a better risk-adjusted profile?
PNC’s most impactful risk is its weak interest coverage, which threatens financial flexibility amid rising rates. Huntington’s greatest concern lies in its negative ROIC and poor liquidity ratios, elevating default risk. Despite both in distress zones per Altman Z-scores, PNC’s stronger Piotroski score and scale offer a better risk-adjusted profile. The stark contrast in liquidity ratios (PNC’s 0.81 vs. Huntington’s 0.1 current ratio) justifies heightened caution for Huntington.
Final Verdict: Which stock to choose?
The PNC Financial Services Group, Inc. wields a clear superpower in its steadily improving profitability and robust income quality. Its growing return on invested capital signals increasing operational efficiency despite a current ratio that warrants caution. PNC fits well in an aggressive growth portfolio seeking improving fundamentals amid some liquidity concerns.
Huntington Bancshares Incorporated commands a strategic moat through its solid dividend yield and favorable valuation metrics, offering a more conservative profile. However, its declining ROIC and weaker profitability trend pose a risk relative to PNC. HBAN suits investors focused on growth at a reasonable price, valuing income stability over rapid expansion.
If you prioritize improving profitability and operational momentum, PNC is the compelling choice due to its upward ROIC trend and strong income quality. However, if you seek income yield with moderate valuation risk, HBAN offers better stability despite its challenges. Both present distinct risk-reward profiles, aligning with different investor strategies and risk tolerances.
Disclaimer: Investment carries a risk of loss of initial capital. The past performance is not a reliable indicator of future results. Be sure to understand risks before making an investment decision.
Go Further
I encourage you to read the complete analyses of The PNC Financial Services Group, Inc. and Huntington Bancshares Incorporated to enhance your investment decisions: