Home > Comparison > Financial Services > HBAN vs RF
The strategic rivalry between Huntington Bancshares Incorporated and Regions Financial Corporation shapes the regional banking landscape in the U.S. Huntington operates a diversified model spanning consumer, commercial, vehicle finance, and private banking. Regions concentrates on corporate banking, consumer services, and wealth management across a broad southern and midwestern footprint. This analysis will determine which operational approach offers superior risk-adjusted returns for a diversified portfolio in today’s evolving financial sector.
Table of contents
Companies Overview
Huntington Bancshares and Regions Financial are key players in the U.S. regional banking sector with broad service portfolios.
Huntington Bancshares Incorporated: Regional Banking Powerhouse
Huntington Bancshares operates as a bank holding company focused on commercial, consumer, and mortgage banking. Its primary revenue comes from diversified segments including Consumer and Business Banking, Commercial Banking, Vehicle Finance, and Private Client services. In 2026, Huntington strategically emphasizes expanding its digital banking footprint and regional customer base across 11 states.
Regions Financial Corporation: Comprehensive Financial Services Provider
Regions Financial is a financial holding company delivering banking and related services through Corporate, Consumer, and Wealth Management segments. It earns revenue via commercial loans, deposit products, and investment services. In 2026, Regions prioritizes growth in commercial banking and wealth management while maintaining a strong presence across the South, Midwest, and Texas through 1,300 branches.
Strategic Collision: Similarities & Divergences
Both banks focus on regional markets with diversified financial services but diverge in scale and geographic concentration. Huntington leans into digital innovation and broadening consumer reach, while Regions emphasizes commercial banking strength and wealth management. Their competition centers on middle-market commercial lending and retail deposits. Each offers a distinct risk-reward profile shaped by their operational footprints and strategic priorities.
Income Statement Comparison
This data dissects the core profitability and scalability of both corporate engines to reveal who dominates the bottom line:
| Metric | Huntington Bancshares (HBAN) | Regions Financial (RF) |
|---|---|---|
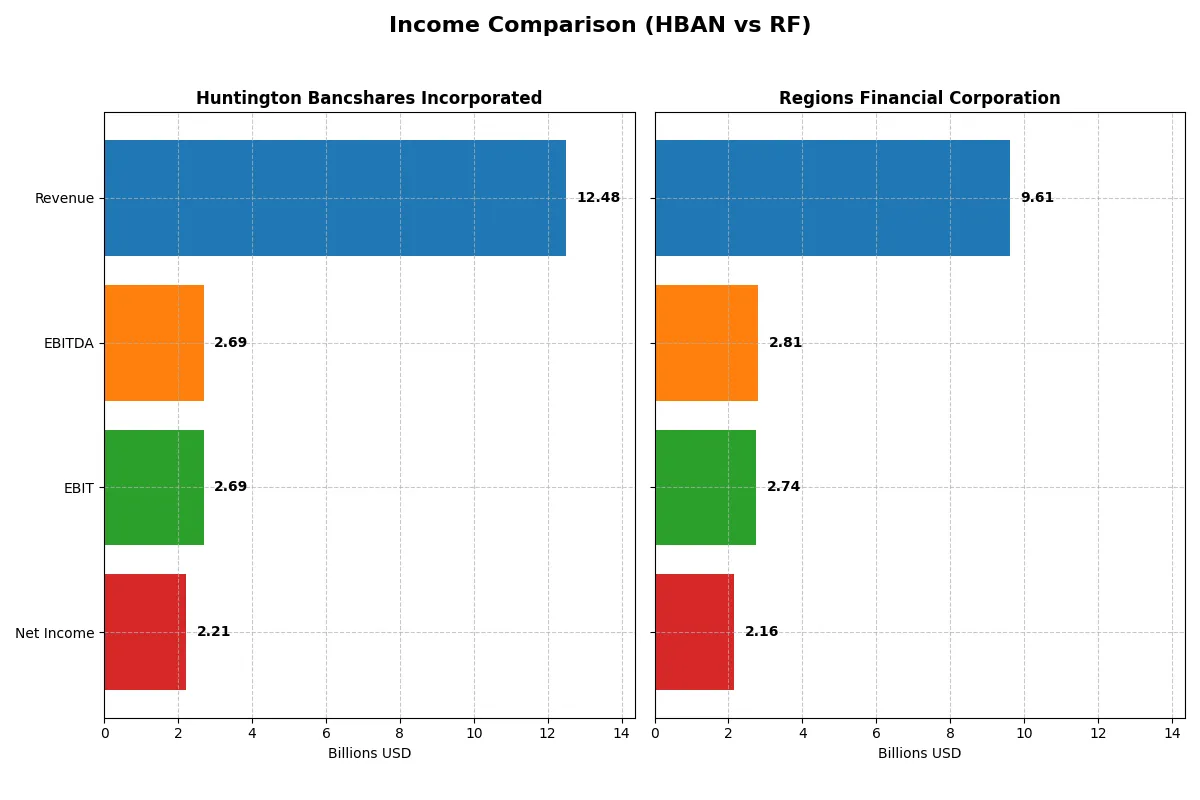
| Revenue | 12.5B | 9.6B |
| Cost of Revenue | 4.8B | 2.4B |
| Operating Expenses | 5.0B | 4.4B |
| Gross Profit | 7.7B | 7.2B |
| EBITDA | 2.7B | 2.8B |
| EBIT | 2.7B | 2.7B |
| Interest Expense | 4.3B | 2.1B |
| Net Income | 2.2B | 2.2B |
| EPS | 1.41 | 2.31 |
| Fiscal Year | 2025 | 2025 |
Income Statement Analysis: The Bottom-Line Duel
This income statement comparison reveals which corporate engine delivers superior efficiency and profitability in a challenging market environment.
Huntington Bancshares Incorporated Analysis
Huntington’s revenue grew steadily, reaching $12.5B in 2025, with net income climbing to $2.21B. The gross margin remained solid at 61.7%, signaling strong cost control. Net margin at 17.7% improved, reflecting enhanced operational efficiency despite rising interest expenses. Earnings per share surged 13.9% in the last year, showing robust momentum.
Regions Financial Corporation Analysis
Regions Financial posted $9.6B in revenue for 2025, with net income rising to $2.16B. Its superior gross margin of 74.6% and an EBIT margin of 28.5% highlight operational strength. However, revenue growth slowed to 2.5%, and net income declined over the longer term. EPS growth accelerated 18.7% last year, indicating recent efficiency gains.
Margin Strength vs. Growth Trajectory
Huntington leads with stronger revenue and net income growth over five years, despite a lower gross margin than Regions. Regions boasts higher margins but faces long-term net income contraction. Huntington’s profile suits growth-focused investors, while Regions appeals to those prioritizing margin power and recent earnings efficiency.
Financial Ratios Comparison
These vital ratios act as a diagnostic tool to expose the underlying fiscal health, valuation premiums, and capital efficiency of these banking institutions:
| Ratios | Huntington Bancshares (HBAN) | Regions Financial (RF) |
|---|---|---|
| ROE | 9.08% | 11.32% |
| ROIC | -1.69% | 13.79% |
| P/E | 11.61 | 11.00 |
| P/B | 1.05 | 1.25 |
| Current Ratio | 0.10 | 0.30 |
| Quick Ratio | 0.10 | 0.30 |
| D/E | 0.76 | 0.26 |
| Debt-to-Assets | 8.21% | 3.06% |
| Interest Coverage | 0.62 | 1.32 |
| Asset Turnover | 0.055 | 0.060 |
| Fixed Asset Turnover | 9.45 | 5.79 |
| Payout ratio | 41.47% | 41.80% |
| Dividend yield | 3.57% | 3.80% |
| Fiscal Year | 2025 | 2025 |
Efficiency & Valuation Duel: The Vital Signs
Financial ratios act as a company’s DNA, uncovering hidden risks and operational strength critical for investment decisions.
Huntington Bancshares Incorporated
Huntington shows a mixed profitability profile with a modest 9.08% ROE and a strong 17.71% net margin. Its valuation appears reasonable with an 11.61 P/E and 1.05 P/B, signaling value rather than stretch. The 3.57% dividend yield rewards shareholders, reflecting a stable return amid limited reinvestment in growth or R&D.
Regions Financial Corporation
Regions delivers superior profitability, boasting an 11.32% ROE and 22.44% net margin, alongside a favorable 13.79% ROIC. Its valuation is attractive with an 11.0 P/E and 1.25 P/B. Regions offers a slightly higher 3.8% dividend yield and maintains disciplined capital allocation, supporting both shareholder returns and operational efficiency.
Profitability and Valuation: Value vs. Growth Stability
Regions Financial presents a more balanced risk-reward profile through stronger profitability and valuation metrics. Huntington’s modest returns and dividend yield suit cautious investors, while Regions fits those seeking operational efficiency backed by solid shareholder distributions.
Which one offers the Superior Shareholder Reward?
I see Huntington Bancshares (HBAN) delivers a higher dividend yield of 5.62% in 2023, with payout ratios around 45-53%, signaling steady income. Regions Financial (RF) pays slightly lower yields near 3.8-4.9%, with more conservative payout ratios around 28-42%, freeing cash for growth. HBAN’s buybacks remain modest, while RF appears more disciplined, maintaining lower debt and better coverage ratios. HBAN’s higher yield carries risk given tighter coverage. RF’s balanced dividend and capital allocation suggest a more sustainable shareholder return in 2026. I favor RF for superior total return potential, blending income with capital preservation.
Comparative Score Analysis: The Strategic Profile
The radar chart reveals the fundamental DNA and trade-offs of Huntington Bancshares and Regions Financial Corporation:
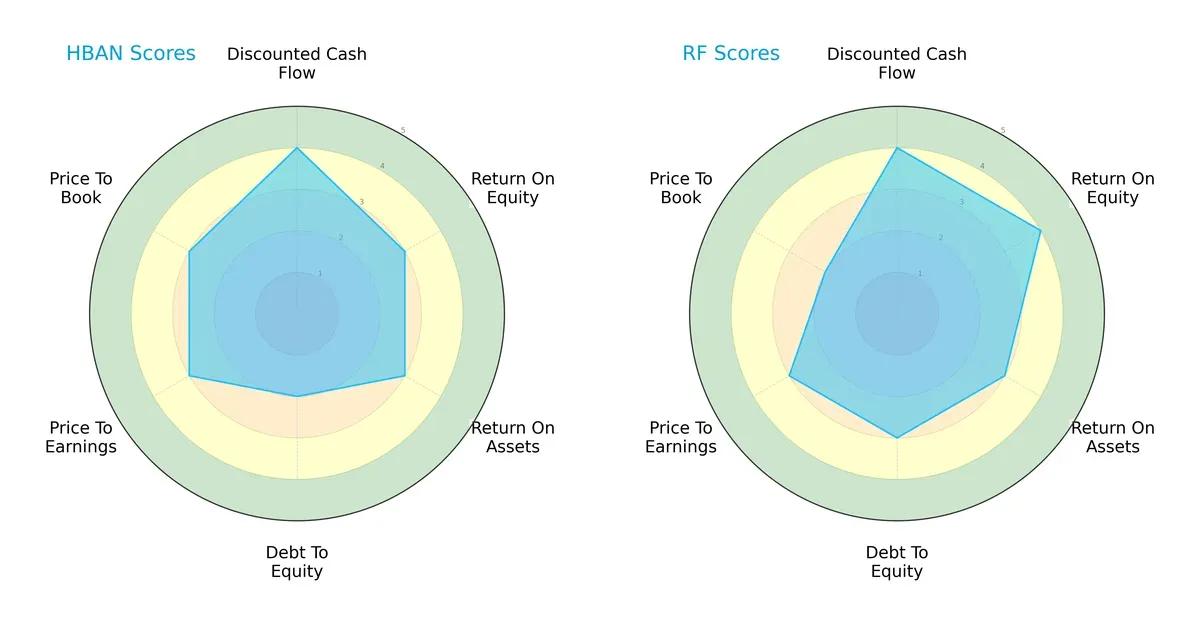
Huntington and Regions share balanced overall scores, but Regions edges out with stronger ROE (4 vs. 3) and better debt management (3 vs. 2). Huntington matches Regions in DCF (4) and ROA (3), but relies more on valuation metrics (PE/PB). Regions displays a more diversified financial strength, while Huntington leans on valuation discipline.
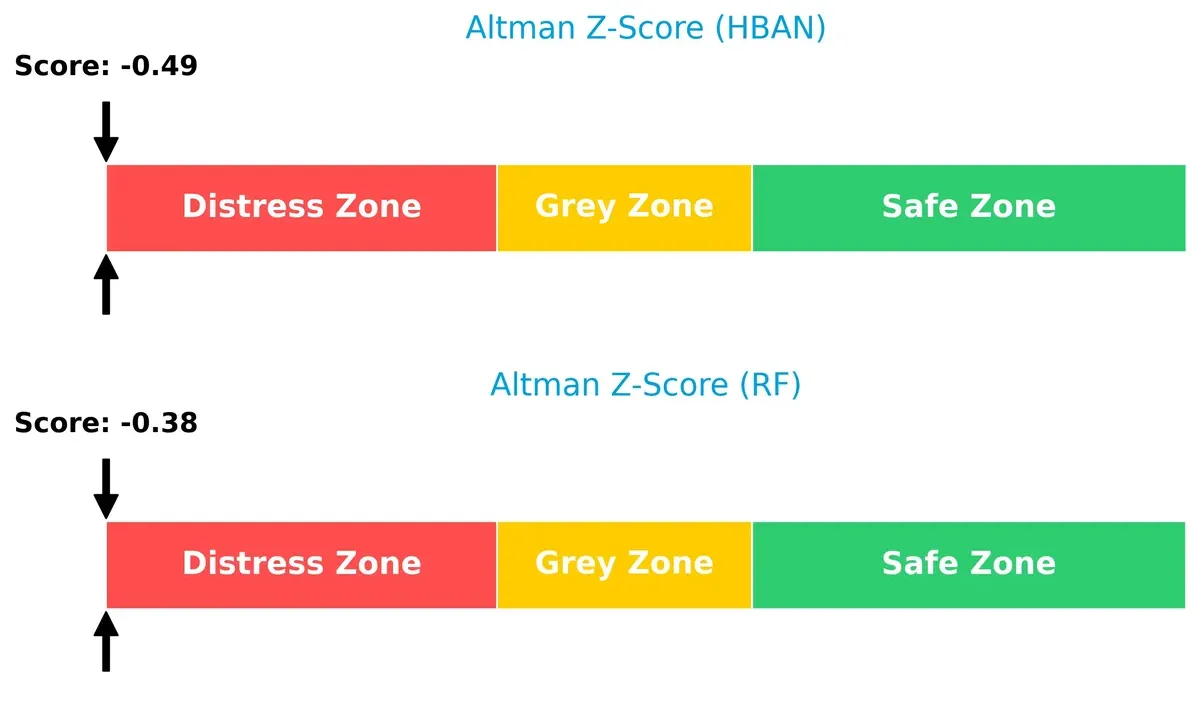
Bankruptcy Risk: Solvency Showdown
Regions’ Altman Z-Score (-0.38) slightly outperforms Huntington’s (-0.49), but both reside in the distress zone. This signals elevated bankruptcy risk and financial fragility for both banks in this cycle:
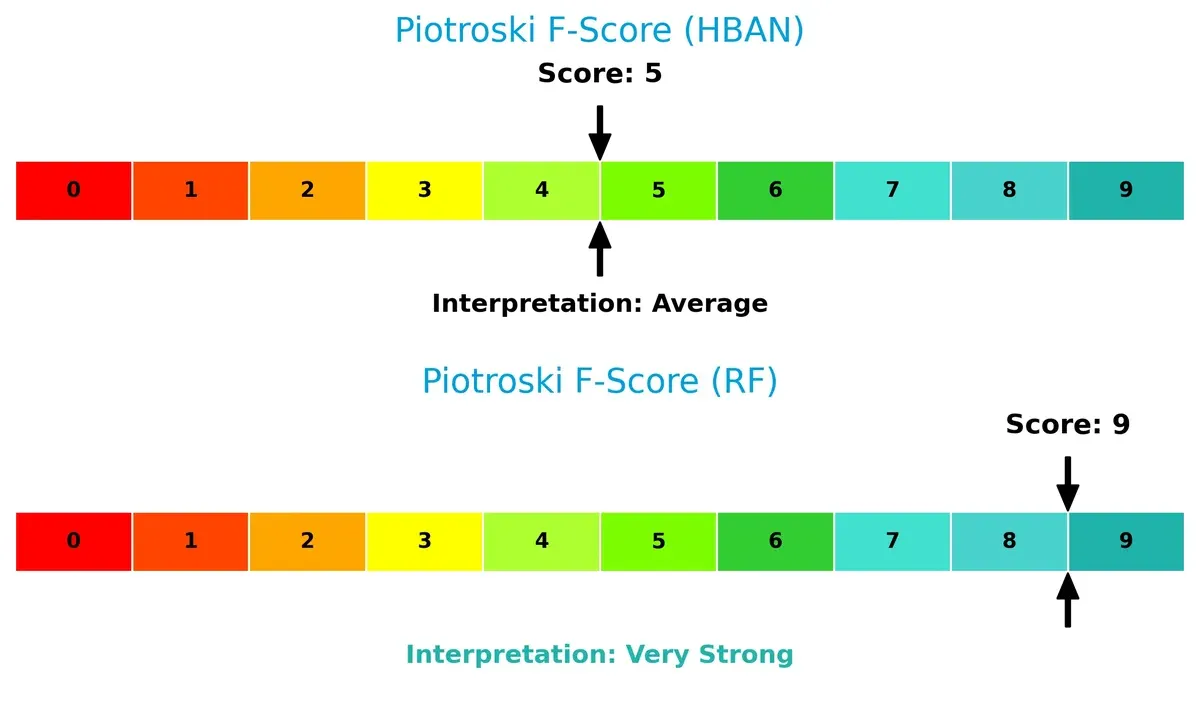
Financial Health: Quality of Operations
Regions scores a robust 9 on the Piotroski F-Score, indicating very strong financial health. Huntington’s 5 signals average operational quality and potential red flags in internal metrics:
How are the two companies positioned?
This section dissects the operational DNA of HBAN and RF by comparing their revenue distribution and internal dynamics. The goal is to confront their economic moats to reveal which model offers the most resilient, sustainable advantage today.
Revenue Segmentation: The Strategic Mix
This visual comparison dissects how Huntington Bancshares and Regions Financial diversify income streams and where their primary sector bets concentrate:
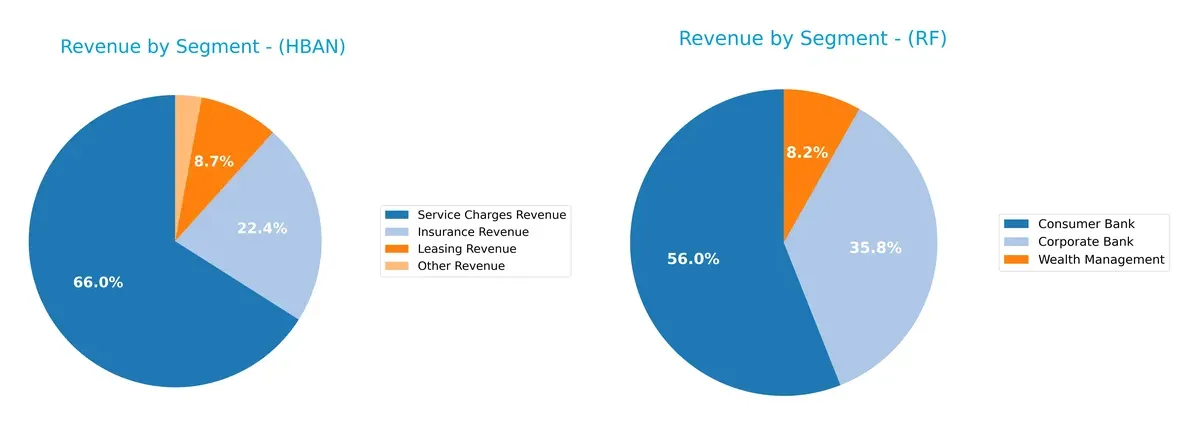
Regions Financial anchors revenue in Consumer Bank at $3.13B and Corporate Bank at $2B, showing a strong focus on core banking services. Huntington Bancshares presents a more diversified mix, with Service Charges at $227M, Insurance at $77M, and Leasing at $30M. Regions’ concentration signals infrastructure dominance but heightened sector risk. Huntington’s spread suggests strategic flexibility and lower dependency on a single segment.
Strengths and Weaknesses Comparison
This table compares the Strengths and Weaknesses of Huntington Bancshares Incorporated (HBAN) and Regions Financial Corporation (RF):
HBAN Strengths
- Favorable net margin at 17.71%
- Attractive P/E of 11.61 and P/B of 1.05
- Low debt-to-assets at 8.21%
- High fixed asset turnover of 9.45
- Dividend yield at 3.57%
- Diversified revenue streams including insurance and leasing
RF Strengths
- Stronger net margin at 22.44%
- ROIC of 13.79% exceeds WACC
- Favorable P/E 11.0 and P/B 1.25
- Low debt-to-assets at 3.06%
- Higher interest coverage than HBAN
- Dividend yield at 3.8%
- Large revenue base with Consumer, Corporate, and Wealth segments
HBAN Weaknesses
- Unfavorable ROIC below WACC at -1.69%
- Low current and quick ratios at 0.1 signal liquidity risk
- ROE at 9.08% is unfavorable
- Interest coverage below 1
- Low asset turnover at 0.06
- Slightly unfavorable overall financial ratios
RF Weaknesses
- Current and quick ratios low at 0.3, indicating liquidity pressure
- Interest coverage still below 2
- Asset turnover also low at 0.06
- WACC slightly above ROIC
- Neutral ROE at 11.32%
HBAN shows solid profitability in margins and capital efficiency but struggles with liquidity and capital returns. RF displays stronger profitability and capital allocation but faces similar liquidity constraints. Both must address operational efficiency and balance sheet resilience to reinforce their competitive positions.
The Moat Duel: Analyzing Competitive Defensibility
A structural moat is the only reliable shield protecting long-term profits from relentless competition erosion. Here’s how the battle unfolds:
Huntington Bancshares Incorporated: Cost Advantage with Shrinking Returns
Huntington relies on a cost advantage, reflected in solid margins but a troubling ROIC decline. Its weakening profitability signals a shrinking moat in 2026 unless operational efficiency improves.
Regions Financial Corporation: Emerging Profitability with Growth Potential
Regions shows an improving ROIC trend and stronger margins compared to Huntington. Its moat is less about cost and more about growing operational efficiency and market reach, hinting at future expansion opportunities.
Verdict: Cost Efficiency vs. Profitability Momentum
Huntington’s cost advantage is undermined by declining capital returns. Regions, with a rising ROIC trend, holds a deeper moat poised to defend market share more effectively in 2026. I see Regions better equipped for sustainable competitive advantage.
Which stock offers better returns?
Both Huntington Bancshares Incorporated and Regions Financial Corporation have shown significant bullish momentum over the past year, with notable price gains and accelerating upward trends.
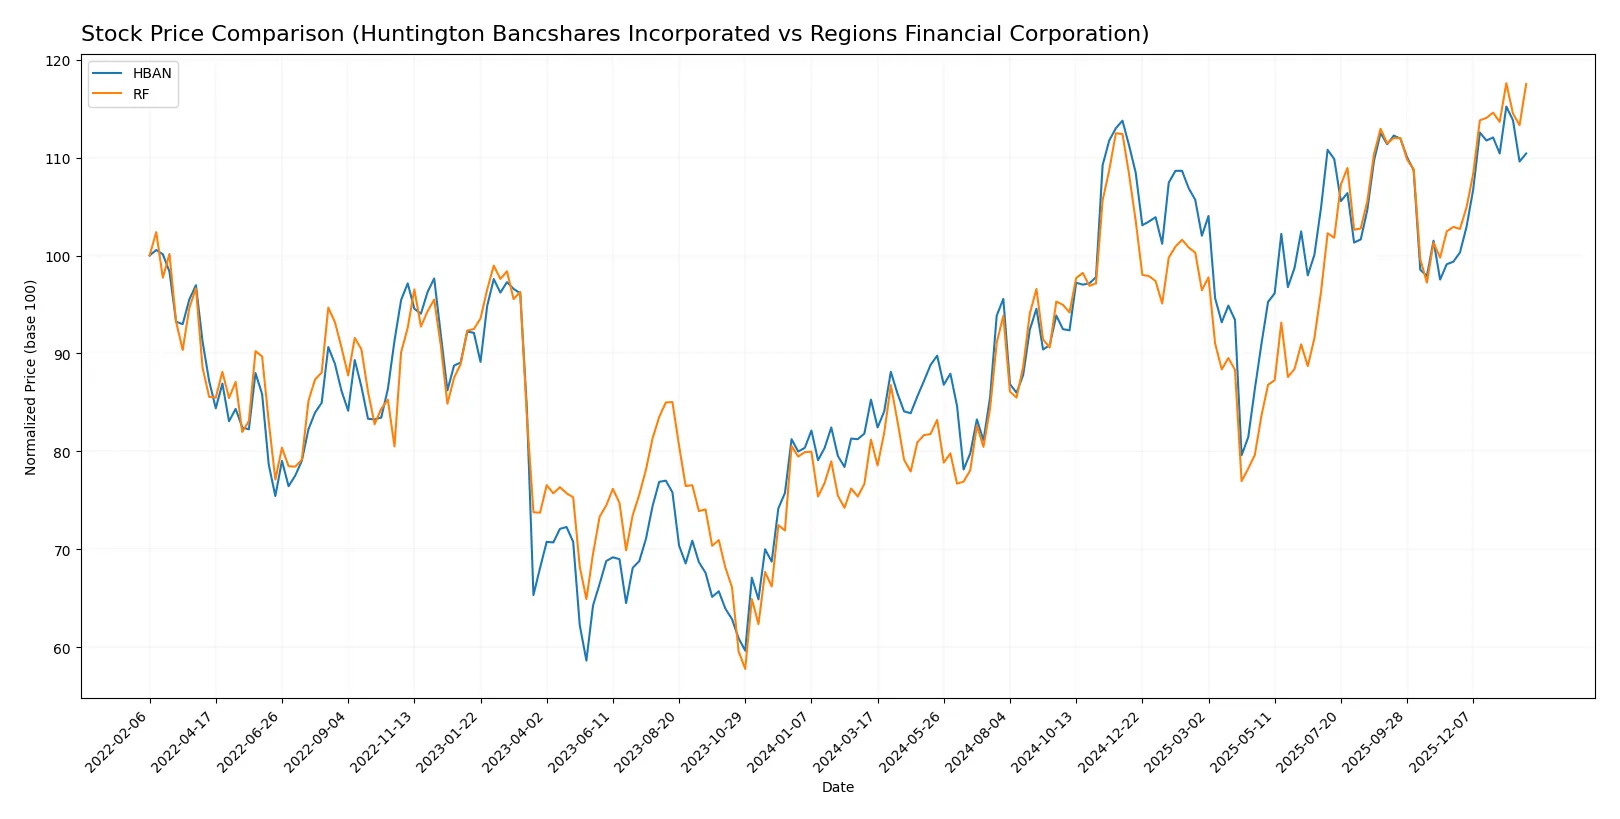
Trend Comparison
Huntington Bancshares (HBAN) posted a 29.48% price increase over the last 12 months, marked by acceleration and a low volatility of 1.59. The stock ranged between 12.37 and 18.24.
Regions Financial (RF) outperformed with a 44.74% gain over the same period, also accelerating but with higher volatility at 2.78. Its price fluctuated from 18.6 to 28.52.
Comparing both, RF delivered the highest market performance, nearly 15 points above HBAN, reflecting stronger price appreciation and momentum.
Target Prices
Analyst consensus sets clear target price ranges for Huntington Bancshares and Regions Financial, reflecting moderate upside potential.
| Company | Target Low | Target High | Consensus |
|---|---|---|---|
| Huntington Bancshares Incorporated | 16 | 23 | 20 |
| Regions Financial Corporation | 27 | 32 | 29.89 |
The consensus target for Huntington Bancshares stands slightly above its current price of 17.48, suggesting modest appreciation. Regions Financial’s target consensus at 29.89 indicates potential upside from the current 28.5 price, signaling analyst confidence.

Don’t Let Luck Decide Your Entry Point
Optimize your entry points with our advanced ProRealTime indicators. You’ll get efficient buy signals with precise price targets for maximum performance. Start outperforming now!
How do institutions grade them?
The following tables summarize the recent grades assigned to Huntington Bancshares Incorporated and Regions Financial Corporation by reputable grading firms:
Huntington Bancshares Incorporated Grades
This table shows the latest grades and actions from various financial institutions for Huntington Bancshares Incorporated.
| Grading Company | Action | New Grade | Date |
|---|---|---|---|
| Truist Securities | Maintain | Buy | 2026-01-26 |
| Morgan Stanley | Maintain | Overweight | 2026-01-23 |
| Keefe, Bruyette & Woods | Maintain | Market Perform | 2026-01-23 |
| Barclays | Maintain | Equal Weight | 2026-01-05 |
| RBC Capital | Maintain | Outperform | 2025-12-19 |
| Piper Sandler | Maintain | Underweight | 2025-12-10 |
| DA Davidson | Maintain | Buy | 2025-10-28 |
| Keefe, Bruyette & Woods | Maintain | Market Perform | 2025-10-20 |
| Raymond James | Maintain | Strong Buy | 2025-10-20 |
| TD Cowen | Maintain | Buy | 2025-10-20 |
Regions Financial Corporation Grades
This table summarizes the recent grades and actions from established grading firms for Regions Financial Corporation.
| Grading Company | Action | New Grade | Date |
|---|---|---|---|
| Piper Sandler | Maintain | Neutral | 2026-01-20 |
| Wells Fargo | Maintain | Underweight | 2026-01-20 |
| Keefe, Bruyette & Woods | Downgrade | Market Perform | 2026-01-20 |
| Wells Fargo | Downgrade | Underweight | 2026-01-16 |
| Evercore ISI Group | Downgrade | Underperform | 2026-01-06 |
| Barclays | Maintain | Underweight | 2026-01-05 |
| Truist Securities | Maintain | Hold | 2025-12-22 |
| Keefe, Bruyette & Woods | Maintain | Outperform | 2025-12-17 |
| Truist Securities | Maintain | Hold | 2025-10-20 |
| Stephens & Co. | Downgrade | Equal Weight | 2025-10-14 |
Which company has the best grades?
Huntington Bancshares holds generally stronger and more consistent buy and outperform ratings. Regions Financial shows more downgrades and holds lower overall grades. Investors may interpret Huntington’s steadier positive sentiment as a signal of greater institutional confidence.
Risks specific to each company
The following categories identify the critical pressure points and systemic threats facing both firms in the 2026 market environment:
1. Market & Competition
Huntington Bancshares Incorporated
- Faces intense regional banking competition with moderate market share; modest ROE signals challenges in profitability efficiency.
Regions Financial Corporation
- Competes vigorously in southern and midwestern markets; stronger ROE and ROIC suggest better competitive positioning.
2. Capital Structure & Debt
Huntington Bancshares Incorporated
- Debt-to-equity ratio of 0.76 is moderate; interest coverage ratio at 0.62 signals risk in servicing debt.
Regions Financial Corporation
- Lower debt-to-equity ratio of 0.26 indicates conservative leverage; interest coverage at 1.32 provides greater cushion.
3. Stock Volatility
Huntington Bancshares Incorporated
- Beta near 0.97 implies stock moves roughly with the market; moderate volatility expected.
Regions Financial Corporation
- Slightly higher beta at 1.04 suggests marginally greater sensitivity to market swings.
4. Regulatory & Legal
Huntington Bancshares Incorporated
- Subject to standard U.S. regional banking regulations; no recent legal red flags reported.
Regions Financial Corporation
- Similar regulatory environment; no major legal challenges disclosed recently.
5. Supply Chain & Operations
Huntington Bancshares Incorporated
- Operational efficiency impacted by low asset turnover (0.06), indicating potential underutilization.
Regions Financial Corporation
- Matches HBAN’s asset turnover but benefits from higher fixed asset turnover, suggesting better asset use.
6. ESG & Climate Transition
Huntington Bancshares Incorporated
- No specific ESG risks flagged; exposure to regional economic shifts related to climate policies.
Regions Financial Corporation
- Comparable ESG risk exposure; some initiatives in place but climate transition remains a sector-wide challenge.
7. Geopolitical Exposure
Huntington Bancshares Incorporated
- Primarily U.S.-focused with limited international exposure, reducing geopolitical risk.
Regions Financial Corporation
- Also U.S.-centric, minimizing risks from global geopolitical tensions.
Which company shows a better risk-adjusted profile?
Regions Financial Corporation’s lower leverage and stronger profitability metrics reduce financial risk. Huntington’s weak interest coverage and low ROIC raise red flags. Both face typical regulatory and operational challenges, but RF’s higher Piotroski score (9 vs. 5) signals superior financial health. However, both remain in Altman’s distress zone, warranting caution.
Final Verdict: Which stock to choose?
Huntington Bancshares Incorporated (HBAN) wields unmatched operational efficiency and steady income generation as its superpower. However, its declining profitability and concerning liquidity ratios warrant vigilance. HBAN suits portfolios seeking aggressive growth with an appetite for risk amid structural challenges.
Regions Financial Corporation (RF) boasts a strategic moat through improving return on invested capital and a solid balance sheet, reflecting stronger financial health. Its relatively stable growth and superior profitability offer a safer profile compared to HBAN. RF fits well in GARP portfolios balancing growth with reasonable risk.
If you prioritize aggressive growth and can tolerate operational risks, HBAN’s efficiency and growth potential make it compelling. However, if you seek better stability and a durable competitive edge, RF outshines with improving profitability and financial strength, commanding a premium for risk-conscious investors.
Disclaimer: Investment carries a risk of loss of initial capital. The past performance is not a reliable indicator of future results. Be sure to understand risks before making an investment decision.
Go Further
I encourage you to read the complete analyses of Huntington Bancshares Incorporated and Regions Financial Corporation to enhance your investment decisions: