Home > Comparison > Financial Services > MTB vs HBAN
The strategic rivalry between M&T Bank Corporation and Huntington Bancshares Incorporated shapes the regional banking landscape in the U.S. M&T operates as a capital-intensive bank holding company with a diversified commercial and retail banking model. Huntington combines regional commercial banking with niche vehicle finance and private client services, reflecting a multi-segment approach. This analysis will clarify which bank’s operational trajectory offers superior risk-adjusted returns for a diversified financial portfolio.

Table of contents
Companies Overview
M&T Bank Corporation and Huntington Bancshares Incorporated stand as key players in the regional banking landscape, shaping financial services across multiple states.
M&T Bank Corporation: Established Regional Banking Powerhouse
M&T Bank Corporation anchors its identity as a regional bank holding company serving commercial and retail customers. Its core revenue derives from diversified banking segments including commercial lending, real estate loans, and wealth management. In 2021, M&T focused strategically on expanding commercial real estate services and enhancing digital banking capabilities across 688 offices.
Huntington Bancshares Incorporated: Diverse Regional Banking Innovator
Huntington Bancshares Incorporated operates as a multi-segment regional bank offering consumer, commercial, vehicle finance, and private client services. It generates revenue through a broad suite of deposit, loan, and asset finance products. In 2022, Huntington prioritized growth in specialty sectors like healthcare and technology, while scaling its branch network to about 1,000 locations across 11 states.
Strategic Collision: Similarities & Divergences
Both banks embrace a regional banking model but diverge on specialization—M&T prioritizes commercial real estate and wealth management, Huntington targets niche industries and vehicle finance. Their primary battleground is commercial and consumer lending in competitive Northeastern and Midwestern markets. Investors encounter distinct profiles: M&T’s stability from diversified services contrasts with Huntington’s growth-driven, multi-segment approach.
Income Statement Comparison
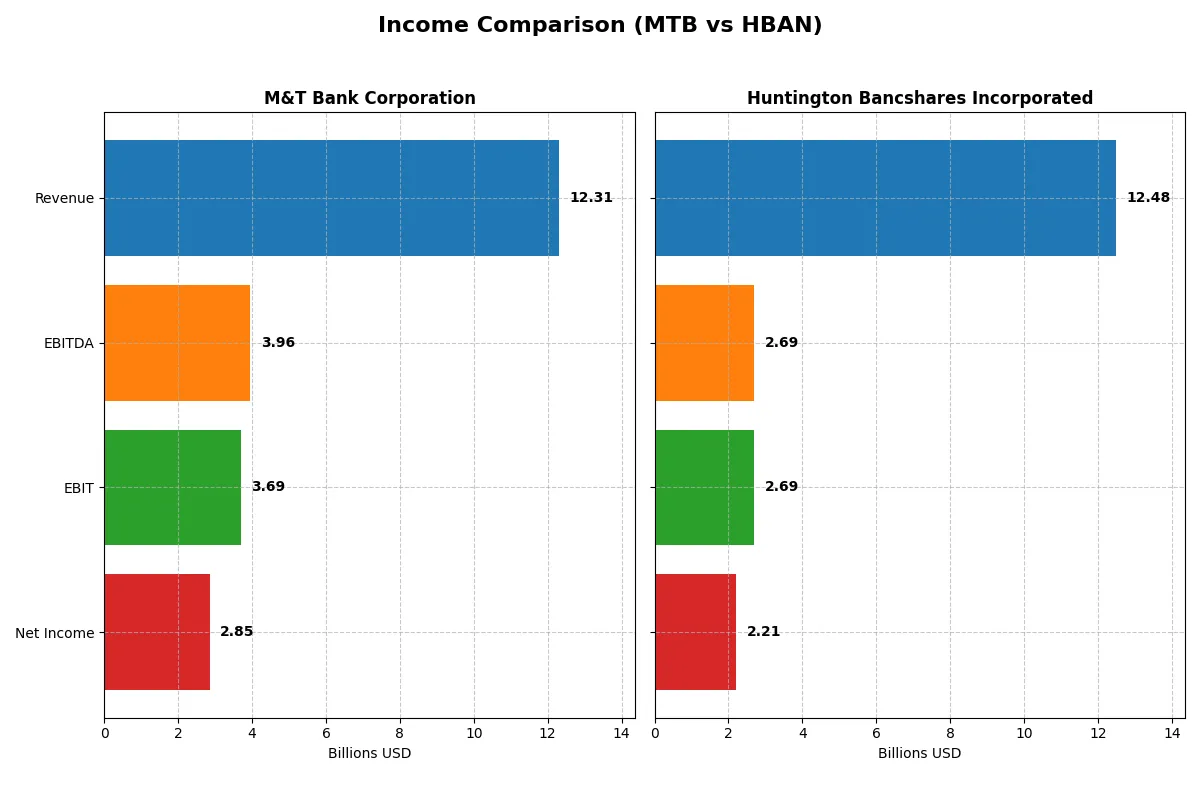
This data dissects the core profitability and scalability of both corporate engines to reveal who dominates the bottom line:
| Metric | M&T Bank Corporation (MTB) | Huntington Bancshares Incorporated (HBAN) |
|---|---|---|
| Revenue | 12.3B | 12.5B |
| Cost of Revenue | 3.12B | 4.78B |
| Operating Expenses | 5.49B | 5.02B |
| Gross Profit | 9.19B | 7.70B |
| EBITDA | 3.96B | 2.69B |
| EBIT | 3.69B | 2.69B |
| Interest Expense | 3.54B | 4.32B |
| Net Income | 2.85B | 2.21B |
| EPS | 17.1 | 1.41 |
| Fiscal Year | 2025 | 2025 |
Income Statement Analysis: The Bottom-Line Duel
This income statement comparison reveals which bank operates with greater efficiency and stronger profit momentum in a competitive financial sector.
M&T Bank Corporation Analysis
M&T Bank’s revenue grew 103% from 2021 to 2025 but declined 8.2% year-over-year in 2025. Despite this, net income rose 19.97% last year, boosting net margin to a healthy 23.16%. The bank sustains a robust gross margin of 74.6% and an EBIT margin near 30%, underscoring operational efficiency and solid profit generation in 2025.
Huntington Bancshares Incorporated Analysis
Huntington’s revenue increased steadily by 105% over five years, with a modest 4.4% rise in 2025. Its net income climbed 9.2% last year, yielding a 17.7% net margin. Huntington maintains a respectable 61.7% gross margin and a 21.5% EBIT margin, reflecting effective cost control despite slightly higher interest expenses relative to revenue.
Verdict: Margin Power vs. Revenue Scale
M&T Bank delivers superior margins and stronger net income growth despite recent revenue softness. Huntington shows steadier revenue momentum but with thinner profitability. For investors prioritizing margin strength and earnings efficiency, M&T’s profile stands out as the more compelling fundamental performer.
Financial Ratios Comparison
These vital ratios act as a diagnostic tool to expose the underlying fiscal health, valuation premiums, and capital efficiency of the companies compared below:
| Ratios | M&T Bank Corporation (MTB) | Huntington Bancshares Incorporated (HBAN) |
|---|---|---|
| ROE | 9.8% | 9.1% |
| ROIC | 6.8% | -1.7% |
| P/E | 11.5 | 11.6 |
| P/B | 1.13 | 1.05 |
| Current Ratio | 0.32 | 0.10 |
| Quick Ratio | 0.32 | 0.10 |
| D/E | 0.45 | 0.76 |
| Debt-to-Assets | 6.1% | 8.2% |
| Interest Coverage | 1.04 | 0.62 |
| Asset Turnover | 0.058 | 0.055 |
| Fixed Asset Turnover | 0 | 9.45 |
| Payout ratio | 33% | 41% |
| Dividend yield | 2.8% | 3.6% |
| Fiscal Year | 2025 | 2025 |
Efficiency & Valuation Duel: The Vital Signs
Financial ratios act as a company’s DNA, exposing hidden risks and operational strengths critical for investment insight.
M&T Bank Corporation
M&T Bank shows a solid net margin of 23.16%, indicating strong profitability, but a modest ROE of 9.77% lags behind ideal thresholds. The P/E of 11.54 and P/B of 1.13 suggest the stock trades at a reasonable valuation. The 2.83% dividend yield rewards shareholders, reflecting a balanced capital return approach.
Huntington Bancshares Incorporated
Huntington posts a respectable net margin of 17.71% and an ROE of 9.08%, though its negative ROIC signals inefficiency in capital use. Valuation multiples like P/E at 11.61 and P/B at 1.05 remain attractive. A 3.57% dividend yield provides income, compensating for weaker operational metrics and highlighting shareholder value focus.
Valuation Parity Meets Operational Contrast
Both banks trade at similar, reasonable valuations with attractive dividend yields, yet M&T Bank’s superior profitability and capital structure present a steadier risk-reward balance. Investors prioritizing operational efficiency might prefer M&T, while income-focused profiles could find Huntington’s dividend yield appealing despite its capital concerns.
Which one offers the Superior Shareholder Reward?
I compare M&T Bank Corporation (MTB) and Huntington Bancshares Incorporated (HBAN) on dividend yield, payout ratio, and buyback intensity. MTB yields 2.8% with a 33% payout ratio, supported by robust free cash flow and steady buybacks. HBAN offers a higher 3.6% yield but with a 41% payout ratio and less visible buyback activity. MTB’s disciplined capital allocation and buybacks suggest a more sustainable, balanced return. HBAN’s higher yield carries payout risks amid lower coverage ratios. I conclude MTB offers the superior total shareholder reward for 2026 investors.
Comparative Score Analysis: The Strategic Profile
The radar chart reveals the fundamental DNA and trade-offs of M&T Bank Corporation and Huntington Bancshares Incorporated:
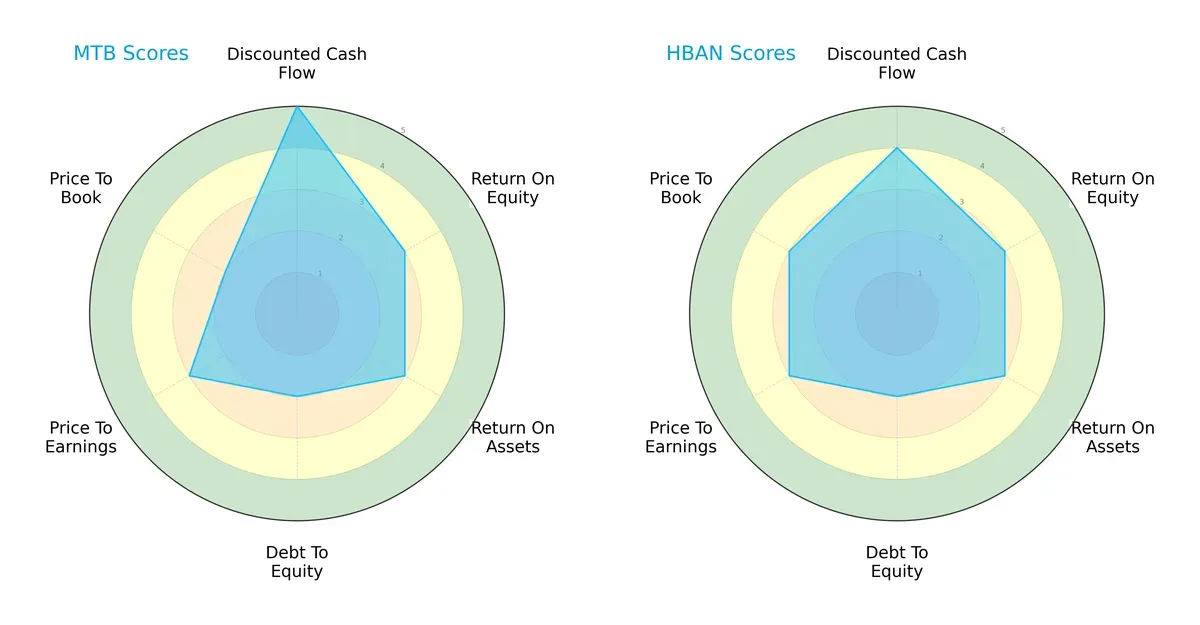
M&T Bank leads in discounted cash flow with a very favorable score of 5, signaling strong future cash generation. Both firms tie in return on equity and assets at moderate levels, reflecting similar operational efficiency. Huntington edges M&T slightly on price-to-book valuation, suggesting a marginally more attractive market price relative to book value. However, both companies show moderate debt-to-equity scores, indicating comparable leverage risks. Overall, M&T displays a more defined strength in cash flow, while Huntington offers a more balanced valuation profile.
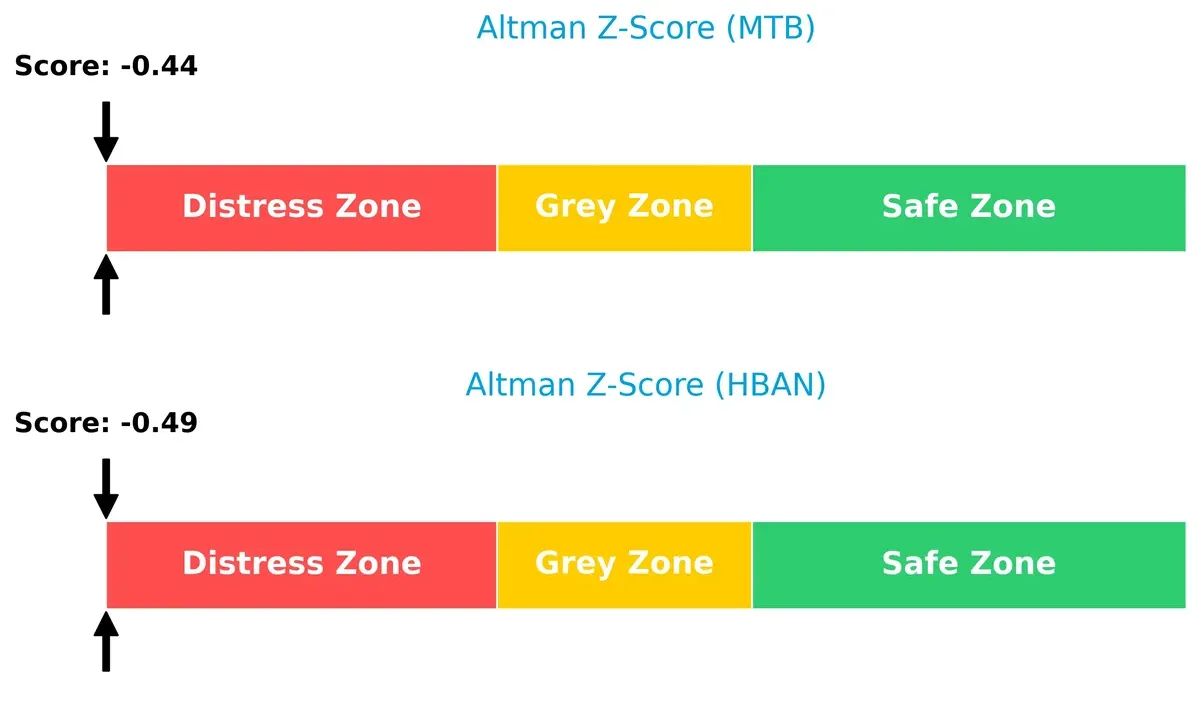
Bankruptcy Risk: Solvency Showdown
Both banks sit deep in the distress zone with Altman Z-Scores below zero, signaling significant financial distress and elevated bankruptcy risk in this economic cycle:
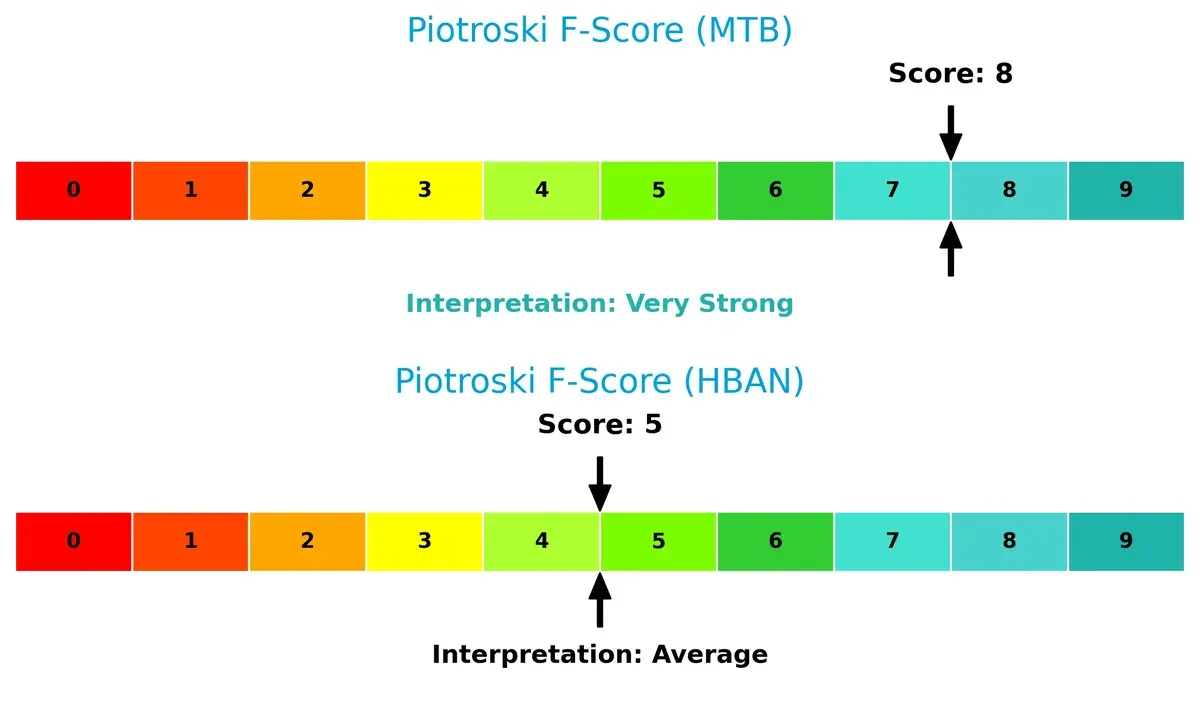
Financial Health: Quality of Operations
M&T Bank scores an 8 on the Piotroski scale, indicating very strong financial health and robust internal metrics. Huntington’s score of 5 is average, suggesting potential red flags or weaker operational fundamentals compared to M&T:
How are the two companies positioned?
This section dissects MTB and HBAN’s operational DNA by comparing revenue distribution and internal strengths and weaknesses. The goal is to confront their economic moats to reveal which model delivers the most resilient competitive advantage today.
Revenue Segmentation: The Strategic Mix
This visual comparison dissects how M&T Bank Corporation and Huntington Bancshares diversify their income streams and where their primary sector bets lie:
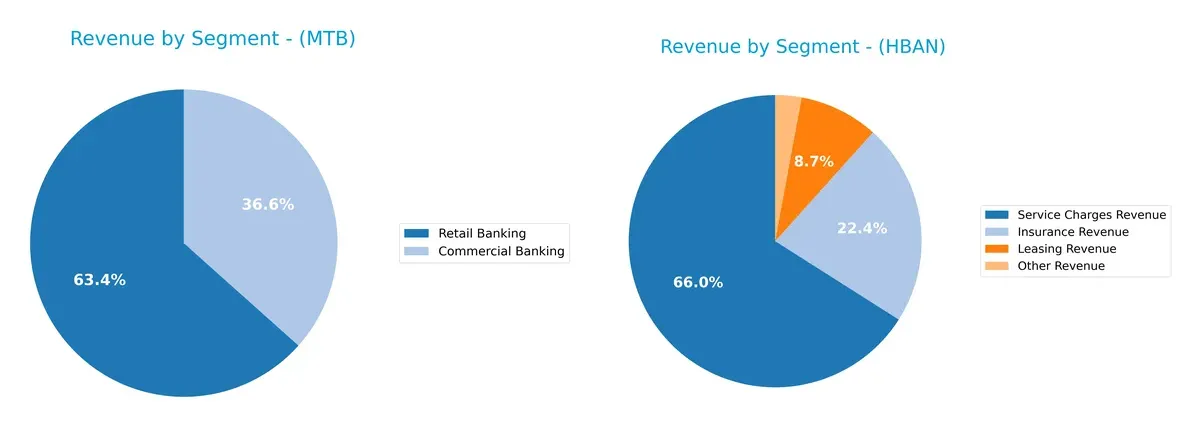
M&T Bank anchors its revenue heavily in Retail Banking at $471M and Commercial Banking at $272M, showing moderate diversification. Huntington Bancshares pivots around Service Charges Revenue of $227M but balances it with Insurance at $77M and Leasing at $30M, reflecting a broader mix. M&T’s focus risks concentration but strengthens core banking dominance, while Huntington’s spread mitigates risk with varied financial services exposure.
Strengths and Weaknesses Comparison
This table compares the Strengths and Weaknesses of M&T Bank Corporation (MTB) and Huntington Bancshares Incorporated (HBAN):
MTB Strengths
- Higher net margin at 23.16%
- Favorable PE at 11.54
- Favorable PB at 1.13
- Lower debt to assets at 6.12%
- Positive dividend yield at 2.83%
- Diverse revenue streams including commercial, retail, and fiduciary banking
HBAN Strengths
- Favorable net margin at 17.71%
- Favorable PE at 11.61
- Favorable PB at 1.05
- Favorable fixed asset turnover at 9.45
- Higher dividend yield at 3.57%
- Revenue from cards, insurance, leasing, and trust services
MTB Weaknesses
- Unfavorable ROE at 9.77% below WACC of 10.43%
- Poor current and quick ratios at 0.32
- Low interest coverage at 1.04
- Unfavorable asset and fixed asset turnover
- Slightly unfavorable global ratios overall
- Limited geographic diversification based on recent data
HBAN Weaknesses
- Negative ROIC at -1.69% below WACC of 12.76%
- Very low current and quick ratios at 0.1
- Low interest coverage at 0.62
- Unfavorable asset turnover
- High debt-to-equity ratio at 0.76 (neutral)
- Lack of reported geographic revenue diversification
M&T Bank exhibits stronger profitability margins and better leverage metrics but faces liquidity and efficiency challenges. Huntington shows strength in asset utilization and dividend yield but struggles with capital returns and liquidity. Both companies show limited geographic diversification, highlighting a potential strategic constraint.
The Moat Duel: Analyzing Competitive Defensibility
A structural moat is the only durable shield protecting long-term profits from relentless competitive erosion. Let’s dissect how M&T Bank and Huntington Bancshares defend their turf:
M&T Bank Corporation: Intangible Assets and Customer Relationships
M&T’s moat stems from deep regional brand loyalty and strong client ties. This manifests as stable margins and a historically solid gross margin near 75%. Yet, declining ROIC signals pressure. New market expansions in commercial real estate could either reinforce or strain this advantage in 2026.
Huntington Bancshares Incorporated: Cost Advantage and Scale Efficiency
Huntington leverages scale and cost discipline, evident in improving gross profits and expanding EPS. Unlike M&T, Huntington’s margin profile is thinner but growing revenue signals operational leverage. However, steep ROIC decline warns of eroding efficiency. Strategic growth in vehicle finance offers a chance to regain footing.
Verdict: Brand Loyalty vs. Cost Leadership in Regional Banking
Both banks face shrinking ROICs, signaling deteriorating moats. M&T’s intangible asset moat is deeper but under threat from market shifts. Huntington’s cost advantage is narrower and less durable. M&T remains better positioned to defend market share despite the headwinds.
Which stock offers better returns?
The past year shows strong bullish momentum for both stocks, with M&T Bank accelerating sharply while Huntington Bancshares posts steadier gains.
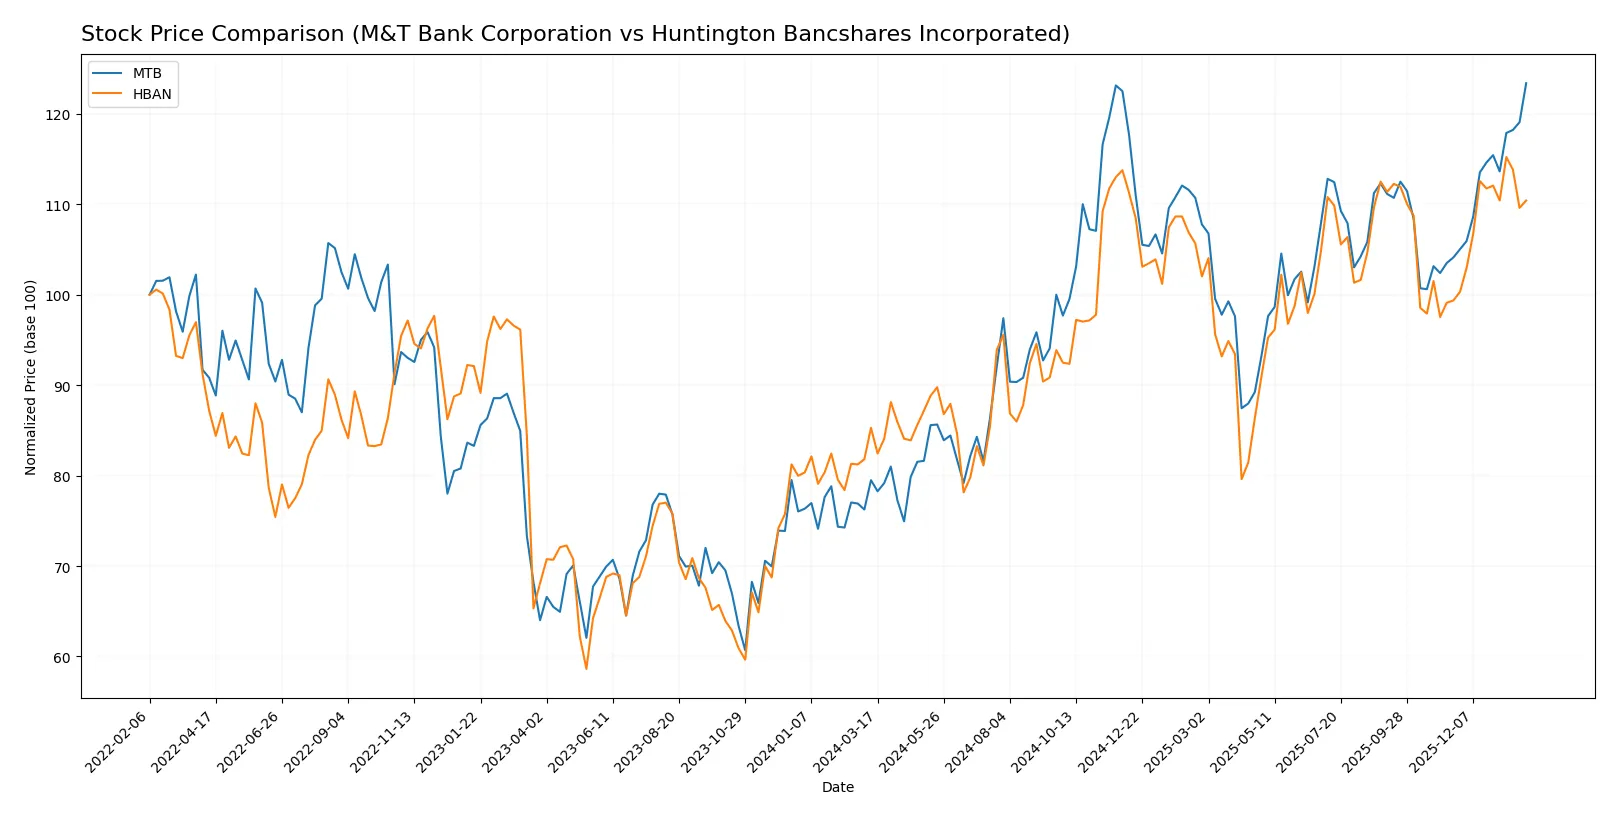
Trend Comparison
M&T Bank’s stock rose 55.23% over the past year, marking an accelerating bullish trend from a low of 134.56 to a high of 221.57, with a notable volatility of 21.88%.
Huntington Bancshares gained 29.48% over the same period, also accelerating but with much lower volatility at 1.59%, reaching a high of 18.24 from a low of 12.37.
M&T Bank outperformed Huntington Bancshares, delivering nearly double the return with higher volatility and a pronounced acceleration in price gains.
Target Prices
Analysts present a clear consensus on target prices for M&T Bank Corporation and Huntington Bancshares Incorporated.
| Company | Target Low | Target High | Consensus |
|---|---|---|---|
| M&T Bank Corporation | 208 | 255 | 230.8 |
| Huntington Bancshares | 16 | 23 | 20 |
The consensus target for M&T Bank at 230.8 exceeds its current price of 221.57, indicating moderate upside potential. Huntington’s consensus target of 20 also suggests room for appreciation from its current 17.48 price level.

Don’t Let Luck Decide Your Entry Point
Optimize your entry points with our advanced ProRealTime indicators. You’ll get efficient buy signals with precise price targets for maximum performance. Start outperforming now!
How do institutions grade them?
The following tables summarize recent institutional grades for M&T Bank Corporation and Huntington Bancshares Incorporated:
M&T Bank Corporation Grades
This table shows the latest grade actions from reputable analysts for M&T Bank Corporation.
| Grading Company | Action | New Grade | Date |
|---|---|---|---|
| RBC Capital | maintain | Outperform | 2026-01-20 |
| Jefferies | maintain | Buy | 2026-01-16 |
| Wolfe Research | downgrade | Peer Perform | 2026-01-07 |
| TD Cowen | maintain | Buy | 2026-01-07 |
| B of A Securities | downgrade | Neutral | 2026-01-07 |
| Evercore ISI Group | downgrade | In Line | 2026-01-06 |
| Barclays | maintain | Equal Weight | 2026-01-05 |
| Keefe, Bruyette & Woods | maintain | Market Perform | 2025-12-17 |
| Truist Securities | downgrade | Hold | 2025-12-12 |
| TD Cowen | maintain | Buy | 2025-10-20 |
Huntington Bancshares Incorporated Grades
This table presents recent institutional grades for Huntington Bancshares Incorporated.
| Grading Company | Action | New Grade | Date |
|---|---|---|---|
| Truist Securities | maintain | Buy | 2026-01-26 |
| Morgan Stanley | maintain | Overweight | 2026-01-23 |
| Keefe, Bruyette & Woods | maintain | Market Perform | 2026-01-23 |
| Barclays | maintain | Equal Weight | 2026-01-05 |
| RBC Capital | maintain | Outperform | 2025-12-19 |
| Piper Sandler | maintain | Underweight | 2025-12-10 |
| DA Davidson | maintain | Buy | 2025-10-28 |
| Keefe, Bruyette & Woods | maintain | Market Perform | 2025-10-20 |
| Raymond James | maintain | Strong Buy | 2025-10-20 |
| TD Cowen | maintain | Buy | 2025-10-20 |
Which company has the best grades?
Huntington Bancshares has received consistently stronger grades, including a “Strong Buy” and multiple “Buy” and “Outperform” ratings. M&T Bank shows more downgrades and neutral ratings, suggesting more cautious institutional sentiment. This divergence may influence investor confidence and portfolio decisions.
Risks specific to each company
The following categories identify the critical pressure points and systemic threats facing both firms in the 2026 market environment:
1. Market & Competition
M&T Bank Corporation
- Strong regional presence but faces intense competition from larger banks and fintech disruptors.
Huntington Bancshares Incorporated
- Larger branch network but higher beta suggests more sensitivity to market swings and competitive pressures.
2. Capital Structure & Debt
M&T Bank Corporation
- Conservative debt-to-assets ratio (6.12%) with moderate debt/equity of 0.45, supporting financial stability.
Huntington Bancshares Incorporated
- Slightly higher debt-to-assets (8.21%) and debt/equity (0.76) indicate more leverage risk, though interest coverage is weaker.
3. Stock Volatility
M&T Bank Corporation
- Low beta (0.58) signals less stock price volatility, appealing for risk-averse investors.
Huntington Bancshares Incorporated
- Beta near 1 (0.97) implies stock price moves closely with market, increasing volatility risk.
4. Regulatory & Legal
M&T Bank Corporation
- Operating in multiple states with complex compliance demands; relatively stable regulatory profile.
Huntington Bancshares Incorporated
- Similar multi-state exposure but NASDAQ listing may increase regulatory scrutiny and reporting standards.
5. Supply Chain & Operations
M&T Bank Corporation
- Established operational infrastructure with 688 offices; low asset turnover flags operational efficiency concerns.
Huntington Bancshares Incorporated
- 1,000 branches boost market reach; stronger fixed asset turnover suggests better asset utilization.
6. ESG & Climate Transition
M&T Bank Corporation
- Moderate ESG risk; no standout climate transition initiatives publicly noted, a potential emerging risk.
Huntington Bancshares Incorporated
- Slightly more progressive on asset utilization, but ESG policies remain a developing area with potential exposure.
7. Geopolitical Exposure
M&T Bank Corporation
- Limited international exposure reduces geopolitical risk; domestic banking focus aids stability.
Huntington Bancshares Incorporated
- Primarily domestic operations similarly limit geopolitical risk but broader state presence adds regulatory complexity.
Which company shows a better risk-adjusted profile?
M&T Bank demonstrates stronger capital discipline and lower stock volatility, mitigating risk in uncertain markets. Huntington Bancshares faces higher leverage and market sensitivity, raising caution. The most impactful risk for M&T is its weak liquidity ratios and operational efficiency. For Huntington, it is its high leverage combined with low interest coverage. Recent data show M&T’s current ratio at 0.32 and interest coverage barely above 1, signaling potential short-term liquidity strain. Huntington’s debt-to-equity of 0.76 and interest coverage below 1 amplify financial risk. Overall, M&T’s lower beta and prudent debt profile give it a better risk-adjusted stance despite operational weaknesses.
Final Verdict: Which stock to choose?
M&T Bank Corporation’s superpower lies in its ability to generate strong net margins and deliver consistent earnings growth, reflecting operational resilience. However, its declining ROIC relative to WACC signals value erosion, a point of vigilance for investors focused on capital efficiency. It suits portfolios aiming for aggressive growth with tolerance for operational risks.
Huntington Bancshares showcases a strategic moat through its solid recurring revenue base and prudent cost management, offering a more conservative risk profile than M&T. Despite weaker capital returns, its stable dividend yield and moderate valuation appeal to investors seeking GARP—growth tempered by reasonable price considerations.
If you prioritize operational efficiency and growth momentum, M&T Bank outshines due to its superior margin expansion and earnings trajectory. However, if you seek better stability and income with less capital efficiency risk, Huntington Bancshares offers a more balanced profile. Both present analytical scenarios for distinct investor appetites rather than clear-cut choices.
Disclaimer: Investment carries a risk of loss of initial capital. The past performance is not a reliable indicator of future results. Be sure to understand risks before making an investment decision.
Go Further
I encourage you to read the complete analyses of M&T Bank Corporation and Huntington Bancshares Incorporated to enhance your investment decisions: