Home > Comparison > Financial Services > HBAN vs KEY
The strategic rivalry between Huntington Bancshares Incorporated and KeyCorp shapes the competitive landscape of regional banking in the U.S. Huntington operates as a diversified financial services provider with strong vehicle finance and private client segments. KeyCorp emphasizes a balanced approach across consumer and commercial banking with a significant footprint in capital markets. This analysis examines which model offers superior risk-adjusted returns, guiding investors seeking stable exposure in the evolving financial services sector.
Table of contents
Companies Overview
Huntington Bancshares and KeyCorp stand as key regional banks shaping the Midwest financial landscape.
Huntington Bancshares Incorporated: Diversified Regional Banking Powerhouse
Huntington Bancshares dominates as a regional bank with a diverse revenue mix spanning consumer, commercial, vehicle finance, and private client services. It generates income through lending, deposit accounts, and treasury management. In 2026, Huntington sharpens its focus on expanding digital capabilities and targeted industry lending, reinforcing its competitive edge in middle-market commercial banking.
KeyCorp: Comprehensive Banking with Capital Market Depth
KeyCorp holds a prominent position as a regional bank offering retail and commercial banking along with capital market solutions. Its revenue stems from deposit products, loans, wealth management, and investment banking. KeyCorp’s strategic emphasis in 2026 lies in enhancing technology-driven financial wellness tools and growing its middle-market commercial loan portfolio across diverse sectors.
Strategic Collision: Similarities & Divergences
Both banks embrace a broad financial services model targeting retail and commercial clients, but Huntington leans more into vehicle and private client finance, whereas KeyCorp integrates capital markets and advisory services. Their primary battleground is regional commercial lending, where customer relationships and technology platforms matter most. Investors face distinct profiles: Huntington offers diversified segment exposure, while KeyCorp blends banking with capital market sophistication.
Income Statement Comparison
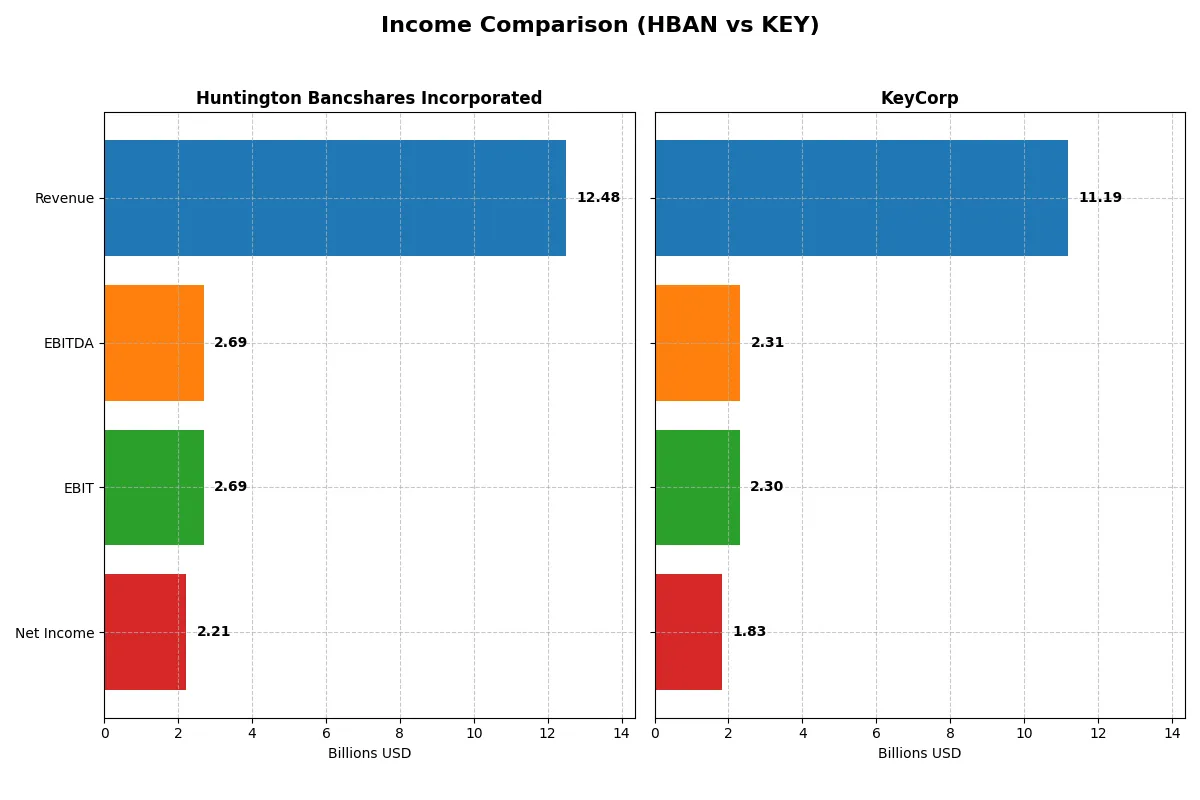
This data dissects the core profitability and scalability of both corporate engines to reveal who dominates the bottom line:
| Metric | Huntington Bancshares (HBAN) | KeyCorp (KEY) |
|---|---|---|
| Revenue | 12.5B | 11.2B |
| Cost of Revenue | 4.8B | 4.2B |
| Operating Expenses | 5.0B | 4.7B |
| Gross Profit | 7.7B | 6.9B |
| EBITDA | 2.7B | 2.3B |
| EBIT | 2.7B | 2.3B |
| Interest Expense | 4.3B | 3.8B |
| Net Income | 2.2B | 1.8B |
| EPS | 1.41 | 1.66 |
| Fiscal Year | 2025 | 2025 |
Income Statement Analysis: The Bottom-Line Duel
This income statement comparison reveals which bank operates its financial engine with superior efficiency and growth momentum.
Huntington Bancshares Incorporated Analysis
Huntington Bancshares displays steady revenue growth, reaching $12.5B in 2025, with net income climbing to $2.2B. Its gross margin remains strong at 61.7%, and the net margin of 17.7% signals healthy profitability. The 2025 results show solid momentum with a 10.6% gross profit increase and a favorable 11.9% rise in EBIT, reflecting operational efficiency despite a high interest expense ratio.
KeyCorp Analysis
KeyCorp’s revenue surged 23.6% to $11.2B in 2025, with net income rebounding to $1.8B after a prior loss. It maintains a robust gross margin of 62.3% and a net margin of 16.4%. The sharp one-year EBIT growth of 853% and a 1019% net margin increase highlight a strong recovery and operational leverage. However, over five years, net income and margins have declined, indicating longer-term challenges.
Growth Resilience vs. Operational Stability
Huntington Bancshares leads with consistent revenue and net income growth over the last five years, coupled with stable, favorable margins. KeyCorp impresses with rapid recent improvements and margin expansion but struggles with longer-term net income erosion. For investors prioritizing steady, proven profitability, Huntington’s profile appears more attractive.
Financial Ratios Comparison
These vital ratios act as a diagnostic tool to expose the underlying fiscal health, valuation premiums, and capital efficiency of these two regional banks:
| Ratios | Huntington Bancshares Incorporated (HBAN) | KeyCorp (KEY) |
|---|---|---|
| ROE | 9.08% | 8.97% |
| ROIC | -1.69% | 5.83% |
| P/E | 11.61 | 12.36 |
| P/B | 1.05 | 1.11 |
| Current Ratio | 0.10 | 0.77 |
| Quick Ratio | 0.10 | 0.77 |
| D/E | 0.76 | 0.54 |
| Debt-to-Assets | 8.21% | 5.97% |
| Interest Coverage | 0.62 | 0.61 |
| Asset Turnover | 0.055 | 0.061 |
| Fixed Asset Turnover | 9.45 | 17.82 |
| Payout ratio | 41.47% | 49.10% |
| Dividend yield | 3.57% | 3.97% |
| Fiscal Year | 2025 | 2025 |
Efficiency & Valuation Duel: The Vital Signs
Financial ratios act as a company’s DNA, uncovering hidden risks and revealing operational strengths critical for investors.
Huntington Bancshares Incorporated
Huntington shows a modest 9.08% ROE, reflecting moderate profitability. Its P/E of 11.61 and P/B of 1.05 signal a reasonably priced stock. The 17.71% net margin is favorable, yet negative ROIC versus a 12.76% WACC indicates poor capital efficiency. A 3.57% dividend yield rewards shareholders steadily.
KeyCorp
KeyCorp posts a slightly lower 8.97% ROE and a 16.35% net margin, indicating solid profitability. Its P/E ratio of 12.36 and P/B of 1.11 suggest fair valuation but marginally pricier than Huntington. Key offers a higher 3.97% dividend yield and neutral ROIC at 5.83%, showing balanced capital returns.
Valuation Discipline vs. Capital Efficiency
Huntington’s valuation is more attractive, with a stronger dividend and favorable margins but struggles with capital returns. KeyCorp presents a neutral stance with better ROIC and slightly higher dividend yield, balancing risk and reward for income-focused investors. The choice depends on preference for valuation discipline or capital efficiency.
Which one offers the Superior Shareholder Reward?
I see Huntington Bancshares (HBAN) offers a 3.57% dividend yield with a 41% payout ratio, supported by solid free cash flow coverage. Its buyback program is moderate but consistent. KeyCorp (KEY) yields 3.97% with a 49% payout ratio, but its free cash flow coverage is uncertain due to volatile margins. HBAN’s distribution model balances dividends and buybacks more sustainably. Despite KEY’s slightly higher yield, HBAN’s stable payout and prudent capital allocation suggest superior long-term shareholder reward in 2026.
Comparative Score Analysis: The Strategic Profile
The radar chart reveals the fundamental DNA and trade-offs of Huntington Bancshares Incorporated and KeyCorp:
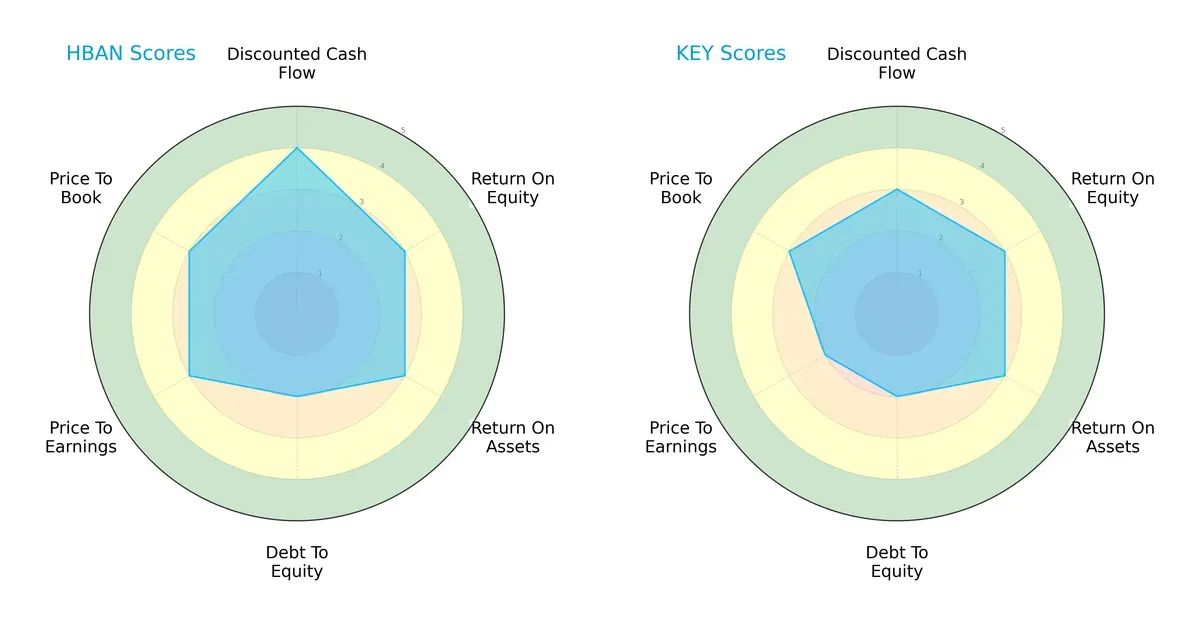
Huntington shows a stronger discounted cash flow score (4 vs. 3), indicating better future cash flow projections. Both firms tie on return on equity and assets (3 each), reflecting similar operational efficiency. Debt-to-equity scores are equally moderate (2), signaling comparable leverage risk. Huntington edges out KeyCorp in valuation metrics, with a higher P/E score (3 vs. 2), suggesting relatively better market pricing. Overall, Huntington presents a more balanced profile; KeyCorp relies more on core operational efficiency.
Bankruptcy Risk: Solvency Showdown
The Altman Z-Score comparison highlights both banks in distress zones, with Huntington at -0.49 and KeyCorp slightly higher at 0.07:
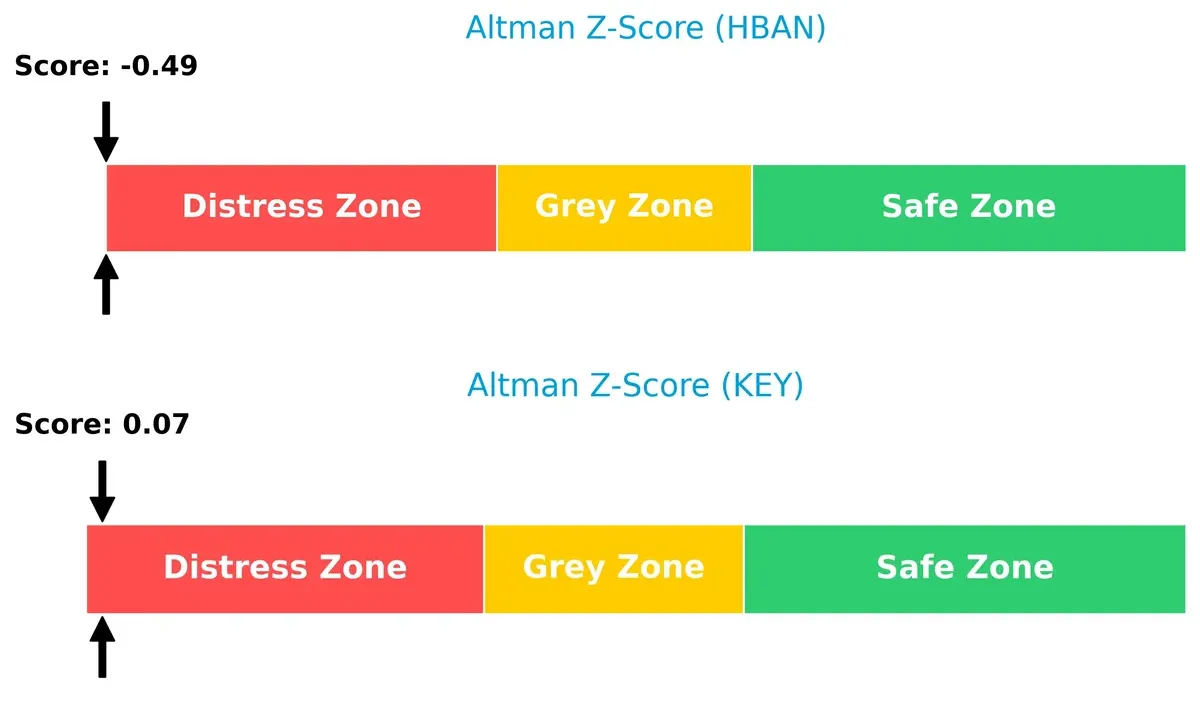
These scores imply elevated bankruptcy risk for both firms in this economic cycle. KeyCorp’s marginally better score suggests a slightly stronger solvency position, but neither bank is comfortably safe. Vigilance is essential given sector volatility.
Financial Health: Quality of Operations
Piotroski F-Scores reveal Huntington at 5 (average) and KeyCorp at 7 (strong):
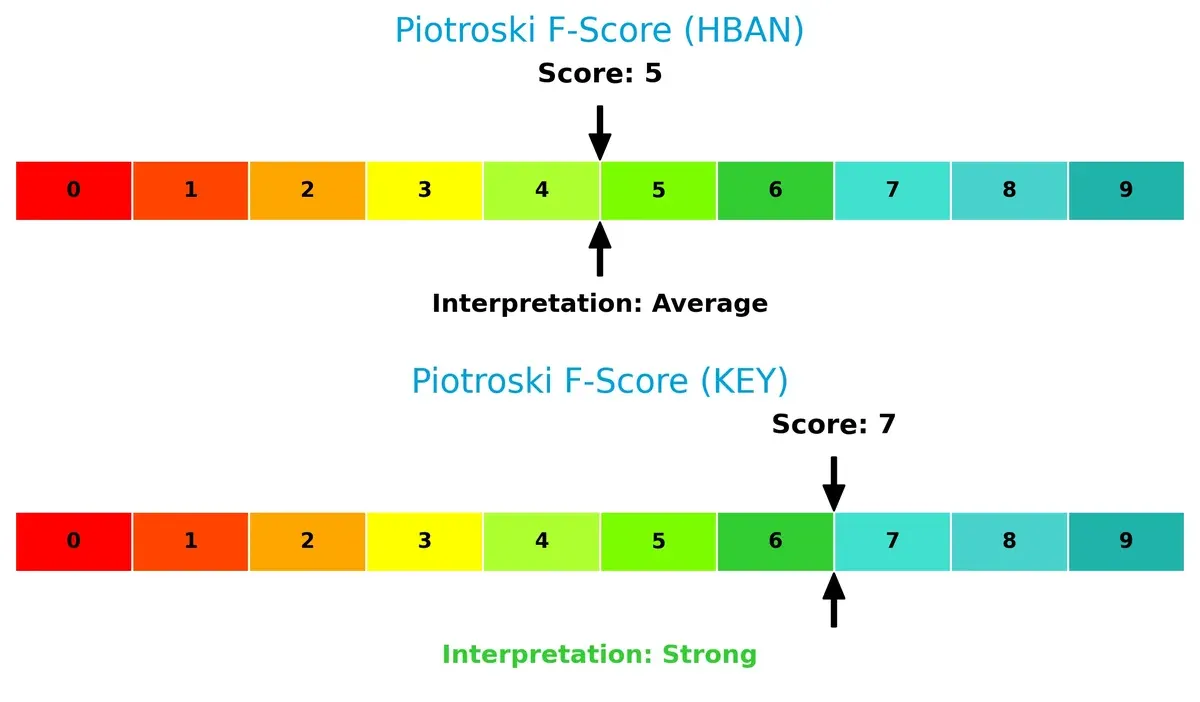
KeyCorp demonstrates superior financial health and operational quality, indicating fewer internal red flags. Huntington’s average score signals caution, as some metrics could deteriorate if headwinds persist. Investors should weigh this gap carefully.
How are the two companies positioned?
This section dissects HBAN and KEY’s operational DNA by comparing their revenue distribution and internal dynamics. The goal is to confront their economic moats to identify the more resilient and sustainable competitive advantage today.
Revenue Segmentation: The Strategic Mix
This visual comparison dissects how Huntington Bancshares and KeyCorp diversify their income streams and where their primary sector bets lie:
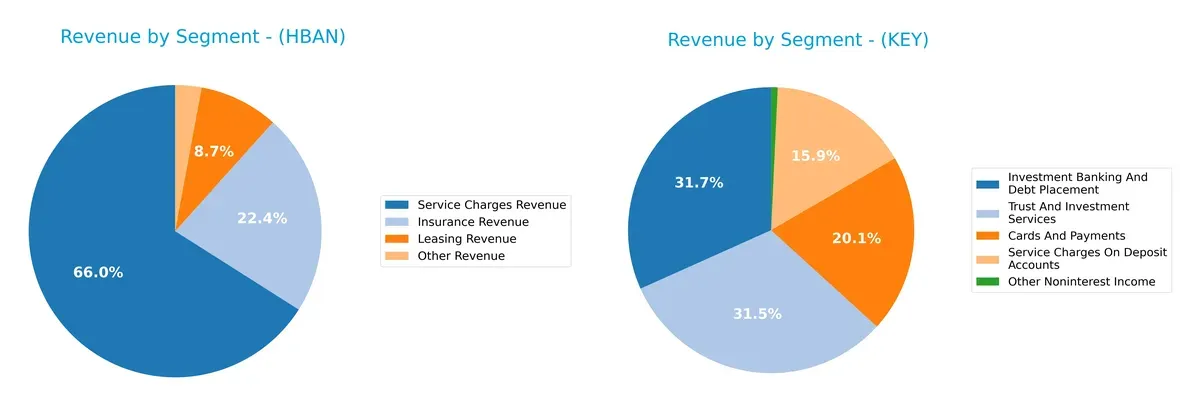
Huntington Bancshares anchors revenue in service charges at $227M, with smaller bets in insurance ($77M) and leasing ($30M). KeyCorp boasts a more diversified portfolio with investment banking ($521M), trust services ($518M), and service charges ($261M) all sizable. KeyCorp’s spread reduces concentration risk, while Huntington’s focus on service fees signals reliance on transactional volume and regional banking strength. KeyCorp’s diversity suggests strategic ecosystem lock-in across banking and advisory services.
Strengths and Weaknesses Comparison
This table compares the Strengths and Weaknesses of Huntington Bancshares Incorporated (HBAN) and KeyCorp (KEY):
HBAN Strengths
- Higher net margin at 17.71%
- Favorable PE and PB ratios near 11.6 and 1.05
- Lower debt-to-assets at 8.21%
- Strong fixed asset turnover 9.45
- Dividend yield at 3.57% supports income
KEY Strengths
- Solid net margin at 16.35%
- Favorable PE and PB ratios at 12.36 and 1.11
- Lower debt-to-assets at 5.97%
- Superior fixed asset turnover 17.82
- Higher dividend yield at 3.97%
- Diversified revenue including investment banking and trust services
HBAN Weaknesses
- Negative ROIC at -1.69% below WACC 12.76%
- Low current and quick ratios at 0.1 indicate liquidity risk
- Interest coverage under 1 at 0.62
- Low asset turnover 0.06
- ROE weak at 9.08%
- 50% ratios unfavorable overall
KEY Weaknesses
- ROIC moderate at 5.83% below WACC 14.27%
- Low current and quick ratios at 0.77 show liquidity constraints
- Interest coverage 0.61 below 1
- Low asset turnover 0.06
- ROE weak at 8.97%
- 42.86% ratios unfavorable overall
Both banks show strengths in valuation metrics and dividend yield but face liquidity and profitability challenges. KEY’s broader revenue segmentation and higher asset turnover suggest better operational efficiency, while HBAN’s negative ROIC signals deeper capital allocation issues. These factors shape their strategic priorities in managing risk and enhancing returns.
The Moat Duel: Analyzing Competitive Defensibility
A structural moat is the only true shield protecting long-term profits from relentless competitive erosion in banking:
Huntington Bancshares Incorporated: Cost Advantage in Regional Banking
I see Huntington’s moat mainly in its cost advantage, reflected by stable gross margins near 62% and consistent net margin growth. Yet, its declining ROIC signals a shrinking edge. In 2026, new digital offerings could either deepen or further erode this cost moat.
KeyCorp: Diversified Service Moat with Growth Potential
KeyCorp’s moat stems from its diversified financial services, shown by strong revenue growth (23.6% last year) and impressive EBIT expansion. Unlike Huntington, Key’s broader service mix fuels higher growth but its declining ROIC warns of value destruction ahead. Expansion into wealth management may stabilize margins.
Regional Banking: Cost Efficiency vs. Service Diversification
Both banks face declining ROICs, shedding value despite favorable margins. Huntington’s cost advantage is narrower but steadier. Key’s wider moat lies in service diversification and growth, yet it struggles to convert that into lasting returns. Huntington is better positioned to defend market share through cost control.
Which stock offers better returns?
Over the past year, both Huntington Bancshares and KeyCorp exhibited strong price gains with accelerating bullish trends and increasing trading volumes, highlighting robust investor interest and price momentum.
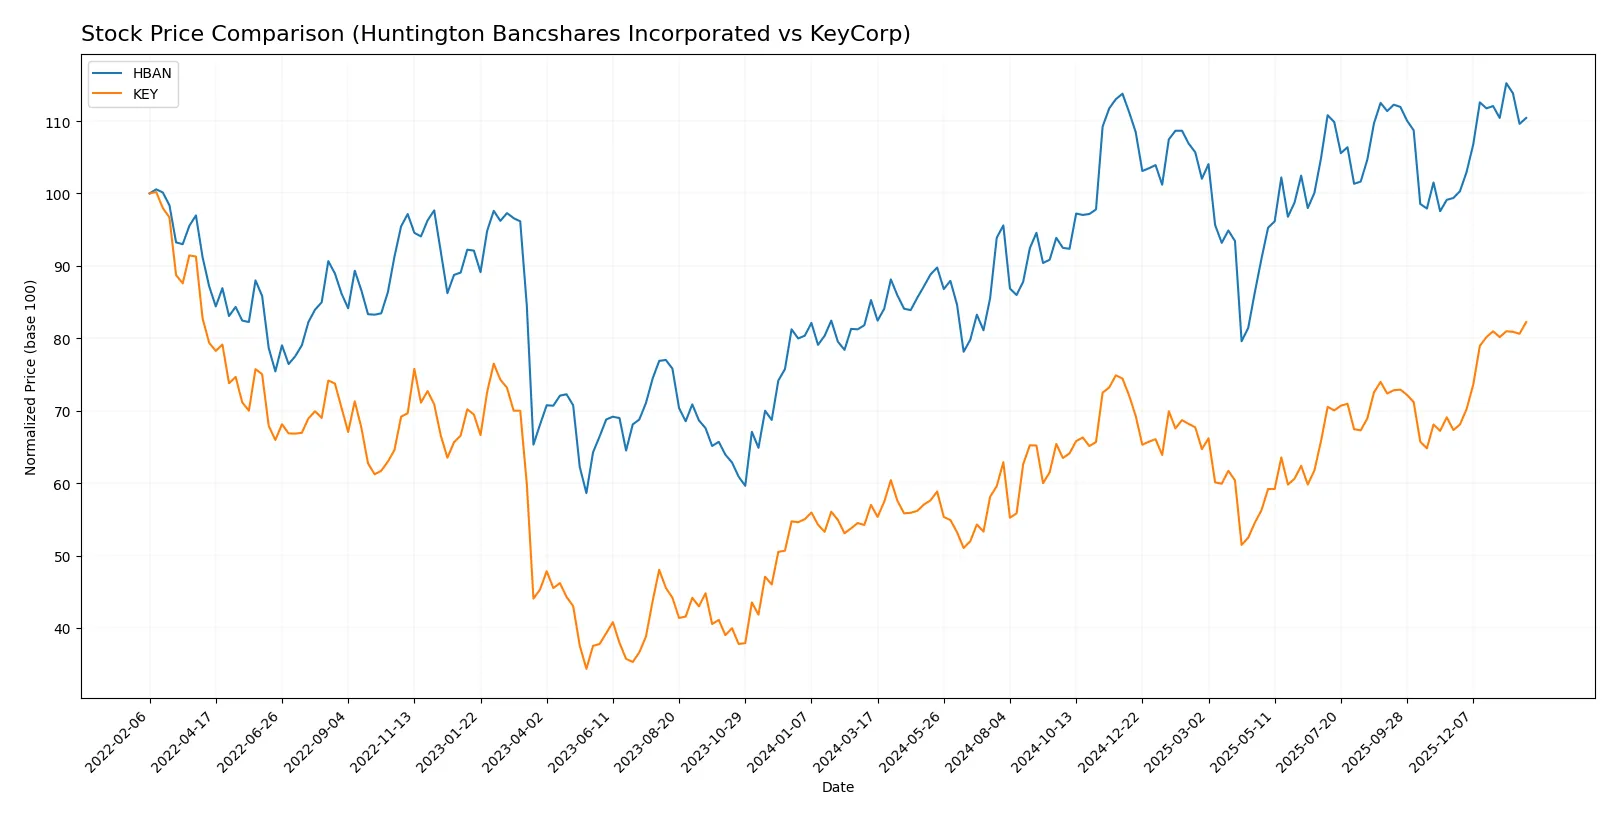
Trend Comparison
Huntington Bancshares shows a 29.48% price increase over 12 months, marking a bullish trend with accelerating momentum and a moderate volatility of 1.59, reaching a high of 18.24 and a low of 12.37.
KeyCorp outperformed with a 44.24% price gain over the same period, also bullish with acceleration, higher volatility at 2.0, and a price range between 13.36 and 21.52, indicating stronger upward momentum.
Comparatively, KeyCorp delivers the highest market performance, with a larger price increase and greater recent acceleration than Huntington Bancshares over the past year.
Target Prices
Analysts present a moderately bullish consensus on Huntington Bancshares and KeyCorp with target prices above current levels.
| Company | Target Low | Target High | Consensus |
|---|---|---|---|
| Huntington Bancshares Incorporated | 16 | 23 | 20 |
| KeyCorp | 18 | 25 | 23.38 |
Huntington Bancshares trades at 17.48, below its 20 consensus target, indicating upside potential. KeyCorp’s 21.52 price also lags its 23.38 consensus, suggesting room for appreciation.

Don’t Let Luck Decide Your Entry Point
Optimize your entry points with our advanced ProRealTime indicators. You’ll get efficient buy signals with precise price targets for maximum performance. Start outperforming now!
How do institutions grade them?
This section compares the latest institutional grades assigned to Huntington Bancshares Incorporated and KeyCorp:
Huntington Bancshares Incorporated Grades
The table below shows recent grade actions from major grading firms for HBAN:
| Grading Company | Action | New Grade | Date |
|---|---|---|---|
| Truist Securities | Maintain | Buy | 2026-01-26 |
| Morgan Stanley | Maintain | Overweight | 2026-01-23 |
| Keefe, Bruyette & Woods | Maintain | Market Perform | 2026-01-23 |
| Barclays | Maintain | Equal Weight | 2026-01-05 |
| RBC Capital | Maintain | Outperform | 2025-12-19 |
| Piper Sandler | Maintain | Underweight | 2025-12-10 |
| DA Davidson | Maintain | Buy | 2025-10-28 |
| Keefe, Bruyette & Woods | Maintain | Market Perform | 2025-10-20 |
| Raymond James | Maintain | Strong Buy | 2025-10-20 |
| TD Cowen | Maintain | Buy | 2025-10-20 |
KeyCorp Grades
Below are recent institutional grade updates for KEY:
| Grading Company | Action | New Grade | Date |
|---|---|---|---|
| Truist Securities | Maintain | Hold | 2026-01-26 |
| TD Cowen | Maintain | Buy | 2026-01-07 |
| Baird | Downgrade | Underperform | 2026-01-06 |
| Barclays | Maintain | Equal Weight | 2026-01-05 |
| Truist Securities | Maintain | Hold | 2025-12-22 |
| Keefe, Bruyette & Woods | Maintain | Outperform | 2025-12-17 |
| DA Davidson | Maintain | Buy | 2025-12-10 |
| Truist Securities | Maintain | Hold | 2025-10-17 |
| DA Davidson | Maintain | Buy | 2025-10-17 |
| UBS | Maintain | Buy | 2025-10-07 |
Which company has the best grades?
Huntington Bancshares exhibits a stronger consensus with multiple “Buy” and “Outperform” ratings, including a “Strong Buy.” KeyCorp’s grades are mixed, featuring several “Hold” and one “Underperform.” Investors might interpret Huntington’s more favorable grades as a sign of better near-term confidence from analysts.
Risks specific to each company
The following categories identify the critical pressure points and systemic threats facing both firms in the 2026 market environment:
1. Market & Competition
Huntington Bancshares Incorporated
- Faces intense regional banking competition with moderate market cap of 27.5B.
KeyCorp
- Competes across 15 states with a slightly smaller 23.7B market cap.
2. Capital Structure & Debt
Huntington Bancshares Incorporated
- Debt-to-assets favorable at 8.21%, but weak interest coverage at 0.62 signals risk.
KeyCorp
- Lower debt-to-assets at 5.97%, but similarly weak interest coverage at 0.61.
3. Stock Volatility
Huntington Bancshares Incorporated
- Beta near market at 0.97, indicating moderate volatility.
KeyCorp
- Beta above 1 at 1.08, suggesting higher sensitivity to market swings.
4. Regulatory & Legal
Huntington Bancshares Incorporated
- Subject to U.S. banking regulations with potential regional regulatory pressures.
KeyCorp
- Also under U.S. banking regulations but with a broader geographic footprint increasing complexity.
5. Supply Chain & Operations
Huntington Bancshares Incorporated
- Operates ~1,000 branches in 11 states; operational scale moderate and focused.
KeyCorp
- Operates ~999 branches in 15 states; wider state presence increases operational complexity.
6. ESG & Climate Transition
Huntington Bancshares Incorporated
- No explicit ESG data; risks likely tied to regional banking sector’s transition pressures.
KeyCorp
- Similar ESG risks, with potential for greater exposure due to broader commercial lending footprint.
7. Geopolitical Exposure
Huntington Bancshares Incorporated
- Primarily U.S.-based, limiting direct geopolitical risk but exposed to domestic economic shifts.
KeyCorp
- Also U.S.-centric, but broader client base may slightly increase sensitivity to regional economic policies.
Which company shows a better risk-adjusted profile?
Huntington’s weak interest coverage and distress-zone Altman Z-score highlight financial vulnerability. KeyCorp’s stronger Piotroski score and lower debt levels suggest better financial resilience. Despite higher volatility, KeyCorp presents a more balanced risk profile given its stronger financial metrics and operational scale.
Final Verdict: Which stock to choose?
Huntington Bancshares Incorporated’s superpower lies in its consistent ability to generate solid net margins and a favorable income statement, making it a resilient cash machine. However, its very low current ratio signals liquidity risk, a point of vigilance. It fits well within an aggressive growth portfolio willing to tolerate short-term balance sheet pressures.
KeyCorp’s strategic moat is its stronger capital efficiency, reflected in a better ROIC relative to its cost of capital, and a notably stronger Piotroski score signaling improved financial health. It offers a safer profile than Huntington, appealing to investors favoring GARP—growth at a reasonable price—with a tilt toward stability.
If you prioritize aggressive growth fueled by solid earnings and market momentum, Huntington Bancshares is the compelling choice due to its robust income generation despite liquidity constraints. However, if you seek a more balanced approach with better capital efficiency and financial strength, KeyCorp offers better stability and a stronger value proposition, though it commands a premium for that safety.
Disclaimer: Investment carries a risk of loss of initial capital. The past performance is not a reliable indicator of future results. Be sure to understand risks before making an investment decision.
Go Further
I encourage you to read the complete analyses of Huntington Bancshares Incorporated and KeyCorp to enhance your investment decisions: