Home > Comparison > Healthcare > HUM vs MOH
The strategic rivalry between Humana Inc. and Molina Healthcare, Inc. shapes the healthcare plans industry landscape. Humana operates as a diversified health and well-being company with broad retail and specialty offerings. Molina focuses on managed care for low-income populations under government programs. This head-to-head reflects a contrast between scale-driven diversification and targeted government program specialization. This analysis will identify which trajectory offers superior risk-adjusted returns for a diversified portfolio.

Table of contents
Companies Overview
Humana and Molina Healthcare stand as pivotal players in the U.S. healthcare plans sector, commanding significant market influence.
Humana Inc.: Integrated Health and Well-Being Leader
Humana dominates the healthcare plans market through a diversified model spanning Retail, Group and Specialty, and Healthcare Services. Its core revenue derives from medical and supplemental benefit plans offered to roughly 22M members, including Medicare and Medicaid contracts. In 2021, Humana sharpened its focus on expanding specialty products and home health services, reinforcing its integrated care approach.
Molina Healthcare, Inc.: Medicaid and Medicare Specialist
Molina Healthcare excels in serving low-income families via managed Medicaid, Medicare, and state marketplace programs. Its revenue is driven by government-sponsored health plans, covering about 5.2M members across 18 states. In 2021, Molina prioritized scaling Medicaid and Medicare segments, capitalizing on its deep expertise in public healthcare programs.
Strategic Collision: Similarities & Divergences
Both companies thrive in government-linked healthcare but diverge in scope; Humana pursues a broad, integrated health model, while Molina focuses narrowly on Medicaid and Medicare populations. Their primary battleground is expanding membership within government programs. Humana offers a diversified, scale-driven profile, contrasting with Molina’s specialized, targeted market approach.
Income Statement Comparison
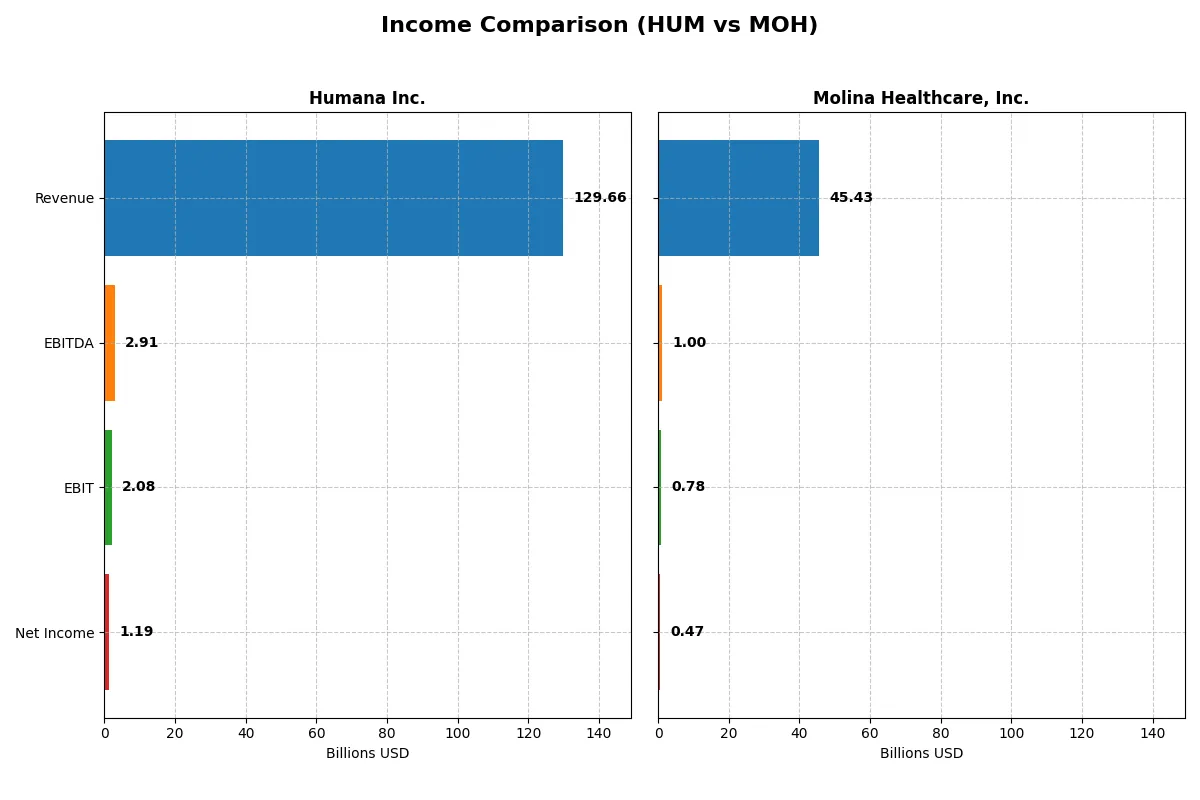
The following data dissects the core profitability and scalability of both corporate engines to reveal who dominates the bottom line:
| Metric | Humana Inc. (HUM) | Molina Healthcare, Inc. (MOH) |
|---|---|---|
| Revenue | 130B | 45.4B |
| Cost of Revenue | 111B | 40.8B |
| Operating Expenses | 17.4B | 3.83B |
| Gross Profit | 18.9B | 4.61B |
| EBITDA | 2.91B | 996M |
| EBIT | 2.08B | 783M |
| Interest Expense | 631M | 194M |
| Net Income | 1.19B | 472M |
| EPS | 9.87 | 8.93 |
| Fiscal Year | 2025 | 2025 |
Income Statement Analysis: The Bottom-Line Duel
This income statement comparison reveals how Humana Inc. and Molina Healthcare, Inc. convert revenue into profit, exposing their operational efficiency.
Humana Inc. Analysis
Humana’s revenue climbs steadily, reaching $130B in 2025, yet net income plunges to $1.19B, signaling margin compression. Gross margin stands at a modest 14.5%, and net margin tightens to 0.92%. Despite 10% revenue growth in 2025, declines in gross profit and EBIT suggest weakening operational efficiency and margin pressure.
Molina Healthcare, Inc. Analysis
Molina’s revenue expands to $45.4B in 2025, up 12% year-over-year, but net income drops sharply to $472M. Gross margin at 10.2% and net margin at 1.04% indicate slim profitability. The steep 54% EBIT decline reveals severe margin erosion, reflecting operational challenges despite solid top-line growth.
Margin Strength vs. Revenue Expansion
Humana commands a larger revenue base but suffers sharper profit declines and margin contraction. Molina’s smaller scale shows similar margin struggles but maintains a slightly better net margin. Humana’s profile suits investors favoring scale, while Molina’s is more attractive for those eyeing higher margin resilience amid revenue growth.
Financial Ratios Comparison
These vital ratios act as a diagnostic tool to expose the underlying fiscal health, valuation premiums, and capital efficiency of the companies compared here:
| Ratios | Humana Inc. (HUM) | Molina Healthcare, Inc. (MOH) |
|---|---|---|
| ROE | 7.37% (2024) | 26.22% (2024) |
| ROIC | N/A | 16.38% (2024) |
| P/E | 25.34 (2024) | 14.17 (2024) |
| P/B | 1.87 (2024) | 3.72 (2024) |
| Current Ratio | N/A | 1.62 (2024) |
| Quick Ratio | N/A | 1.62 (2024) |
| D/E (Debt-to-Equity) | 0.68 (2024) | 0.69 (2024) |
| Debt-to-Assets | 24.0% (2024) | 20.0% (2024) |
| Interest Coverage | 2.61 (2024) | 14.47 (2024) |
| Asset Turnover | 2.53 (2024) | 2.60 (2024) |
| Fixed Asset Turnover | 39.56 (2024) | 141.15 (2024) |
| Payout ratio | 35.7% (2024) | 0% (2024) |
| Dividend yield | 1.41% (2024) | 0% (2024) |
| Fiscal Year | 2024 | 2024 |
Efficiency & Valuation Duel: The Vital Signs
Financial ratios serve as the company’s DNA, exposing hidden operational strengths and risks that numbers alone can’t reveal. They provide essential insight into profitability, valuation, and shareholder value creation.
Humana Inc.
Humana’s profitability metrics underwhelm with a 0% ROE and a thin net margin near 0.92%, signaling operational challenges. The stock trades at a stretched P/E of 26, suggesting elevated market expectations. Dividend yield stands modest at 1.39%, reflecting a conservative payout amid reinvestment needs. Overall, Humana struggles to convert assets efficiently into returns.
Molina Healthcare, Inc.
Molina Healthcare posts a neutral 11.6% ROE and a slightly unfavorable net margin of 1.04%, showing moderate profitability. Its P/E of 18.7 is less stretched, indicating more reasonable valuation. Despite zero dividend yield, Molina maintains a strong current ratio of 1.69 and reinvests in growth, supported by a favorable WACC of 5.13%. Operational efficiency appears more robust here.
Valuation Stretch vs. Operational Resilience
Molina Healthcare offers a better balance of valuation and operational metrics than Humana, whose profitability and efficiency lag significantly. Investors seeking a steadier risk-reward profile may lean toward Molina’s more favorable fundamentals. Humana’s profile suits those tolerating higher valuation risk amid weaker returns.
Which one offers the Superior Shareholder Reward?
I compare Humana Inc. (HUM) and Molina Healthcare, Inc. (MOH) on shareholder rewards by examining dividends, payout ratios, and buybacks. HUM yields 1.39% with a 36% payout ratio, supported by strong free cash flow of 3.1B and moderate buybacks. MOH pays no dividends, reinvesting heavily in growth and acquisitions, yet shows negative free cash flow (-12.5B) and modest buybacks. HUM’s dividend plus buyback model offers more sustainable, predictable returns. MOH’s reinvestment strategy carries higher risk given cash flow deficits. I conclude HUM delivers a superior total return profile for 2026 investors focused on steady income and capital discipline.
Comparative Score Analysis: The Strategic Profile
The radar chart reveals the fundamental DNA and trade-offs of Humana Inc. and Molina Healthcare, Inc., highlighting their financial strengths and vulnerabilities:
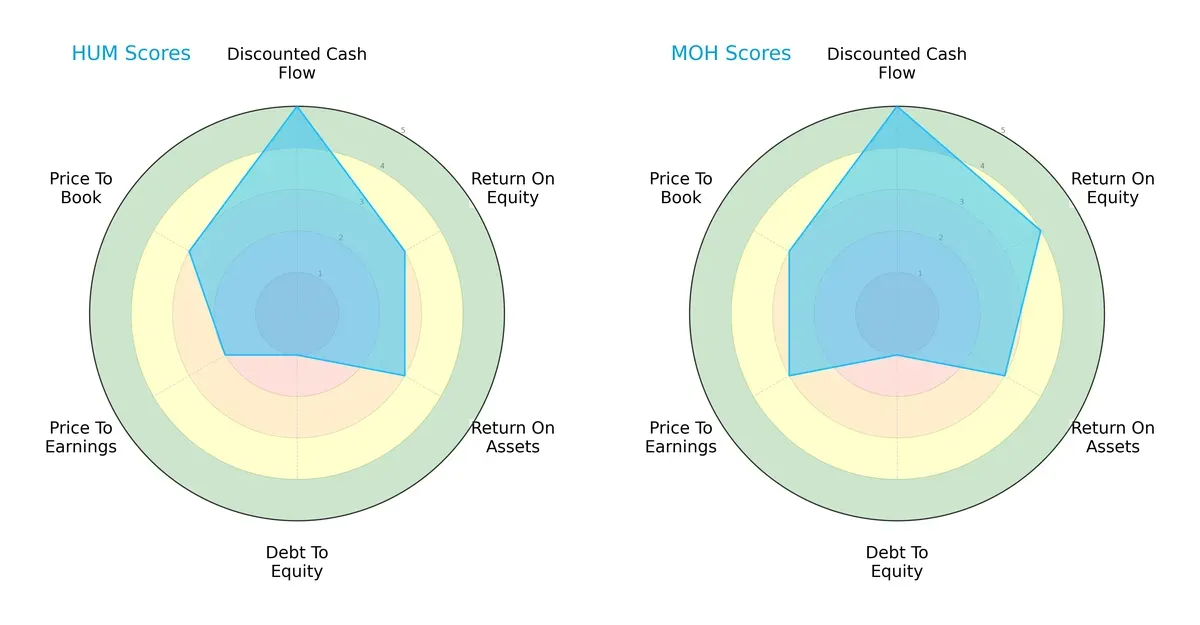
Humana and Molina share identical top DCF scores (5), signaling strong cash flow projections. Molina edges ahead with a superior ROE score (4 vs. 3), reflecting better equity profitability. Both tie on ROA (3) and suffer from weak debt-to-equity scores (1), indicating elevated leverage risk. Molina’s valuation metrics (PE at 3) suggest a more favorable price relative to earnings compared to Humana’s less attractive PE score (2). Humana’s profile is balanced but leans on moderate operational returns, while Molina leverages higher equity efficiency and valuation discipline.
Bankruptcy Risk: Solvency Showdown
Humana’s Altman Z-score of 4.43 slightly surpasses Molina’s 4.14, both firmly in the safe zone for bankruptcy risk in 2026’s challenging cycle:
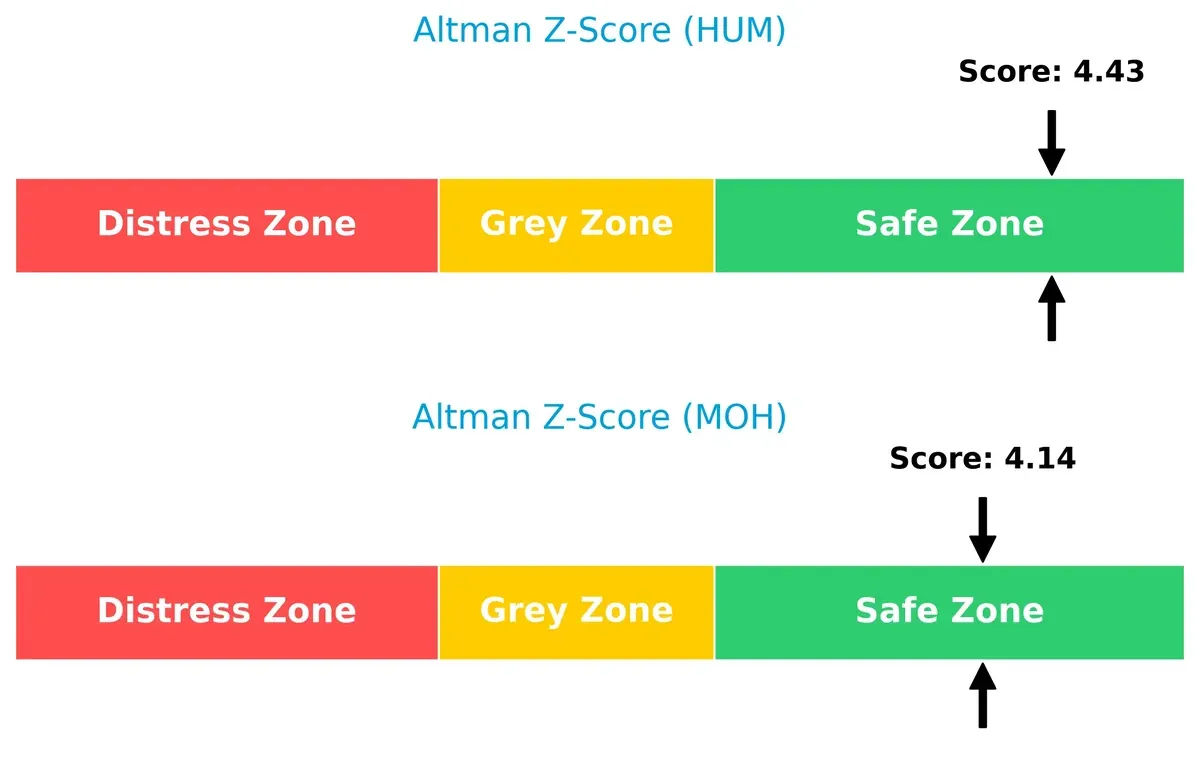
This margin implies Humana maintains a marginally stronger cushion against insolvency, reflecting prudent balance sheet management over recent cycles. Molina remains stable but closer monitoring is warranted given sector volatility.
Financial Health: Quality of Operations
Humana’s Piotroski F-score of 7 demonstrates stronger financial health than Molina’s 6, placing Humana in a notably more robust operational position:

Humana anchors its revenue in the Insurance Segment with $114B in 2024, while CenterWell adds $20B, showing strong, focused diversification within healthcare services. Molina’s revenue pivots on Medicaid Solutions at $32B, with Medicare and Marketplace segments contributing $6.2B and $4.5B respectively. Humana’s broader mix reduces concentration risk, whereas Molina’s Medicaid focus signals reliance on government programs but also benefits from stable ecosystem demand.
Strengths and Weaknesses Comparison
This table compares the strengths and weaknesses of Humana Inc. and Molina Healthcare, Inc.:
Humana Inc. Strengths
- Diversified revenue through Insurance and CenterWell segments
- Favorable debt to equity and debt to assets ratios
- Market presence supported by a broad Healthcare Services base
Molina Healthcare, Inc. Strengths
- Favorable WACC and asset turnover ratios
- Neutral to favorable ROE and ROIC
- Strong liquidity with solid current and quick ratios
- Clear Medicaid and Marketplace segment focus
Humana Inc. Weaknesses
- Unfavorable profitability metrics including net margin, ROE, and ROIC
- Low liquidity ratios
- Unfavorable asset turnover and valuation multiples
Molina Healthcare, Inc. Weaknesses
- Unfavorable net margin and zero dividend yield
- Moderate debt to equity ratio
- Neutral interest coverage and P/E ratios
Humana shows weaknesses in profitability and liquidity despite a diversified business, while Molina benefits from stronger operational efficiency and liquidity but faces profitability challenges. These factors highlight differing strategic priorities and risk profiles.
The Moat Duel: Analyzing Competitive Defensibility
A structural moat is the sole barrier protecting long-term profits from relentless competition erosion. Let’s dissect how Humana and Molina Healthcare defend their turf:
Humana Inc.: Integrated Service Network Moat
Humana leverages a broad health and well-being platform, creating switching costs via diversified medical and specialty plans. This yields margin stability but recent profit contractions signal emerging threats in 2026.
Molina Healthcare, Inc.: Government Contract Reliance Moat
Molina’s moat lies in Medicaid and Medicare contracts, contrasting Humana’s diversified model. It generates value with ROIC above WACC, but declining returns warn of sustainability risks as policy shifts loom.
Integrated Network vs. Contract Dependency: Who Holds the Deeper Moat?
Molina edges ahead with a quantifiable value-creating moat despite a declining ROIC trend. Humana’s moat is less clear amid financial headwinds. Molina appears better positioned to defend market share in 2026.
Which stock offers better returns?
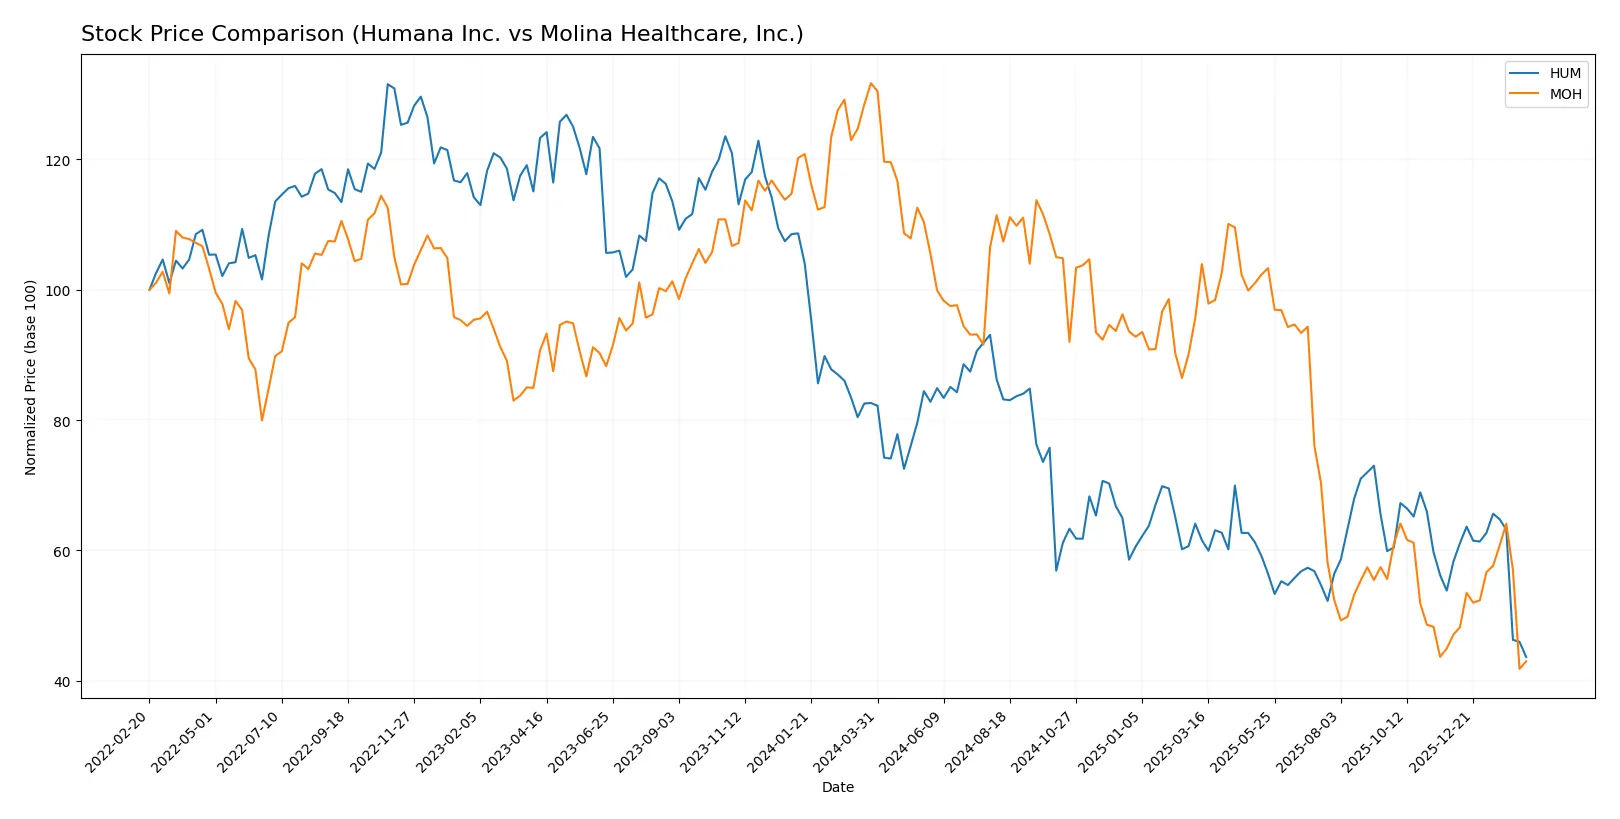
Over the past year, both Humana Inc. and Molina Healthcare, Inc. stocks experienced significant declines, with contrasting recent trading dynamics indicating divergent investor sentiment.
Trend Comparison
Humana Inc. (HUM) shows a bearish trend with a 47.18% price decline over 12 months, decelerating losses and high volatility, hitting a low of 184.1 and a high of 392.63.
Molina Healthcare, Inc. (MOH) also follows a bearish trend with a steeper 67.36% 12-month loss, but accelerating downward momentum and greater volatility, ranging between 131.72 and 414.72.
Comparing trends, HUM delivered relatively better market performance with a smaller decline and decelerating losses versus MOH’s sharper fall and accelerating downward trend.
Target Prices
Analysts present a moderate optimism for Humana Inc. and Molina Healthcare, Inc. based on their consensus target prices.
| Company | Target Low | Target High | Consensus |
|---|---|---|---|
| Humana Inc. | 146 | 345 | 247.07 |
| Molina Healthcare, Inc. | 109 | 224 | 163.64 |
The consensus targets imply upside potential of roughly 34% for Humana and 21% for Molina Healthcare versus current prices. This suggests analysts expect steady growth in healthcare plan providers despite sector volatility.

Don’t Let Luck Decide Your Entry Point
Optimize your entry points with our advanced ProRealTime indicators. You’ll get efficient buy signals with precise price targets for maximum performance. Start outperforming now!
How do institutions grade them?
Here is a comparison of recent institutional grades for Humana Inc. and Molina Healthcare, Inc.:
Humana Inc. Grades
The table summarizes the latest grades from major financial institutions for Humana Inc.:
| Grading Company | Action | New Grade | Date |
|---|---|---|---|
| TD Cowen | Maintain | Hold | 2026-02-13 |
| Cantor Fitzgerald | Maintain | Neutral | 2026-02-12 |
| Jefferies | Maintain | Buy | 2026-02-12 |
| Guggenheim | Maintain | Buy | 2026-02-12 |
| RBC Capital | Downgrade | Sector Perform | 2026-02-12 |
| UBS | Maintain | Neutral | 2026-02-12 |
| Morgan Stanley | Downgrade | Underweight | 2026-02-02 |
| Wells Fargo | Downgrade | Equal Weight | 2026-01-07 |
| Barclays | Maintain | Equal Weight | 2026-01-05 |
| Morgan Stanley | Maintain | Equal Weight | 2025-12-18 |
Molina Healthcare, Inc. Grades
Below are the recent grades assigned to Molina Healthcare, Inc. by key grading firms:
| Grading Company | Action | New Grade | Date |
|---|---|---|---|
| Goldman Sachs | Maintain | Neutral | 2026-02-12 |
| Barclays | Maintain | Underweight | 2026-02-10 |
| TD Cowen | Maintain | Hold | 2026-02-09 |
| Cantor Fitzgerald | Maintain | Neutral | 2026-02-09 |
| Wells Fargo | Maintain | Overweight | 2026-01-07 |
| Barclays | Maintain | Underweight | 2026-01-05 |
| Wells Fargo | Maintain | Overweight | 2025-11-12 |
| Barclays | Downgrade | Underweight | 2025-10-24 |
| Goldman Sachs | Maintain | Neutral | 2025-10-24 |
| Cantor Fitzgerald | Maintain | Neutral | 2025-10-24 |
Which company has the best grades?
Humana Inc. holds a mix of Buy and Neutral ratings but has seen recent downgrades to Underweight and Sector Perform. Molina Healthcare, Inc. mostly receives Neutral to Underweight ratings, with some Overweight from Wells Fargo. Humana’s stronger Buy ratings could signal greater institutional confidence, while Molina’s consistent Underweight marks suggest higher perceived risk. Investors may view Humana as the relatively more favored stock in this comparison.
Risks specific to each company
The following categories identify the critical pressure points and systemic threats facing both firms in the 2026 market environment:
1. Market & Competition
Humana Inc.
- Faces margin pressure with unfavorable net margin and ROE; competitive pricing challenges persist.
Molina Healthcare, Inc.
- Slightly better margin and ROE; operates in fewer states but growing Medicaid/Medicare membership.
2. Capital Structure & Debt
Humana Inc.
- Strong balance sheet with low debt; favorable debt ratios but weak liquidity ratios raise short-term concerns.
Molina Healthcare, Inc.
- Moderate leverage with favorable debt-to-assets; stronger liquidity ratios reduce short-term risk.
3. Stock Volatility
Humana Inc.
- Low beta (0.44) indicates less market volatility.
Molina Healthcare, Inc.
- Slightly higher beta (0.49) suggests marginally higher stock price fluctuations.
4. Regulatory & Legal
Humana Inc.
- Regulatory risks tied to Medicare/Medicaid contracts and specialty services.
Molina Healthcare, Inc.
- Heavily reliant on government programs; regulatory changes could impact revenue significantly.
5. Supply Chain & Operations
Humana Inc.
- Broad service mix including pharmacy and home health demands complex operational management.
Molina Healthcare, Inc.
- Focused on managed care with simpler supply chain but dependent on state program stability.
6. ESG & Climate Transition
Humana Inc.
- No explicit ESG data; industry-wide pressure to improve sustainability and social governance.
Molina Healthcare, Inc.
- Similar ESG challenges; compliance with healthcare social responsibility expected.
7. Geopolitical Exposure
Humana Inc.
- Primarily US-focused with minimal direct geopolitical risks.
Molina Healthcare, Inc.
- Also US-centric but exposure to Medicaid programs in 18 states may increase regulatory variability.
Which company shows a better risk-adjusted profile?
Molina Healthcare’s moderate leverage, stronger liquidity ratios, and favorable returns on capital provide a more balanced risk profile. Humana’s low debt is positive, but weak profitability and liquidity ratios raise caution. Molina’s operational focus and slightly higher volatility are offsets worth noting. Recent ratio trends confirm Molina’s superior capital efficiency versus Humana’s margin struggles. The biggest risk for Humana is weak profitability and liquidity; for Molina, regulatory dependence on government programs remains critical. Overall, Molina Healthcare shows a better risk-adjusted profile in 2026.
Final Verdict: Which stock to choose?
Humana Inc. (HUM) shines with its strong cash flow generation, supporting ongoing operations and growth investments. However, its declining profitability and negative net margin growth warrant vigilance. It suits investors seeking aggressive growth but willing to tolerate operational challenges.
Molina Healthcare, Inc. (MOH) leverages a solid economic moat with efficient capital use and a safer balance sheet profile. Despite a recent dip in profitability, it offers a more stable foundation than HUM. MOH fits well within a GARP (Growth at a Reasonable Price) portfolio.
If you prioritize robust cash generation and can absorb near-term profitability headwinds, HUM presents a compelling scenario. However, if you seek better financial stability paired with a defensible moat, MOH offers a slightly more favorable risk-return profile despite its own challenges.
Disclaimer: Investment carries a risk of loss of initial capital. The past performance is not a reliable indicator of future results. Be sure to understand risks before making an investment decision.
Go Further
I encourage you to read the complete analyses of Humana Inc. and Molina Healthcare, Inc. to enhance your investment decisions: