Home > Comparison > Technology > WDC vs HPQ
The strategic rivalry between Western Digital Corporation and HP Inc. shapes the Technology sector’s hardware landscape. Western Digital, a data storage device manufacturer, contrasts with HP’s diversified personal computing and printing solutions model. This head-to-head reflects a battle between specialized storage innovation and broad-based hardware services. This analysis will identify which company presents a superior risk-adjusted profile, guiding investors seeking robust exposure to computer hardware industry dynamics.
Table of contents
Companies Overview
Western Digital and HP Inc. are pivotal players shaping the global computer hardware landscape.
Western Digital Corporation: Data Storage Innovator
Western Digital dominates the data storage industry with a diverse product lineup including HDDs, SSDs, and flash-based embedded storage. Its revenue stems from sales to original equipment manufacturers and retailers worldwide. In 2026, the company focuses strategically on expanding enterprise data center solutions and tiered storage platforms to capitalize on growing cloud and IoT demand.
HP Inc.: Personal Computing and Printing Leader
HP Inc. commands the personal computing and printing markets, generating revenue from commercial and consumer PCs, printers, and services. It targets a broad customer base from individuals to enterprises. The company’s 2026 strategy emphasizes innovation in printing technology and expanding its Personal Systems segment to maintain relevance amid evolving digital workflows.
Strategic Collision: Similarities & Divergences
Both firms operate in computer hardware but diverge sharply in focus—Western Digital pursues a specialized storage solutions model, while HP champions diverse computing and printing devices. Their main battleground lies in addressing enterprise and consumer technology needs. Investors face distinct profiles: Western Digital bets on storage innovation growth; HP leans on broad hardware diversification with steady cash flow.
Income Statement Comparison
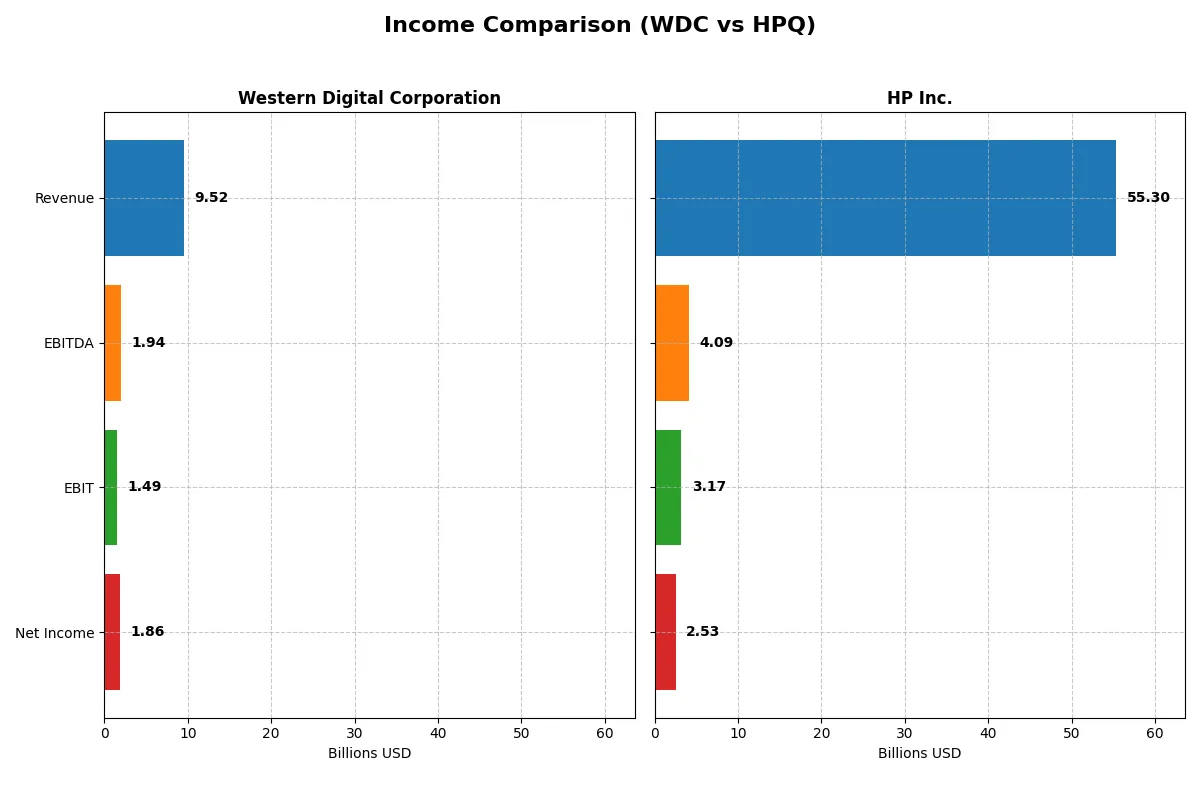
The following data dissects the core profitability and scalability of both corporate engines to reveal who dominates the bottom line:
| Metric | Western Digital Corporation (WDC) | HP Inc. (HPQ) |
|---|---|---|
| Revenue | 9.52B | 55.3B |
| Cost of Revenue | 5.83B | 44.2B |
| Operating Expenses | 1.36B | 7.42B |
| Gross Profit | 3.69B | 11.0B |
| EBITDA | 1.94B | 4.09B |
| EBIT | 1.49B | 3.17B |
| Interest Expense | 357M | 506M |
| Net Income | 1.86B | 2.53B |
| EPS | 5.31 | 2.67 |
| Fiscal Year | 2025 | 2025 |
Income Statement Analysis: The Bottom-Line Duel
This income statement comparison reveals the true efficiency and profitability trends of two major technology firms over recent years.
Western Digital Corporation Analysis
Western Digital’s revenue plunged from 18.8B in 2022 to 9.5B in 2025 but bounced back sharply from 6.3B in 2024. Net income surged from a loss of 798M in 2024 to a strong 1.86B in 2025. Its gross margin improved to 38.8%, and net margin rose to nearly 20%, signaling restored operational efficiency and margin expansion.
HP Inc. Analysis
HP’s revenue showed moderate growth, rising from 53.6B in 2023 to 55.3B in 2025. However, net income declined from 3.26B in 2023 to 2.53B in 2025, reflecting margin pressure. Gross margin plateaued near 20%, and net margin shrank to 4.6%, indicating weaker profitability and challenges in controlling costs despite steady top-line expansion.
Margin Mastery vs. Revenue Resilience
Western Digital exhibits a remarkable recovery in profitability with expanding margins and a strong net income rebound. HP Inc., while maintaining stable revenue, faces declining net income and compressed margins. For investors prioritizing margin improvement and bottom-line growth, Western Digital’s turnaround presents a more compelling profile than HP’s steady but margin-challenged performance.
Financial Ratios Comparison
These vital ratios act as a diagnostic tool to expose the underlying fiscal health, valuation premiums, and capital efficiency of the companies compared below:
| Ratios | Western Digital Corporation (WDC) | HP Inc. (HPQ) |
|---|---|---|
| ROE | 35.0% | -730.9% |
| ROIC | 21.5% | 24.97% |
| P/E | 11.8x | 10.4x |
| P/B | 4.14x | -75.65x |
| Current Ratio | 1.08 | 0.77 |
| Quick Ratio | 0.84 | 0.48 |
| D/E | 0.96 | -31.45 |
| Debt-to-Assets | 36.3% | 26.1% |
| Interest Coverage | 6.54x | 7.16x |
| Asset Turnover | 0.68 | 1.32 |
| Fixed Asset Turnover | 4.06 | 13.23 |
| Payout Ratio | 2.36% | 43.0% |
| Dividend Yield | 0.20% | 4.16% |
| Fiscal Year | 2025 | 2025 |
Efficiency & Valuation Duel: The Vital Signs
Financial ratios serve as a company’s DNA, exposing hidden risks and operational strengths that shape investor confidence and valuation.
Western Digital Corporation
Western Digital displays robust profitability with a 35.04% ROE and a healthy 19.55% net margin, signaling operational efficiency. Its P/E of 11.8 suggests a reasonably priced stock, though a high P/B ratio of 4.14 indicates some valuation stretch. The firm returns value mainly through modest dividends and reinvests heavily in R&D.
HP Inc.
HP posts a mixed profile with a weak -730.92% ROE and a low 4.57% net margin, flagging profitability concerns. Yet, its P/E of 10.35 and solid P/B ratio reflect valuation appeal. The company supports shareholders with a 4.16% dividend yield while maintaining favorable capital efficiency and reinvestment discipline.
Balanced Operational Strength vs. Attractive Yield
Western Digital offers superior profitability and operational metrics but trades with stretched book value ratios. HP provides a more attractive dividend and valuation, albeit with profitability risks. Investors prioritizing stable returns may prefer HP, while those seeking operational efficiency might lean toward Western Digital.
Which one offers the Superior Shareholder Reward?
I observe that Western Digital (WDC) pays a negligible dividend yield of 0.2% with a low payout ratio of 2.4%, relying mostly on modest buybacks. HP Inc. (HPQ) delivers a strong 3-4% dividend yield with a 31-43% payout ratio, supported by steady buybacks. WDC’s free cash flow per share of $3.7 funds cautious buybacks, but its dividend is minimal and not a meaningful return driver. HPQ, meanwhile, balances solid FCF of around $3 with a sustainable dividend and buybacks, enhancing total shareholder return. Given HPQ’s higher yield, reasonable payout, and consistent buyback activity, I see HPQ as offering a superior, more sustainable shareholder reward in 2026.
Comparative Score Analysis: The Strategic Profile
The radar chart reveals the fundamental DNA and trade-offs of Western Digital Corporation and HP Inc., highlighting their distinct financial strengths and weaknesses:
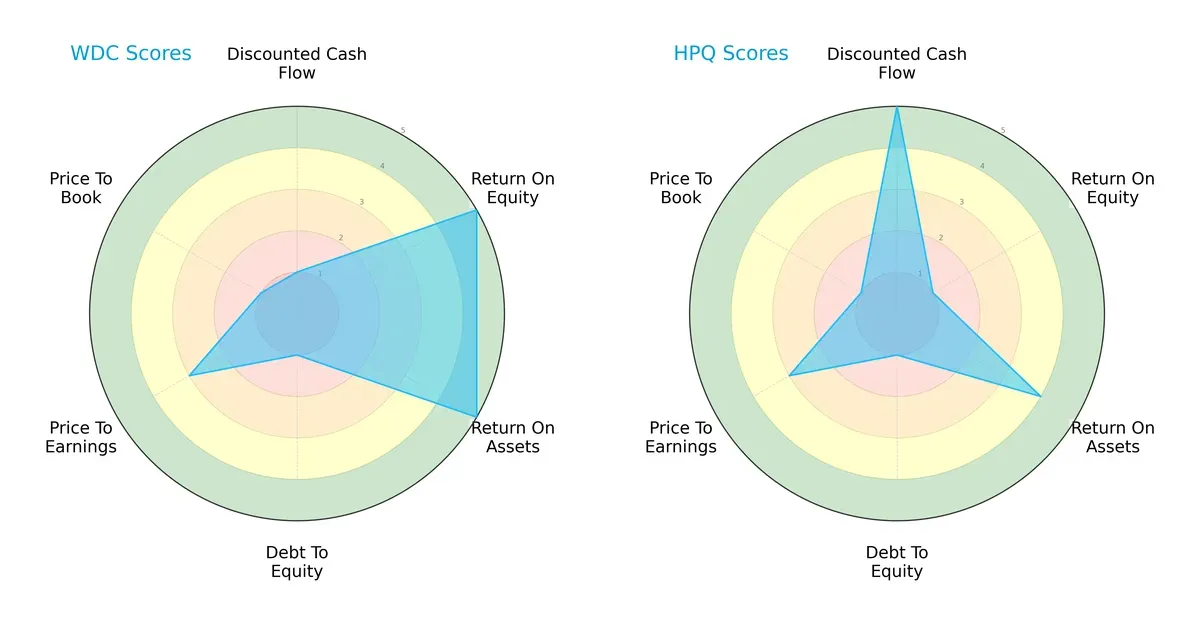
Western Digital excels in profitability, with top ROE and ROA scores of 5 each, indicating efficient asset and equity utilization. However, its DCF and debt-to-equity scores of 1 signal undervaluation concerns and high leverage risk. HP counters with a strong DCF score of 5, suggesting good future cash flow prospects, but shows weak ROE at 1, reflecting challenges in generating shareholder returns. Both firms share low debt-to-equity and price-to-book scores, pointing to financial risk and valuation concerns. Western Digital presents a more balanced operational profile, while HP relies heavily on cash flow valuation.
Bankruptcy Risk: Solvency Showdown
Western Digital’s Altman Z-Score of 8.96 versus HP’s 1.57 indicates a stark contrast in solvency:
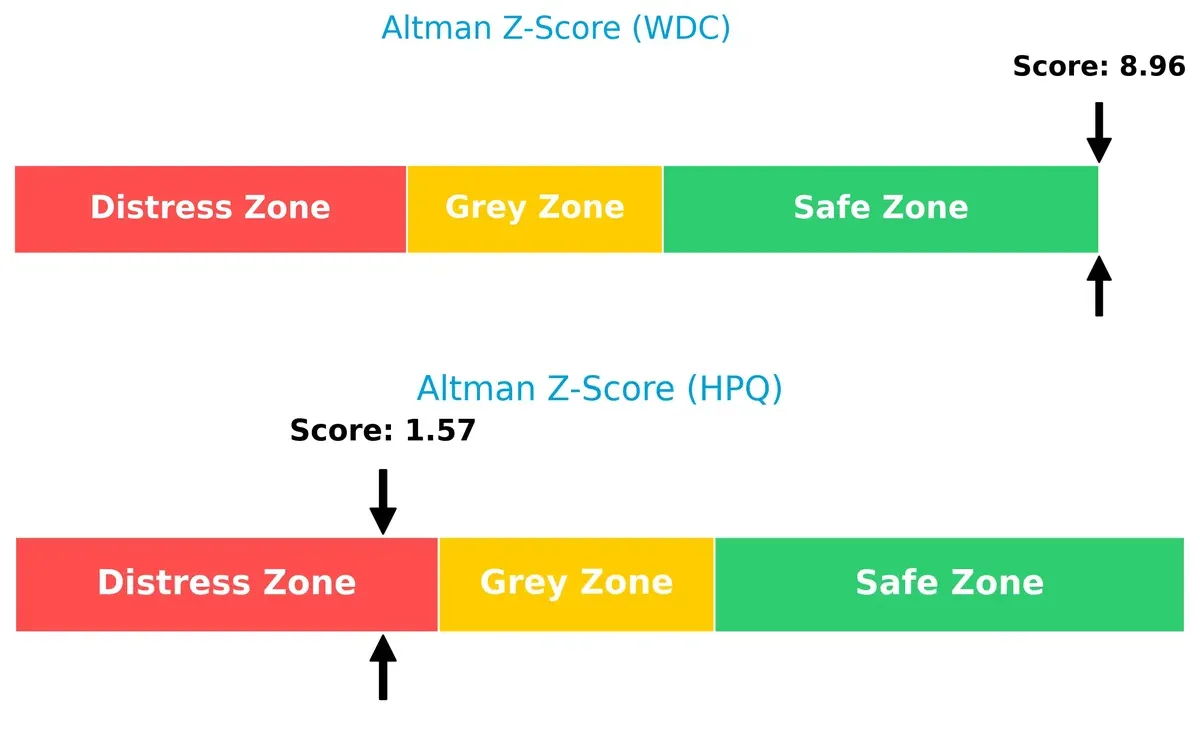
Western Digital sits comfortably in the safe zone, signaling robust financial stability and low bankruptcy risk. HP’s score falls into the distress zone, raising significant red flags about its long-term survival amid economic headwinds.
Financial Health: Quality of Operations
Western Digital’s Piotroski F-Score of 7 outpaces HP’s 6, reflecting stronger internal financial health:
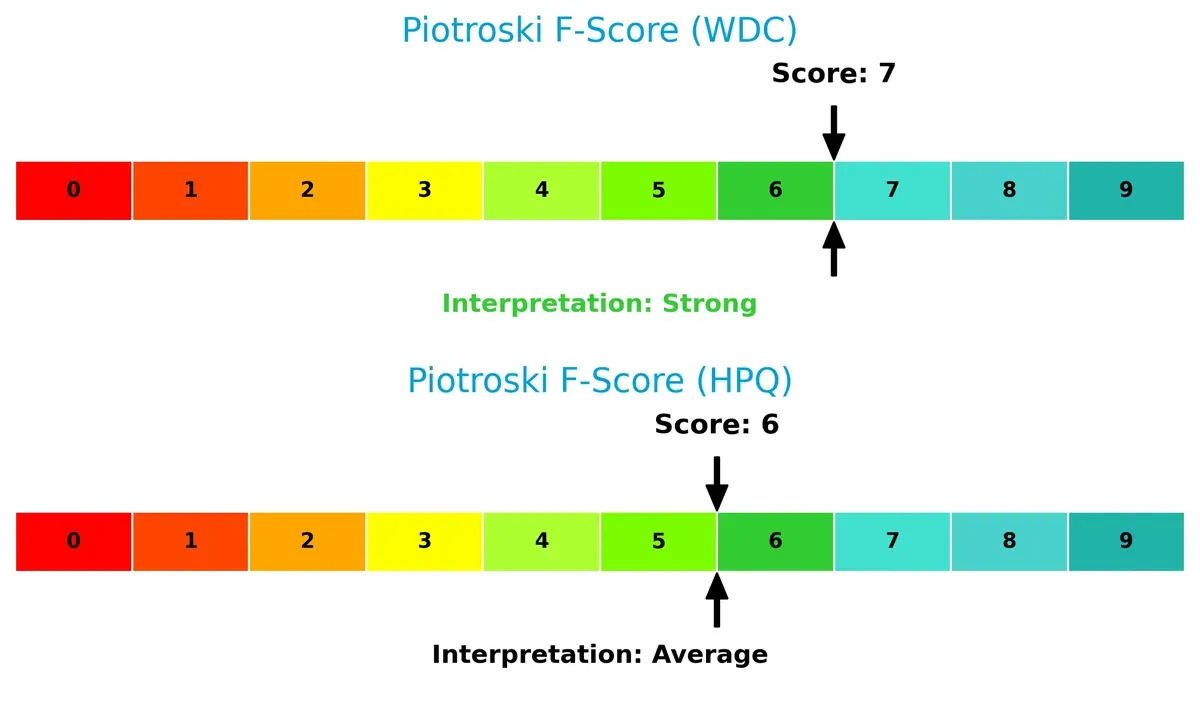
Western Digital demonstrates solid profitability, liquidity, and operational efficiency. HP’s average score suggests moderate financial strength but hints at potential internal vulnerabilities when compared to its peer. Investors should weigh these differences carefully.
How are the two companies positioned?
This section dissects the operational DNA of WDC and HPQ by comparing their revenue distribution and internal dynamics, including strengths and weaknesses. The final objective confronts their economic moats to identify which model offers the most resilient, sustainable competitive advantage today.
Revenue Segmentation: The Strategic Mix
This visual comparison dissects how Western Digital Corporation and HP Inc. diversify their income streams and reveals where their primary sector bets lie:
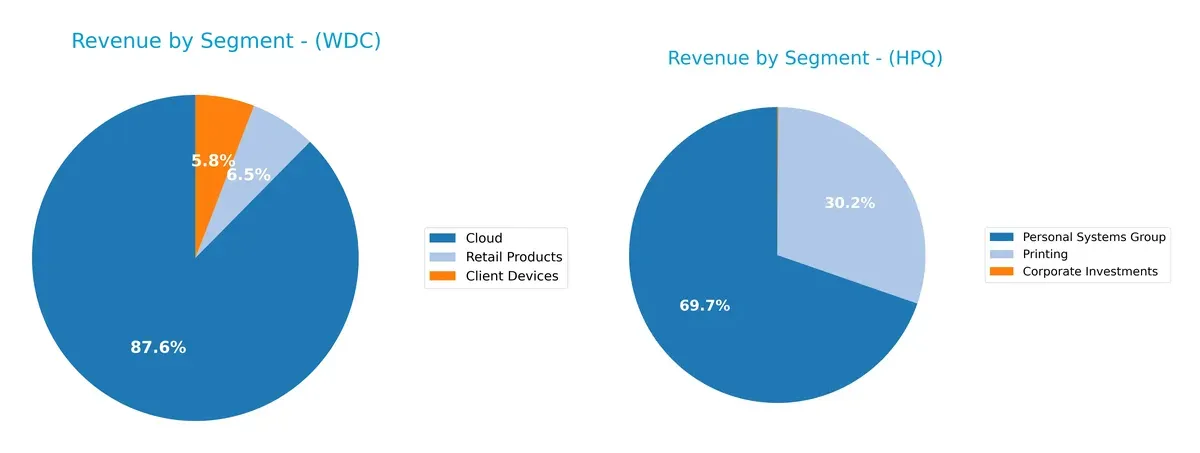
Western Digital pivots heavily on its Cloud segment with $8.3B in 2025, while Client Devices and Retail Products lag significantly at $556M and $623M. HP Inc. anchors on Personal Systems Group at $38.5B, dwarfing Printing ($16.7B) and Corporate Investments ($62M). HP’s broader revenue base reduces concentration risk. Western Digital’s Cloud dominance signals infrastructure strength but exposes it to sector cyclicality.
Strengths and Weaknesses Comparison
This table compares the Strengths and Weaknesses of Western Digital Corporation and HP Inc.:
WDC Strengths
- Strong profitability with 19.55% net margin and 35.04% ROE
- Favorable ROIC at 21.53% above WACC
- Diverse product segments including Cloud and Client Devices
- Global presence across Asia, EMEA, and Americas with significant revenue
HPQ Strengths
- High ROIC of 24.97% and favorable WACC at 7.52%
- Strong market presence in Personal Systems and Printing segments
- Robust global footprint with substantial Americas and EMEA revenues
- Higher asset turnover indicating efficient use of assets
WDC Weaknesses
- WACC at 12.18% exceeds ROIC, indicating potential capital cost issues
- High PB ratio at 4.14 suggests overvaluation risk
- Dividend yield very low at 0.2%
- Neutral liquidity ratios may constrain short-term flexibility
HPQ Weaknesses
- Negative ROE at -730.92% signals profitability concerns
- Weak net margin at 4.57%
- Low current and quick ratios indicate liquidity risks
- Despite favorable debt metrics, debt-to-equity negative suggests balance sheet complexity
Western Digital demonstrates strong profitability metrics and a balanced global presence but faces capital cost challenges. HP excels in capital efficiency and asset turnover but struggles with profitability and liquidity, impacting its financial stability.
The Moat Duel: Analyzing Competitive Defensibility
A structural moat is the only reliable shield protecting long-term profits from relentless competitive pressure. Let’s dissect the moats of two tech hardware giants:
Western Digital Corporation: Cost-Advantaged Storage Innovator
Western Digital’s moat stems from a strong cost advantage in data storage production. I see this reflected in its robust 38.8% gross margin and expanding ROIC, signaling efficient capital use. New SSD and enterprise storage solutions in 2026 could deepen this moat amid rising data demands.
HP Inc.: Brand-Fueled Ecosystem Player
HP’s moat lies in its brand strength and broad product ecosystem, differing from Western Digital’s manufacturing edge. Despite positive ROIC above WACC, its declining ROIC trend and compressed margins highlight rising competitive challenges. Expansion in printing services and commercial systems could offer growth but faces tougher headwinds.
Cost Leadership vs. Brand Ecosystem: Who Holds the Moat Crown?
Western Digital boasts a wider moat with a very favorable ROIC trend and superior margin stability. HP creates value but suffers from a shrinking profitability runway. I conclude Western Digital is better positioned to sustain and defend its market share through 2026.
Which stock offers better returns?
The past year shows contrasting price dynamics: Western Digital surges sharply while HP declines steadily, reflecting divergent investor sentiment and trading momentum.
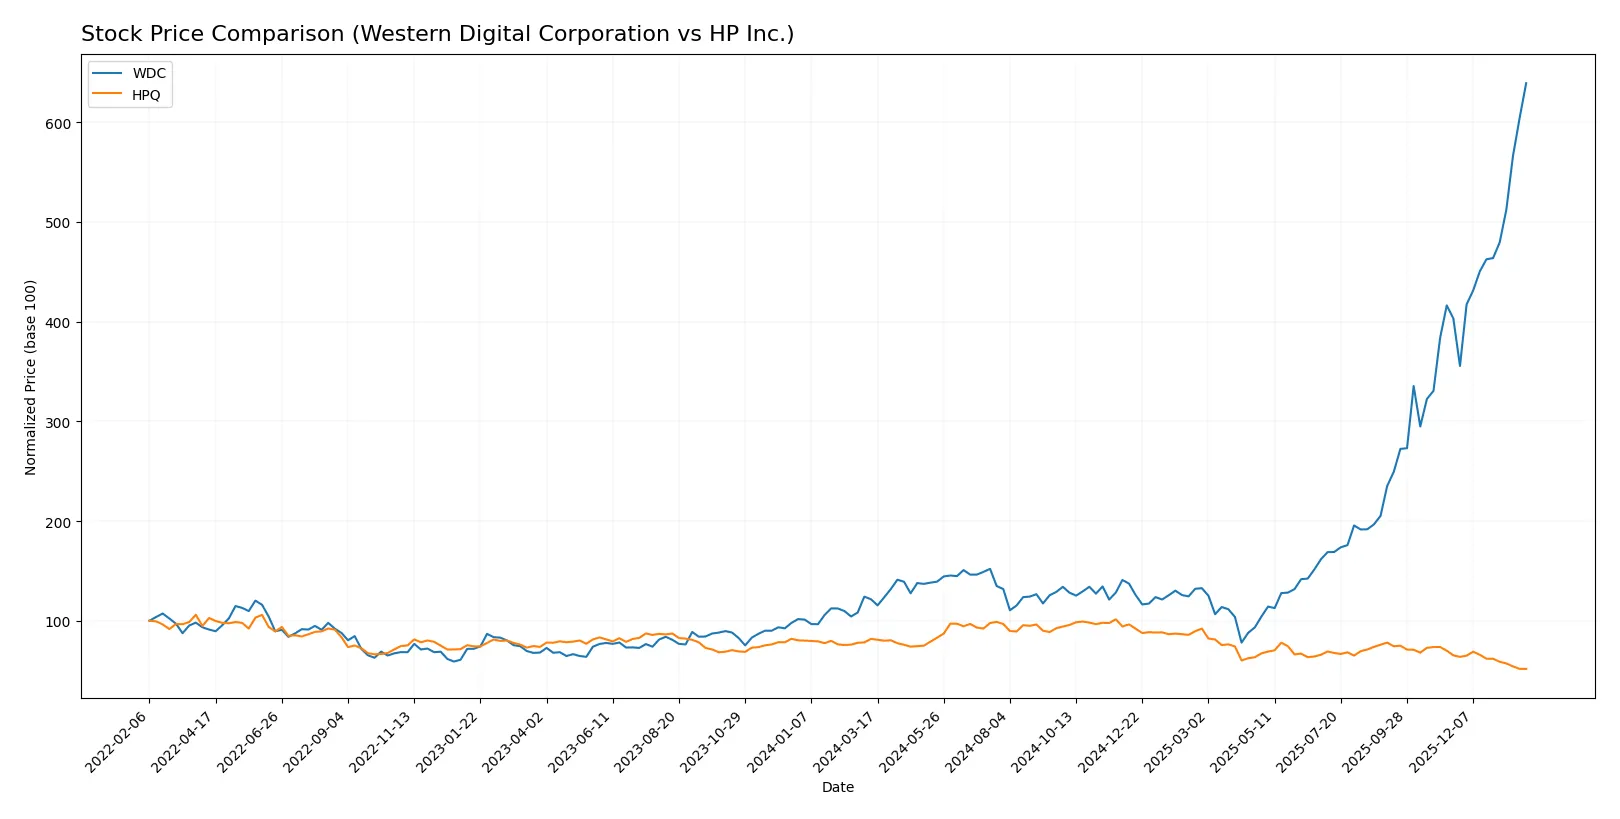
Trend Comparison
Western Digital’s stock rose 426% over 12 months, marking a strong bullish trend with accelerating gains and a high volatility level of 48.92. It hit a low of 30.54 and peaked at 250.23.
HP’s stock fell 37% in the same period, showing a bearish trend with deceleration and low volatility around 4.9. Its price ranged between 19.43 and 38.13 during the year.
Western Digital outperformed HP considerably, delivering the highest market returns with strong upward momentum compared to HP’s prolonged decline.
Target Prices
Analysts present a varied but constructive outlook on Western Digital and HP Inc., reflecting cautious optimism in computer hardware.
| Company | Target Low | Target High | Consensus |
|---|---|---|---|
| Western Digital Corporation | 180 | 325 | 268.2 |
| HP Inc. | 18 | 30 | 23.33 |
Western Digital’s consensus target exceeds its current price of 250.23, implying upside potential. HP’s target consensus sits above its 19.44 share price, signaling moderate gains expected.

Don’t Let Luck Decide Your Entry Point
Optimize your entry points with our advanced ProRealTime indicators. You’ll get efficient buy signals with precise price targets for maximum performance. Start outperforming now!
How do institutions grade them?
Western Digital Corporation Grades
Here are the latest institutional grades for Western Digital Corporation:
| Grading Company | Action | New Grade | Date |
|---|---|---|---|
| TD Cowen | Maintain | Buy | 2026-01-30 |
| Goldman Sachs | Maintain | Neutral | 2026-01-30 |
| Cantor Fitzgerald | Maintain | Overweight | 2026-01-30 |
| Morgan Stanley | Maintain | Overweight | 2026-01-30 |
| Wedbush | Maintain | Outperform | 2026-01-30 |
| Wells Fargo | Maintain | Overweight | 2026-01-30 |
| Mizuho | Maintain | Outperform | 2026-01-27 |
| Morgan Stanley | Maintain | Overweight | 2026-01-22 |
| Citigroup | Maintain | Buy | 2026-01-20 |
| B of A Securities | Maintain | Buy | 2026-01-20 |
HP Inc. Grades
Below are the most recent institutional grades for HP Inc.:
| Grading Company | Action | New Grade | Date |
|---|---|---|---|
| Morgan Stanley | Maintain | Underweight | 2026-01-20 |
| Citigroup | Maintain | Neutral | 2026-01-20 |
| Barclays | Downgrade | Underweight | 2026-01-16 |
| Morgan Stanley | Maintain | Underweight | 2025-11-26 |
| Evercore ISI Group | Maintain | In Line | 2025-11-26 |
| Citigroup | Maintain | Neutral | 2025-11-26 |
| UBS | Maintain | Neutral | 2025-11-26 |
| Goldman Sachs | Maintain | Neutral | 2025-11-26 |
| TD Cowen | Maintain | Hold | 2025-11-26 |
| Barclays | Maintain | Equal Weight | 2025-11-26 |
Which company has the best grades?
Western Digital receives predominantly Buy and Overweight ratings, signaling institutional confidence. HP Inc. mainly holds Neutral to Underweight grades, indicating cautious sentiment. These grade differences could affect investor perception of momentum and risk.
Risks specific to each company
The following categories identify critical pressure points and systemic threats facing both firms in the 2026 market environment:
1. Market & Competition
Western Digital Corporation
- Faces intense competition in data storage with rapid tech shifts and pricing pressure.
HP Inc.
- Competes in highly saturated PC and printer markets, challenged by innovation pace and declining print demand.
2. Capital Structure & Debt
Western Digital Corporation
- Neutral debt-to-equity ratio (0.96); moderate interest coverage (4.17x) signals manageable leverage but some risk.
HP Inc.
- Favorable debt metrics with low debt-to-assets (26%) and strong interest coverage (6.27x), indicating robust balance sheet.
3. Stock Volatility
Western Digital Corporation
- High beta (1.85) and wide price range indicate significant volatility and sensitivity to market swings.
HP Inc.
- Lower beta (1.22) and tighter price range suggest more stable stock behavior amid market fluctuations.
4. Regulatory & Legal
Western Digital Corporation
- Exposure to international trade regulations and data privacy laws could impact supply and sales.
HP Inc.
- Faces regulatory scrutiny in multiple jurisdictions, especially regarding product compliance and environmental standards.
5. Supply Chain & Operations
Western Digital Corporation
- Relies heavily on global supply chains for complex components, vulnerable to disruptions and cost fluctuations.
HP Inc.
- Faces risks from component shortages and logistics delays, especially in printing supplies and PC components.
6. ESG & Climate Transition
Western Digital Corporation
- Moderate ESG risks; pressure to reduce carbon footprint in manufacturing and promote sustainable products.
HP Inc.
- Stronger focus on ESG initiatives, including circular economy programs and renewable energy use, but execution risk remains.
7. Geopolitical Exposure
Western Digital Corporation
- Significant exposure to China and Asia-Pacific markets, vulnerable to trade tensions and tariffs.
HP Inc.
- Also exposed to global geopolitical risks but benefits from diversified manufacturing and sales footprint.
Which company shows a better risk-adjusted profile?
Western Digital’s biggest risk lies in market competition combined with its high stock volatility, which could amplify downside in downturns. HP’s main pressure point is its weak liquidity ratios, signaling short-term financial strain despite a stronger capital structure. I see HP as having a better risk-adjusted profile due to its robust debt metrics and lower volatility, supported by its high Altman Z-Score and favorable Piotroski Score. Western Digital’s wider price swings and moderate leverage warrant caution despite solid profitability metrics.
Final Verdict: Which stock to choose?
Western Digital Corporation’s superpower lies in its strong and growing return on invested capital, signaling durable competitive advantages and efficient capital use. Its main point of vigilance is a somewhat stretched balance sheet, which could pressure liquidity in tougher cycles. WDC suits investors targeting aggressive growth with a high-risk appetite.
HP Inc. boasts a strategic moat through operational efficiency and solid free cash flow generation, reflected in favorable debt management and a robust dividend yield. It offers better stability than WDC but faces declining profitability trends, making it more suitable for GARP investors seeking steady income with moderate growth.
If you prioritize durable value creation and growth potential, Western Digital outshines with its expanding profitability despite financial leverage concerns. However, if you seek income stability and lower risk, HP provides better safety and cash flow resilience, even though its profitability shows signs of erosion. Each stock fits distinct investor profiles depending on risk tolerance and growth versus stability preferences.
Disclaimer: Investment carries a risk of loss of initial capital. The past performance is not a reliable indicator of future results. Be sure to understand risks before making an investment decision.
Go Further
I encourage you to read the complete analyses of Western Digital Corporation and HP Inc. to enhance your investment decisions: