In the fast-evolving computer hardware industry, HP Inc. and Super Micro Computer, Inc. stand out with distinct innovation strategies and market focuses. HP, a long-established leader in personal computing and printing, contrasts with Super Micro’s specialization in high-performance server and storage solutions for data centers and cloud computing. This article will explore their strengths and risks to help you identify which company might be the more compelling investment opportunity in 2026.
Table of contents
Companies Overview
I will begin the comparison between HP Inc. and Super Micro Computer, Inc. by providing an overview of these two companies and their main differences.
HP Inc. Overview
HP Inc. focuses on personal computing, imaging, and printing solutions, serving individual consumers, small to large enterprises, and public sectors. It operates through three segments: Personal Systems, Printing, and Corporate Investments. Founded in 1939 and headquartered in Palo Alto, California, HP Inc. is a well-established player in the computer hardware market with a broad product range and global reach.
Super Micro Computer, Inc. Overview
Super Micro Computer, Inc. specializes in high-performance server and storage solutions based on modular, open architecture. It targets enterprise data centers, cloud computing, AI, 5G, and edge computing markets. Established in 1993 and based in San Jose, California, the company offers hardware, software, and extensive support services, emphasizing customized and integrated technology systems globally.
Key similarities and differences
Both HP Inc. and Super Micro Computer operate in the computer hardware industry within the technology sector in the US. While HP’s focus spans personal computing and printing devices, Super Micro targets server and storage solutions for specialized enterprise applications. HP has a significantly larger workforce and a more diversified product portfolio, whereas Super Micro emphasizes modular, high-performance systems and comprehensive support services.
Income Statement Comparison
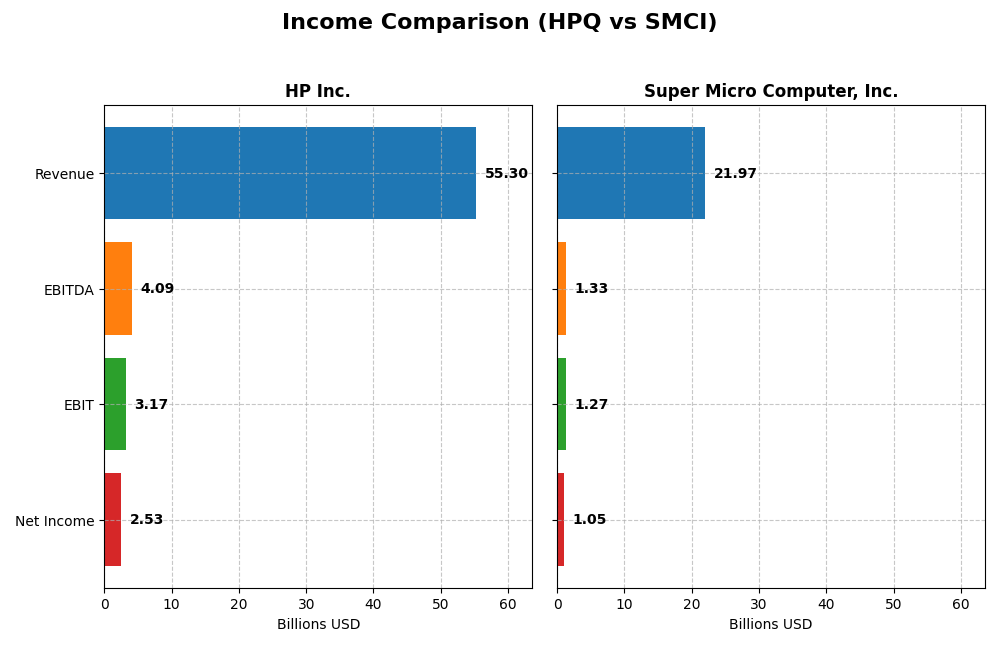
The table below presents a clear financial comparison between HP Inc. and Super Micro Computer, Inc. for their most recent fiscal year, highlighting key income statement metrics.
| Metric | HP Inc. (HPQ) | Super Micro Computer, Inc. (SMCI) |
|---|---|---|
| Market Cap | 19.7B | 17.0B |
| Revenue | 55.3B | 21.97B |
| EBITDA | 4.09B | 1.33B |
| EBIT | 3.17B | 1.27B |
| Net Income | 2.53B | 1.05B |
| EPS | 2.67 | 1.77 |
| Fiscal Year | 2025 | 2025 |
Income Statement Interpretations
HP Inc.
HP Inc.’s revenue declined by approximately 13% from 2021 to 2025, with net income falling sharply by over 60% in the same period. Margins remained generally stable but with a neutral gross margin near 20% and net margin around 4.6%. In 2025, revenue grew modestly by 3.2%, yet profitability weakened as gross profit and net income margins deteriorated, reflecting an unfavorable recent performance.
Super Micro Computer, Inc.
Super Micro Computer, Inc. showed robust revenue growth, surging more than 500% from 2021 to 2025, with net income expanding over 800%. Margins held steady with neutral gross margins near 11% and net margins around 4.8%. In 2025, the company recorded a strong 47% revenue increase and 18% gross profit growth, though net margin declined, slightly dampening an otherwise favorable income trend.
Which one has the stronger fundamentals?
Super Micro Computer, Inc. exhibits stronger fundamentals with significant revenue and net income growth across the period and a majority of favorable income statement metrics. Conversely, HP Inc. faces a declining revenue and profitability trend with mostly unfavorable evaluations. While HP maintains higher absolute figures, Super Micro’s growth trajectory and margin improvements suggest more robust financial momentum.
Financial Ratios Comparison
The table below presents the most recent financial ratios for HP Inc. and Super Micro Computer, Inc., providing a snapshot of their operating efficiency, liquidity, leverage, and shareholder returns.
| Ratios | HP Inc. (2025) | Super Micro Computer, Inc. (2025) |
|---|---|---|
| ROE (%) | -7.31 | 16.64 |
| ROIC (%) | 24.97 | 9.26 |
| P/E | 10.35 | 27.74 |
| P/B | -75.65 | 4.62 |
| Current Ratio | 0.77 | 5.25 |
| Quick Ratio | 0.48 | 3.25 |
| D/E | -31.45 | 0.76 |
| Debt-to-Assets | 26.05% | 34.09% |
| Interest Coverage | 7.16 | 21.03 |
| Asset Turnover | 1.32 | 1.57 |
| Fixed Asset Turnover | 13.23 | 27.53 |
| Payout Ratio | 43.02% | 0 |
| Dividend Yield (%) | 4.16 | 0 |
Interpretation of the Ratios
HP Inc.
HP Inc. demonstrates mostly favorable financial ratios, with strong ROIC at 24.97% and a WACC of 7.6%, indicating efficient capital use and reasonable cost of capital. However, the company shows weaknesses such as a negative ROE of -730.92% and a low current ratio of 0.77, raising concerns about profitability and liquidity. HP pays dividends with a 4.16% yield, supported by a reasonable payout and coverage, yet risks include negative equity returns.
Super Micro Computer, Inc.
Super Micro shows mixed ratio strength: favorable ROE at 16.64% and high interest coverage at 21.34, but neutral to unfavorable ratios like a PE of 27.74 and a zero dividend yield, reflecting no shareholder payouts. The current ratio is very high at 5.25 but marked unfavorable, possibly signaling inefficient asset use. The company’s neutral stance on capital structure and no dividends aligns with reinvestment priorities.
Which one has the best ratios?
HP Inc. holds an overall favorable rating with 71.43% of ratios positive, mainly driven by efficient capital returns despite liquidity and profitability issues. Super Micro’s ratio profile is more balanced with 35.71% favorable and neutral ratings, but its lack of dividends and higher valuation metrics reduce its appeal comparatively. Thus, HP Inc.’s ratios generally present a stronger case than Super Micro Computer’s.
Strategic Positioning
This section compares the strategic positioning of HP Inc. and Super Micro Computer, Inc., including market position, key segments, and exposure to technological disruption:
HP Inc.
- Large market cap with established presence on NYSE; moderate competitive pressure in computer hardware sector.
- Diversified business with Personal Systems, Printing, and Corporate Investments segments driving revenue.
- Exposure mainly through legacy and evolving personal computing and printing technologies; moderate disruption risk.
Super Micro Computer, Inc.
- Mid-sized market cap listed on NASDAQ; faces competitive pressure in server and storage hardware markets.
- Concentrated focus on server and storage systems plus subsystems and accessories segments.
- High exposure to disruption via modular, open architecture servers targeting AI, cloud, 5G, and edge computing.
HP Inc. vs Super Micro Computer, Inc. Positioning
HP Inc. follows a diversified strategic approach across personal computing, printing, and corporate investments, providing stable revenue streams but with some legacy exposure. Super Micro is more concentrated on high-performance server and storage solutions, focusing on emerging tech markets, which may present growth opportunities but narrower product breadth.
Which has the best competitive advantage?
HP Inc. demonstrates a slightly favorable moat by creating value despite a declining ROIC trend, indicating efficient capital use but some profitability pressures. Super Micro shows a slightly unfavorable moat with value destruction but improving ROIC, reflecting growth potential amid current challenges.
Stock Comparison
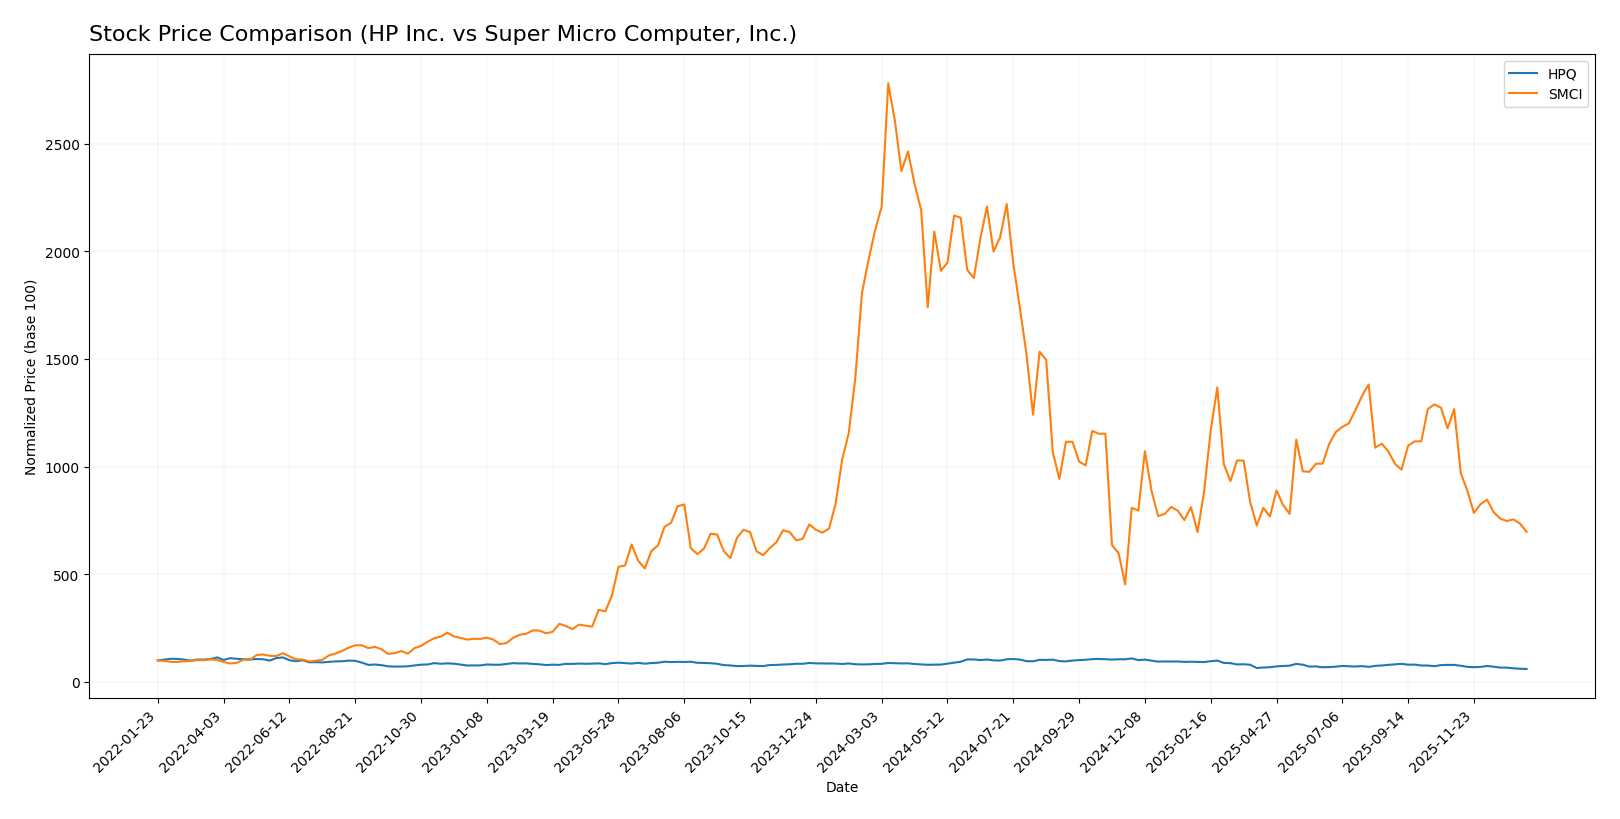
The stock price movements over the past year reveal significant declines for both HP Inc. and Super Micro Computer, Inc., with notable volatility and decelerating bearish trends impacting their trading dynamics.
Trend Analysis
HP Inc. experienced a bearish trend over the past 12 months, with a price decline of -27.98%. The trend shows deceleration, a standard deviation of 4.65, and price fluctuations between 21.08 and 38.13. Recent months confirm continued weakness.
Super Micro Computer, Inc. also faced a bearish trend, with a sharper price drop of -66.74% over the same period. The trend decelerated amid higher volatility, reflected by a standard deviation of 21.77 and a price range from 18.58 to 114. Recent data indicate an accelerated decline.
Comparing both, HP Inc. outperformed Super Micro Computer, Inc. by delivering the smaller percentage loss, indicating relatively better market performance despite both stocks trending downwards.
Target Prices
Analysts present a cautiously optimistic consensus for HP Inc. and Super Micro Computer, Inc.
| Company | Target High | Target Low | Consensus |
|---|---|---|---|
| HP Inc. | 30 | 20 | 24.8 |
| Super Micro Computer, Inc. | 64 | 26 | 49.71 |
The target consensus for HP Inc. at $24.8 suggests modest upside potential compared to its current price of $21.08. Super Micro’s consensus target of $49.71 indicates significant expected growth above its current $28.60 price level.
Analyst Opinions Comparison
This section compares analysts’ ratings and grades for HP Inc. and Super Micro Computer, Inc.:
Rating Comparison
HP Inc. Rating
- Rating: B- with a very favorable status, indicating a positive overall assessment.
- Discounted Cash Flow Score: 4, favorable, suggesting undervaluation based on cash flow projections.
- ROE Score: 1, very unfavorable, showing low efficiency in generating profit from equity.
- ROA Score: 4, favorable, demonstrating effective asset utilization.
- Debt To Equity Score: 1, very unfavorable, indicating higher financial risk.
- Overall Score: 2, moderate, reflecting average financial health.
Super Micro Computer, Inc. Rating
- Rating: B- with a very favorable status, indicating a positive overall assessment.
- Discounted Cash Flow Score: 1, very unfavorable, indicating potential overvaluation or weak cash flow.
- ROE Score: 4, favorable, reflecting strong profit generation from equity.
- ROA Score: 4, favorable, demonstrating effective asset utilization.
- Debt To Equity Score: 1, very unfavorable, indicating higher financial risk.
- Overall Score: 2, moderate, reflecting average financial health.
Which one is the best rated?
Both companies share the same overall rating of B- and an overall score of 2, indicating moderate financial health. HP Inc. scores better on discounted cash flow, while Super Micro Computer excels in return on equity.
Scores Comparison
Here is a comparison of the Altman Z-Score and Piotroski Score for HP Inc. and Super Micro Computer, Inc.:
HP Inc. Scores
- Altman Z-Score: 1.60, indicating financial distress zone.
- Piotroski Score: 6, reflecting average financial strength.
Super Micro Computer, Inc. Scores
- Altman Z-Score: 4.70, indicating a safe financial zone.
- Piotroski Score: 4, reflecting average financial strength.
Which company has the best scores?
Super Micro Computer, Inc. has a significantly higher Altman Z-Score, placing it in the safe zone, while HP Inc. is in financial distress. Both have average Piotroski scores, but HP’s is slightly higher.
Grades Comparison
Here is a comparison of the latest available grades for HP Inc. and Super Micro Computer, Inc.:
HP Inc. Grades
The following table lists recent grades assigned by recognized grading firms for HP Inc.:
| Grading Company | Action | New Grade | Date |
|---|---|---|---|
| Goldman Sachs | Maintain | Neutral | 2025-11-26 |
| Evercore ISI Group | Maintain | In Line | 2025-11-26 |
| Citigroup | Maintain | Neutral | 2025-11-26 |
| Morgan Stanley | Maintain | Underweight | 2025-11-26 |
| JP Morgan | Maintain | Neutral | 2025-11-26 |
| Barclays | Maintain | Equal Weight | 2025-11-26 |
| TD Cowen | Maintain | Hold | 2025-11-26 |
| UBS | Maintain | Neutral | 2025-11-26 |
| Morgan Stanley | Maintain | Underweight | 2025-11-21 |
| B of A Securities | Maintain | Neutral | 2025-11-21 |
Overall, HP Inc. shows a consistent pattern of neutral to hold ratings with no upgrades or downgrades recently.
Super Micro Computer, Inc. Grades
Below are recent grades assigned by established grading firms for Super Micro Computer, Inc.:
| Grading Company | Action | New Grade | Date |
|---|---|---|---|
| Barclays | Maintain | Equal Weight | 2024-10-02 |
| Loop Capital | Maintain | Buy | 2024-09-23 |
| JP Morgan | Downgrade | Neutral | 2024-09-06 |
| Barclays | Downgrade | Equal Weight | 2024-09-04 |
| Wells Fargo | Maintain | Equal Weight | 2024-08-28 |
| CFRA | Downgrade | Hold | 2024-08-28 |
| Barclays | Maintain | Overweight | 2024-08-28 |
| Goldman Sachs | Maintain | Neutral | 2024-08-08 |
| Rosenblatt | Maintain | Buy | 2024-08-07 |
| B of A Securities | Downgrade | Neutral | 2024-08-07 |
Super Micro Computer exhibits a mixed trend with several downgrades from buy or overweight to neutral or hold, but some buy ratings remain.
Which company has the best grades?
HP Inc. has predominantly neutral and hold ratings with no recent changes, indicating stable but cautious sentiment. Super Micro Computer, Inc. has experienced multiple downgrades but retains some buy ratings, reflecting more mixed analyst views. Investors may interpret HP’s consistent neutrality as lower volatility in analyst opinions, whereas Super Micro’s varied grades suggest greater uncertainty or evolving perspectives.
Strengths and Weaknesses
Below is a comparison table highlighting the key strengths and weaknesses of HP Inc. and Super Micro Computer, Inc. based on the most recent data.
| Criterion | HP Inc. | Super Micro Computer, Inc. |
|---|---|---|
| Diversification | High – diversified across Personal Systems (38.5B), Printing (16.7B), Corporate Investments | Moderate – focused mainly on Server & Storage Systems (21.3B) and accessories |
| Profitability | Moderate – ROIC 24.97% (favorable), net margin 4.57% (unfavorable), declining ROIC trend | Improving – ROIC 9.26% (neutral), net margin 4.77% (unfavorable), growing ROIC trend |
| Innovation | Moderate – sustained investments but ROIC trend declining suggest innovation challenges | Growing – rising ROIC indicates improving operational efficiency and innovation |
| Global presence | Strong – large scale operations with global distribution | Growing – expanding sales but less diversified geographically |
| Market Share | Large in personal computing and printing markets | Niche player in server and storage systems, growing market share |
Key takeaways: HP Inc. maintains strong diversification and profitability but faces a declining ROIC trend, signaling caution. Super Micro Computer shows improving profitability and innovation momentum but has a narrower product focus and a neutral overall financial position. Risk-averse investors may favor HP for stability, while those seeking growth might consider Super Micro’s improving trajectory.
Risk Analysis
Below is a table summarizing key risks for HP Inc. and Super Micro Computer, Inc. based on their 2025 financial and operational profiles:
| Metric | HP Inc. (HPQ) | Super Micro Computer, Inc. (SMCI) |
|---|---|---|
| Market Risk | Beta 1.22, moderate volatility | Beta 1.53, higher volatility |
| Debt Level | Low debt-to-assets 26%, favorable leverage | Moderate debt-to-assets 34%, neutral leverage |
| Regulatory Risk | Moderate, global operations with some exposure | Moderate, exposure through international sales |
| Operational Risk | Large workforce (58K), complex segments; possible supply chain pressures | Smaller workforce (5.7K), niche high-performance servers; supply chain sensitivity |
| Environmental Risk | Moderate, printing and hardware manufacturing impacts | Moderate, manufacturing and data center energy use |
| Geopolitical Risk | US-based with international sales; subject to trade tensions | US-based with global footprint; sensitive to global tech policies |
Synthesis: HP Inc. faces moderate market and operational risks due to its size and product diversity, but benefits from low leverage and stable dividend yield. Super Micro carries higher market volatility and moderate debt, with operational sensitivity to supply chains and geopolitical tech restrictions, which may impact growth prospects more significantly in 2026.
Which Stock to Choose?
HP Inc. (HPQ) shows a mixed income evolution with mostly unfavorable growth trends and a global income statement rated unfavorable. Its financial ratios are mostly favorable (71%), including strong ROIC and WACC, despite weak profitability and a moderate debt level. The overall rating is very favorable (B-), though its Altman Z-Score suggests financial distress risk.
Super Micro Computer, Inc. (SMCI) exhibits strong income growth over the period with a favorable global income statement rating. Its financial ratios show a balanced profile with 36% favorable and 36% unfavorable metrics, and a slightly unfavorable moat due to ROIC below WACC but improving profitability. SMCI’s rating is very favorable (B-) with a safe zone Altman Z-Score.
Investors focused on value creation and financial stability might find HPQ’s strong ratio favorability and moderate rating appealing, while those prioritizing growth potential and improving profitability could see SMCI as more attractive. The interpretation may vary depending on risk tolerance and investment strategy.
Disclaimer: Investment carries a risk of loss of initial capital. The past performance is not a reliable indicator of future results. Be sure to understand risks before making an investment decision.
Go Further
I encourage you to read the complete analyses of HP Inc. and Super Micro Computer, Inc. to enhance your investment decisions: