Home > Comparison > Technology > STX vs HPQ
The strategic rivalry between Seagate Technology Holdings plc and HP Inc. shapes the competitive dynamics of the technology sector. Seagate excels as a capital-intensive leader in data storage hardware, while HP operates a diversified model focused on personal computing and printing solutions. This analysis pits Seagate’s specialized scale against HP’s broad market reach to identify which offers superior risk-adjusted returns for a diversified portfolio.
Table of contents
Companies Overview
Seagate Technology Holdings and HP Inc. both anchor the competitive computer hardware landscape with distinct market roles.
Seagate Technology Holdings plc: Data Storage Innovator
Seagate dominates as a mass capacity storage provider with a portfolio spanning enterprise HDDs, SSDs, and external drives. Its revenue largely stems from OEM sales and distribution of cutting-edge storage solutions worldwide. In 2026, Seagate sharpens its strategic focus on expanding the Lyve edge-to-cloud platform, aiming to capture growing demand for scalable, high-capacity data storage.
HP Inc.: Personal Computing and Printing Leader
HP Inc. commands the personal systems and printing markets, generating income from commercial and consumer PCs, printers, and related services. It serves a diverse client base including SMBs and large enterprises. HP’s 2026 strategy centers on innovation in integrated hardware-software solutions across its Personal Systems and Printing segments to sustain competitive differentiation.
Strategic Collision: Similarities & Divergences
Seagate pursues a specialized storage-centric model, while HP embraces a broader device and service ecosystem. Their market rivalry intensifies in hardware innovation and enterprise client acquisition. Seagate’s niche in data storage contrasts sharply with HP’s diversified portfolio, offering distinct investment profiles grounded in focused specialization versus multi-segment exposure.
Income Statement Comparison
This data dissects the core profitability and scalability of both corporate engines to reveal who dominates the bottom line:
| Metric | Seagate Technology Holdings plc (STX) | HP Inc. (HPQ) |
|---|---|---|
| Revenue | 9.1B | 55.3B |
| Cost of Revenue | 5.9B | 44.2B |
| Operating Expenses | 1.3B | 7.4B |
| Gross Profit | 3.2B | 11.0B |
| EBITDA | 2.1B | 4.1B |
| EBIT | 1.8B | 3.2B |
| Interest Expense | 321M | 506M |
| Net Income | 1.5B | 2.5B |
| EPS | 6.93 | 2.67 |
| Fiscal Year | 2025 | 2025 |
Income Statement Analysis: The Bottom-Line Duel
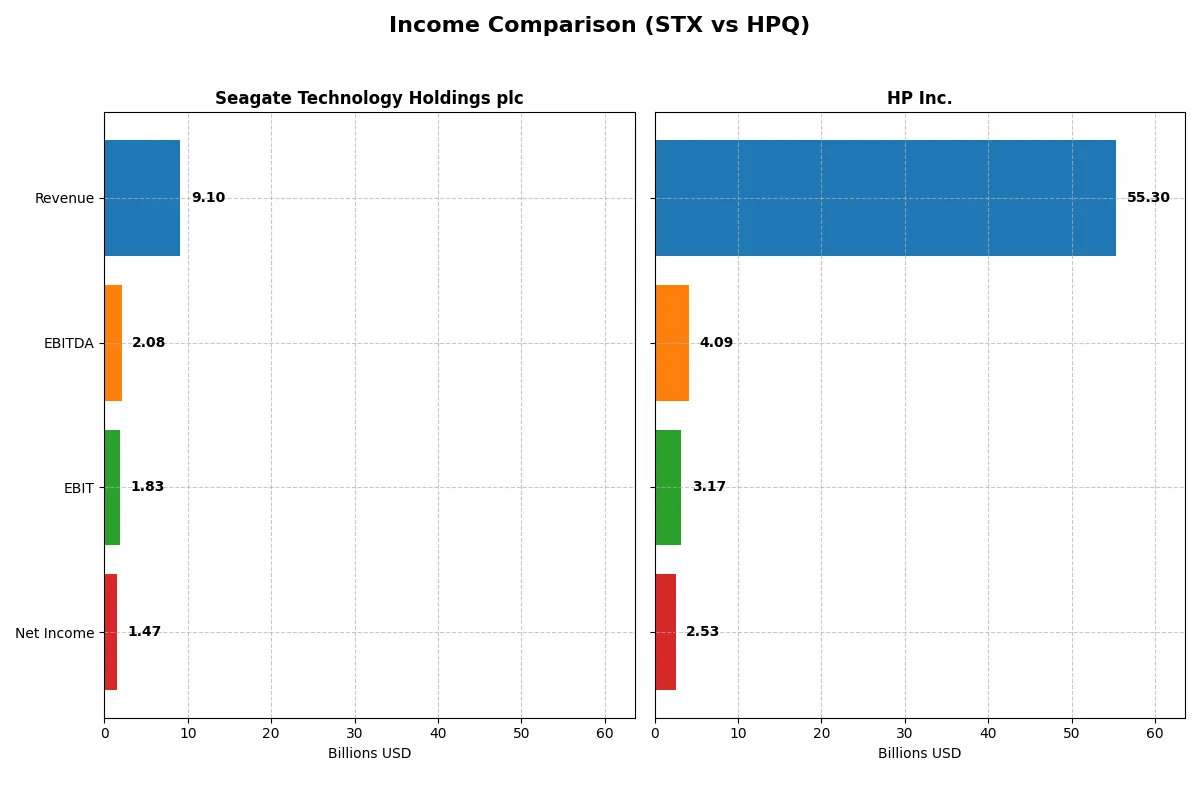
The following income statement comparison reveals the true efficiency of Seagate Technology and HP Inc. as corporate engines generating shareholder value.
Seagate Technology Holdings plc Analysis
Seagate’s revenue dipped slightly over five years but rebounded strongly in 2025 to $9.1B, with net income surging to $1.47B. Gross margin improved to 35.2%, reflecting better cost controls. The net margin climbed to 16.2%, signaling efficient operations and impressive earnings momentum in the latest fiscal year.
HP Inc. Analysis
HP’s revenue showed modest growth to $55.3B in 2025 but declined over the longer term. Gross margin held at a neutral 20.0%, while net margin remained slim at 4.6%. The company’s net income dropped sharply across five years, reaching $2.53B in 2025, indicating weaker profitability and deteriorating earnings quality.
Margin Efficiency vs. Scale and Decline
Seagate outperforms HP with superior margin expansion and net income growth despite a smaller revenue base. HP’s scale is undeniable but masks deteriorating profitability and declining earnings over time. For investors, Seagate’s profile offers stronger operational efficiency and growth momentum, whereas HP’s scale comes with significant margin and earnings risks.
Financial Ratios Comparison
These vital ratios act as a diagnostic tool to expose the underlying fiscal health, valuation premiums, and capital efficiency of the companies compared below:
| Ratios | Seagate Technology Holdings plc (STX) | HP Inc. (HPQ) |
|---|---|---|
| ROE | -3.24% (2025) | -7.31% (2025) |
| ROIC | 33.76% (2025) | 24.97% (2025) |
| P/E | 20.41 (2025) | 10.35 (2025) |
| P/B | -66.19 (2025) | -75.65 (2025) |
| Current Ratio | 1.38 (2025) | 0.77 (2025) |
| Quick Ratio | 0.84 (2025) | 0.48 (2025) |
| D/E (Debt-to-Equity) | -11.86 (2025) | -31.45 (2025) |
| Debt-to-Assets | 67.0% (2025) | 26.1% (2025) |
| Interest Coverage | 5.89 (2025) | 7.16 (2025) |
| Asset Turnover | 1.13 (2025) | 1.32 (2025) |
| Fixed Asset Turnover | 5.49 (2025) | 13.23 (2025) |
| Payout Ratio | 40.8% (2025) | 43.0% (2025) |
| Dividend Yield | 2.00% (2025) | 4.16% (2025) |
| Fiscal Year | 2025 | 2025 |
Efficiency & Valuation Duel: The Vital Signs
Financial ratios act as a company’s DNA, revealing hidden risks and operational excellence through measurable insights.
Seagate Technology Holdings plc
Seagate shows a strong net margin at 16.15%, signaling efficient core profitability despite a deeply negative ROE of -324%. Its P/E of 20.41 suggests a fairly valued stock, not stretched by the market. Shareholders gain a 2% dividend yield, reflecting a balanced return strategy alongside solid reinvestment in operations and R&D.
HP Inc.
HP posts a modest net margin of 4.57%, indicating weaker profitability. The stock trades at a lower P/E of 10.35, appearing undervalued or more attractively priced. HP offers a higher dividend yield of 4.16%, highlighting a shareholder-friendly payout, though its low current ratio flags liquidity concerns. Reinvestment leans towards steady operating cash flow.
Balanced Profitability vs. Dividend Appeal
Seagate delivers stronger profitability with moderate valuation, while HP emphasizes shareholder returns through dividends despite weaker margins. Seagate suits investors prioritizing operational efficiency; HP fits those seeking income with value exposure. Each presents distinct risk-reward profiles based on these ratio fundamentals.
Which one offers the Superior Shareholder Reward?
I observe Seagate Technology (STX) delivers a 2.0% dividend yield with a 41% payout ratio, supported by 75% FCF coverage. Its robust share buybacks complement distributions, signaling commitment to shareholder returns. Conversely, HP Inc. (HPQ) yields 4.2% with a 43% payout ratio and strong dividend+capex coverage of 186%, backed by consistent buybacks. While HPQ offers higher yield and safer dividend coverage, STX’s combination of moderate yield and aggressive buybacks suggests superior total return potential in 2026. I favor STX for a balanced, sustainable reward profile with growth-driven capital allocation.
Comparative Score Analysis: The Strategic Profile
The radar chart reveals the fundamental DNA and trade-offs of Seagate Technology and HP Inc., highlighting their core financial strengths and vulnerabilities:
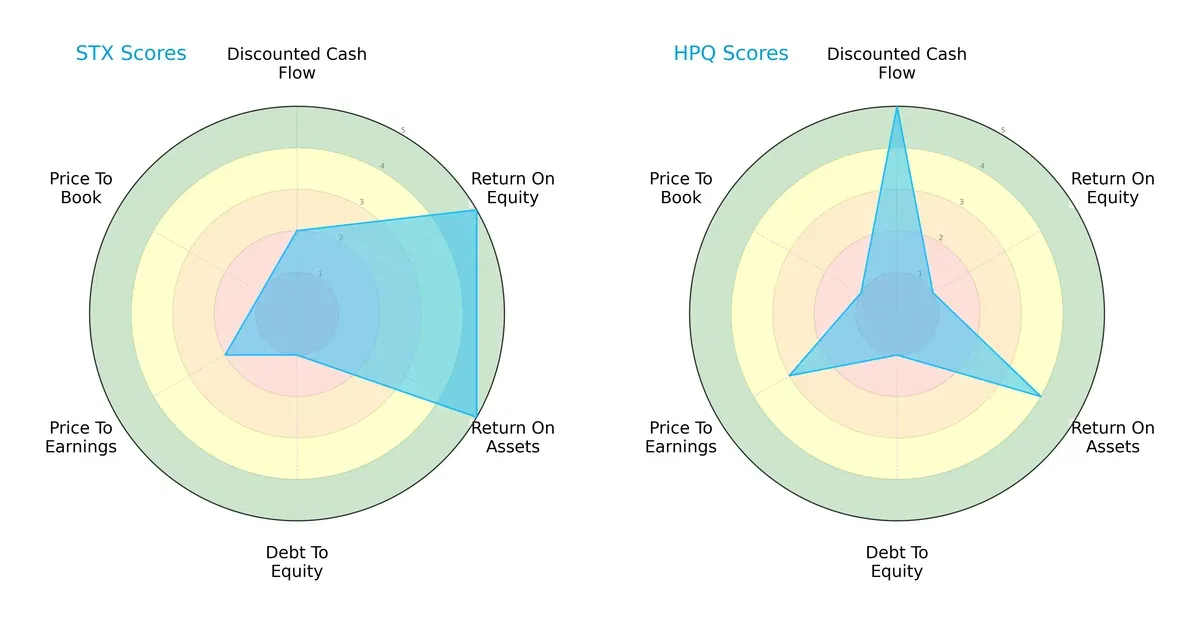
Seagate dominates in profitability metrics with top-tier ROE (5) and ROA (5) scores, signaling efficient capital and asset use. HP excels in discounted cash flow (5), indicating stronger valuation based on future cash flows. Both firms share weak debt-to-equity scores (1), reflecting high leverage risk. Seagate’s valuation scores lag (PE 2, PB 1), while HP shows moderate valuation (PE 3). Overall, Seagate’s profile is more balanced on operations, while HP leverages valuation strength but suffers profitability weaknesses.
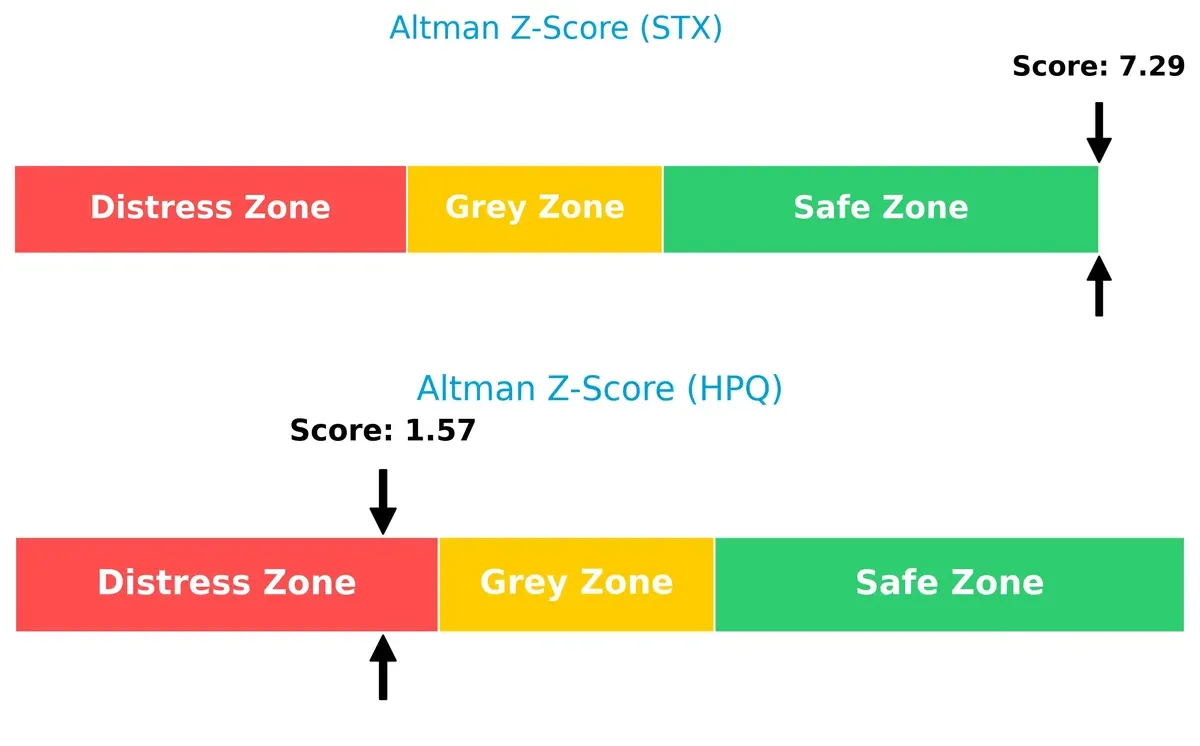
Bankruptcy Risk: Solvency Showdown
Seagate’s Altman Z-Score of 7.29 firmly places it in the safe zone, signaling robust long-term solvency. HP’s score of 1.57 lands in the distress zone, highlighting elevated bankruptcy risk under current market conditions:
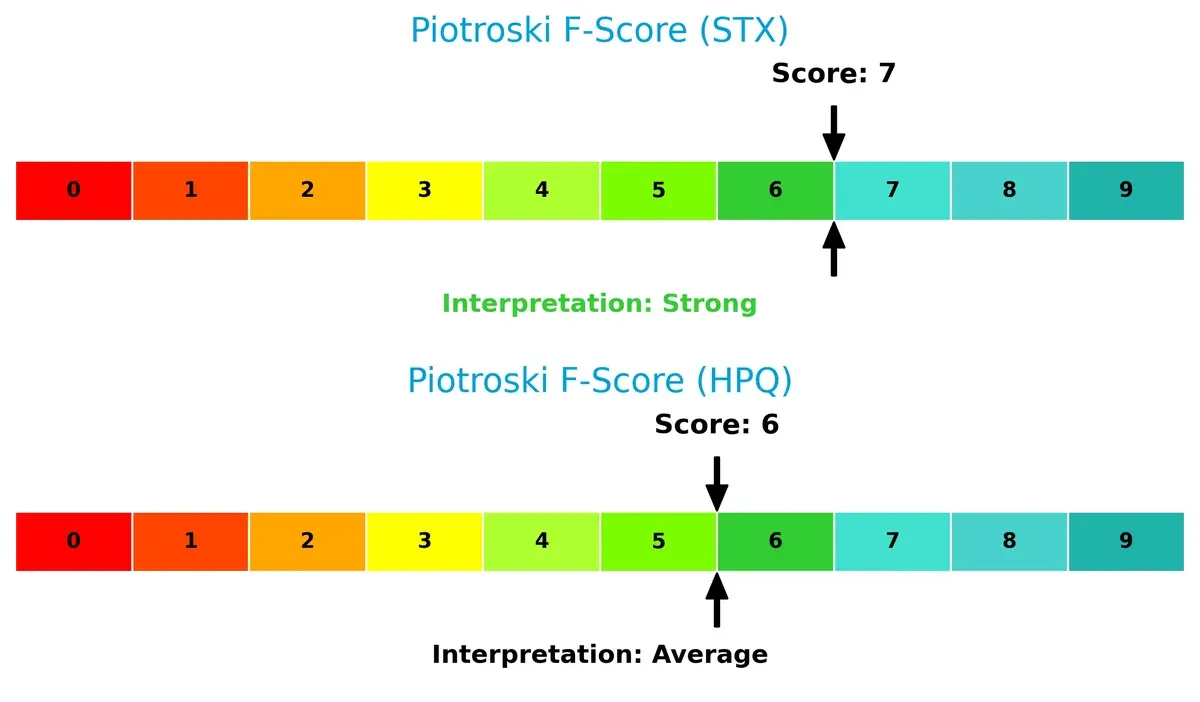
Financial Health: Quality of Operations
Seagate’s Piotroski F-Score of 7 indicates strong financial health and operational quality. HP’s score of 6 is average, suggesting some internal red flags compared to Seagate’s superior financial discipline:
How are the two companies positioned?
This section dissects the operational DNA of Seagate Technology and HP by comparing their revenue distribution and internal dynamics. The goal is to confront their economic moats to identify which model offers the most resilient competitive advantage today.
Revenue Segmentation: The Strategic Mix
This visual comparison dissects how Seagate Technology and HP Inc. diversify their income streams and where their primary sector bets lie:
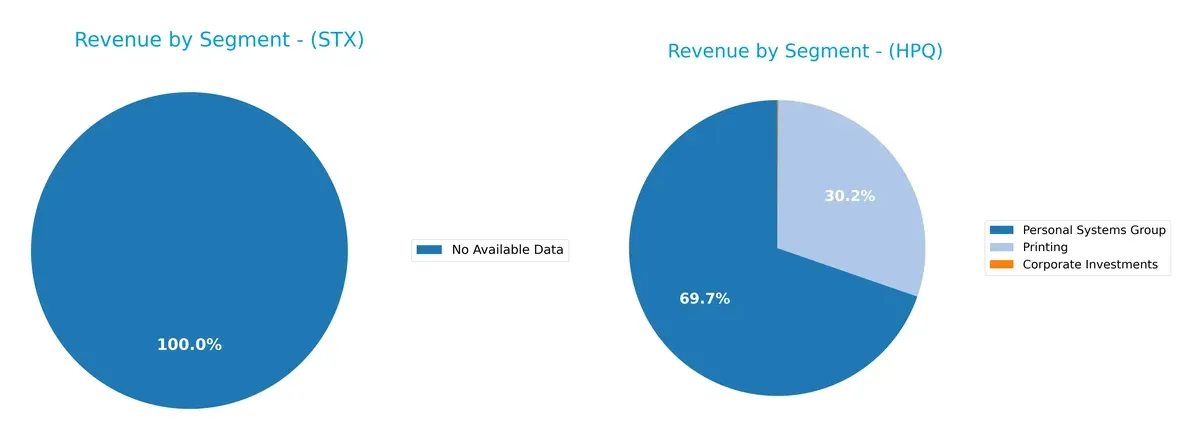
Seagate Technology lacks available segment data, preventing a direct comparison. HP Inc. anchors its revenue in Personal Systems Group at $38.5B and Printing at $16.7B. Corporate Investments play a minor role at $62M. HP’s mix shows strong reliance on two dominant segments, indicating moderate diversification but potential concentration risk if either market weakens. This focus supports ecosystem lock-in around personal and printing solutions.
Strengths and Weaknesses Comparison
This table compares the Strengths and Weaknesses of Seagate Technology Holdings plc and HP Inc.:
Seagate Technology Holdings plc Strengths
- Strong net margin at 16.15%
- High ROIC of 33.76% above WACC
- Favorable interest coverage ratio at 5.71
- Dividend yield of 2.0% supports shareholder returns
- Solid asset turnover ratios indicating efficient asset use
HP Inc. Strengths
- Favorable ROIC of 24.97% exceeds WACC of 7.52%
- Higher dividend yield at 4.16%
- Strong fixed asset turnover at 13.23
- Lower debt-to-assets ratio at 26.05%
- Favorable PE ratio of 10.35 suggests valuation appeal
Seagate Technology Holdings plc Weaknesses
- Negative ROE at -324.28% signals equity profitability issues
- High debt-to-assets ratio of 66.97% raises financial risk
- WACC at 11.1% is unfavorable
- Current and quick ratios near neutrality may limit liquidity flexibility
HP Inc. Weaknesses
- Negative ROE at -730.92% reflects poor equity returns
- Low current ratio at 0.77 and quick ratio at 0.48 indicate liquidity concerns
- Net margin at 4.57% is low compared to peers
- Slightly higher unfavorable ratio percentage at 28.57%
Seagate shows strong operational efficiency and profitability metrics but carries higher leverage risks. HP benefits from better liquidity and lower leverage but faces challenges in profitability and equity returns. Both companies display areas requiring strategic focus given their contrasting financial profiles.
The Moat Duel: Analyzing Competitive Defensibility
A structural moat alone shields long-term profits from relentless competitive pressures in technology hardware companies:
Seagate Technology Holdings plc: Cost Leadership and Scale Advantage
Seagate’s moat stems from superior cost efficiency and scale in data storage manufacturing, reflected in a strong 22.7% ROIC premium over WACC. Its expanding product mix and cloud storage platforms deepen this edge in 2026.
HP Inc.: Brand and Diversification Moat with Margin Pressure
HP relies on brand loyalty and diversified product lines across printing and computing. However, a 17.5% ROIC premium is shrinking amid margin compression and declining profitability trends, challenging its moat’s durability.
Cost Efficiency vs. Brand Diversification: The Moat Battle
Seagate commands a wider and growing moat through operational excellence and innovation. HP’s moat is narrower and eroding due to margin headwinds. I see Seagate better positioned to defend market share long term.
Which stock offers better returns?
The past year reveals starkly contrasting price movements and trading dynamics between Seagate Technology Holdings plc and HP Inc., highlighting divergent investor sentiment and momentum.
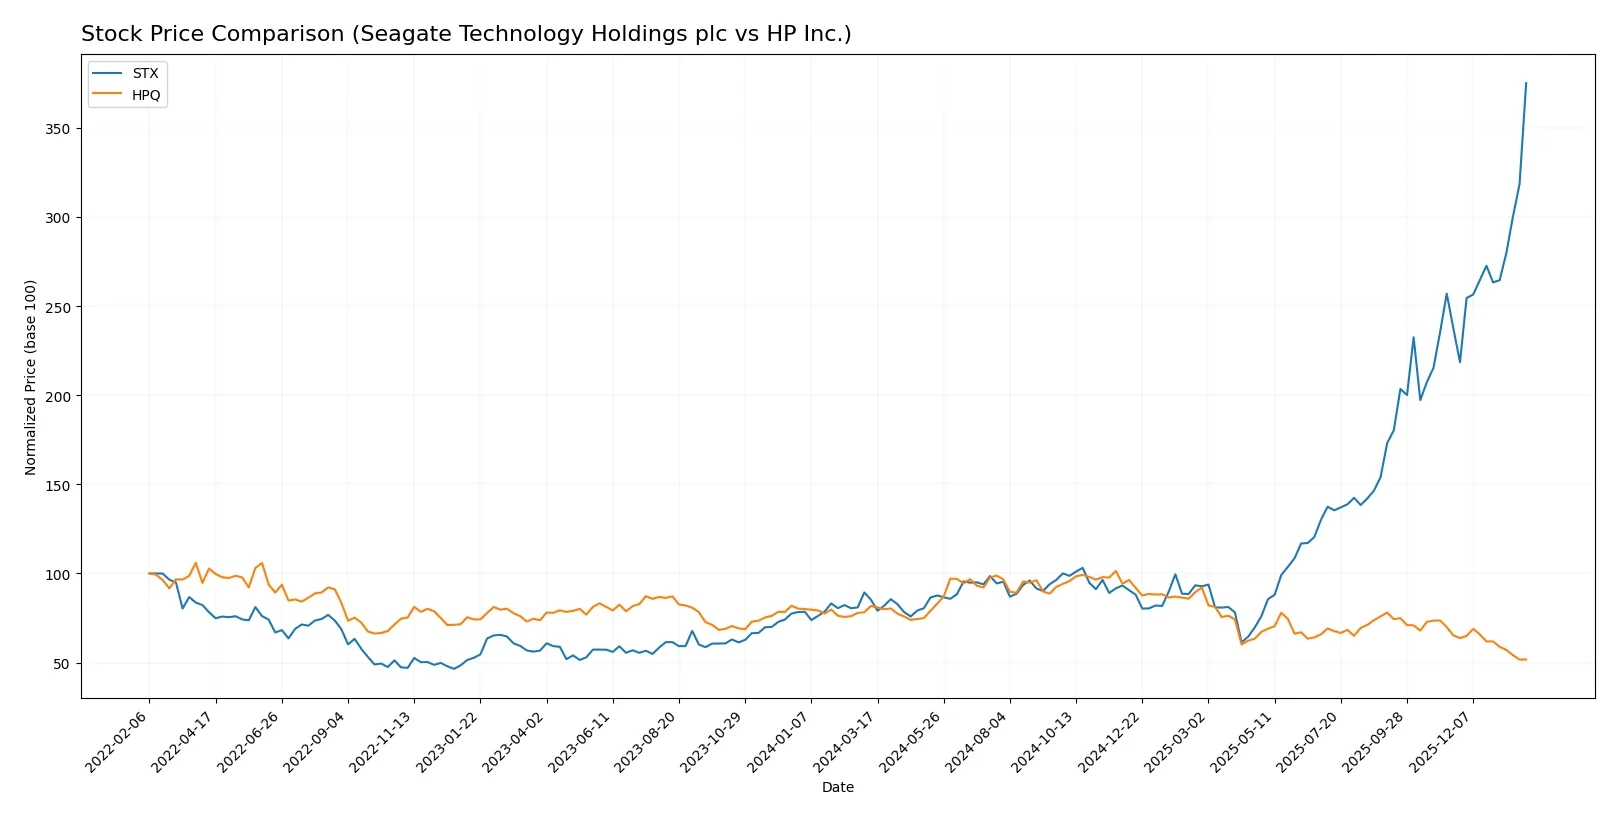
Trend Comparison
Seagate Technology Holdings plc’s stock rose 340% over the past 12 months, showing a strong bullish trend with accelerating gains. It reached a high of 407.69 and a low of 66.73, reflecting significant volatility with a standard deviation of 73.81.
HP Inc.’s stock declined 37% over the same period, marking a bearish trend with decelerating losses. The stock fluctuated between 38.13 and 19.43, exhibiting low volatility at a 4.9 standard deviation.
Seagate’s stock clearly outperformed HP Inc., delivering substantially higher returns with strong buyer dominance and accelerating momentum compared to HP’s sustained decline.
Target Prices
Analysts present a mixed target price consensus reflecting varied expectations for these technology hardware firms.
| Company | Target Low | Target High | Consensus |
|---|---|---|---|
| Seagate Technology Holdings plc | 270 | 505 | 407.2 |
| HP Inc. | 18 | 30 | 23.33 |
Seagate’s consensus target aligns closely with its current price near 408, suggesting limited upside. HP’s target consensus at 23.33 exceeds its current 19.44, indicating moderate growth potential.

Don’t Let Luck Decide Your Entry Point
Optimize your entry points with our advanced ProRealTime indicators. You’ll get efficient buy signals with precise price targets for maximum performance. Start outperforming now!
How do institutions grade them?
Seagate Technology Holdings plc Grades
The following table summarizes the most recent institutional grades for Seagate Technology:
| Grading Company | Action | New Grade | Date |
|---|---|---|---|
| Citigroup | maintain | Buy | 2026-01-29 |
| Baird | maintain | Outperform | 2026-01-29 |
| Rosenblatt | maintain | Buy | 2026-01-28 |
| Wells Fargo | maintain | Equal Weight | 2026-01-28 |
| Cantor Fitzgerald | maintain | Overweight | 2026-01-28 |
| Mizuho | maintain | Outperform | 2026-01-28 |
| UBS | maintain | Neutral | 2026-01-28 |
| Goldman Sachs | maintain | Buy | 2026-01-28 |
| Barclays | maintain | Equal Weight | 2026-01-28 |
| Mizuho | maintain | Outperform | 2026-01-27 |
HP Inc. Grades
The following table summarizes the most recent institutional grades for HP Inc.:
| Grading Company | Action | New Grade | Date |
|---|---|---|---|
| Morgan Stanley | maintain | Underweight | 2026-01-20 |
| Citigroup | maintain | Neutral | 2026-01-20 |
| Barclays | downgrade | Underweight | 2026-01-16 |
| Morgan Stanley | maintain | Underweight | 2025-11-26 |
| Evercore ISI Group | maintain | In Line | 2025-11-26 |
| Citigroup | maintain | Neutral | 2025-11-26 |
| UBS | maintain | Neutral | 2025-11-26 |
| Goldman Sachs | maintain | Neutral | 2025-11-26 |
| TD Cowen | maintain | Hold | 2025-11-26 |
| Barclays | maintain | Equal Weight | 2025-11-26 |
Which company has the best grades?
Seagate Technology consistently receives Buy and Outperform grades from major institutions, signaling relative strength. HP Inc. shows predominantly Neutral to Underweight ratings, indicating weaker sentiment. Investors may view Seagate’s grades as reflecting better near-term prospects.
Risks specific to each company
The following categories identify the critical pressure points and systemic threats facing both firms in the 2026 market environment:
1. Market & Competition
Seagate Technology Holdings plc
- Faces intense competition in data storage technology, requiring innovation to maintain market share.
HP Inc.
- Competes in personal computing and printing, sectors pressured by rapid tech evolution and commoditization.
2. Capital Structure & Debt
Seagate Technology Holdings plc
- High debt-to-assets ratio at 67% signals leverage risk despite favorable interest coverage.
HP Inc.
- Lower leverage with 26% debt-to-assets, indicating a stronger balance sheet and reduced financial risk.
3. Stock Volatility
Seagate Technology Holdings plc
- Beta of 1.62 shows above-market volatility, increasing investment risk in unstable markets.
HP Inc.
- Beta of 1.22 suggests moderate volatility, slightly more stable than Seagate’s stock behavior.
4. Regulatory & Legal
Seagate Technology Holdings plc
- Operates globally with exposure to diverse regulatory regimes, increasing compliance complexity.
HP Inc.
- U.S.-based but international, faces regulatory scrutiny especially in technology and printing sectors.
5. Supply Chain & Operations
Seagate Technology Holdings plc
- Supply chain risks tied to advanced components and global logistics for storage devices.
HP Inc.
- Relies on complex supply chains for PCs and printers, vulnerable to component shortages and delays.
6. ESG & Climate Transition
Seagate Technology Holdings plc
- Pressure to reduce carbon footprint in data center operations and manufacturing processes.
HP Inc.
- Faces increasing ESG demands, especially in product lifecycle management and e-waste reduction.
7. Geopolitical Exposure
Seagate Technology Holdings plc
- Significant international footprint exposes it to geopolitical tensions and trade restrictions.
HP Inc.
- U.S. headquarters may limit risk, but global supply chains and markets remain vulnerable to geopolitical shifts.
Which company shows a better risk-adjusted profile?
Seagate’s highest risk is its elevated leverage, posing financial strain despite strong operational returns. HP’s chief risk lies in weak liquidity ratios, signaling potential short-term funding issues. Between the two, HP presents a better risk-adjusted profile, supported by lower leverage and safer debt levels. However, Seagate’s strong Altman Z-Score of 7.29 versus HP’s 1.57 highlights Seagate’s superior bankruptcy risk management despite leverage concerns. The recent spike in Seagate’s beta to 1.62 cautions investors about stock volatility in turbulent markets.
Final Verdict: Which stock to choose?
Seagate Technology Holdings plc (STX) excels as a cash-generating powerhouse with a durable economic moat supported by a strong and growing ROIC well above its cost of capital. Its aggressive capital allocation fuels rapid profitability gains. The point of vigilance is its high leverage, which could amplify risks in downturns. STX suits aggressive growth portfolios seeking value creation.
HP Inc. (HPQ) boasts a strategic moat rooted in efficient asset turnover and solid free cash flow yield. Its lower debt burden and better interest coverage provide a safer financial profile versus STX. However, declining profitability trends temper enthusiasm. HPQ fits portfolios focused on growth at a reasonable price (GARP) with an emphasis on stability.
If you prioritize aggressive growth and value creation through efficient capital use, Seagate outshines with its accelerating profitability despite higher leverage. However, if you seek a more stable investment with lower financial risk and decent cash flow, HP offers better stability, though with a declining profitability trend and bearish price momentum. Each stock appeals to distinct investor profiles with differing risk appetites and strategic goals.
Disclaimer: Investment carries a risk of loss of initial capital. The past performance is not a reliable indicator of future results. Be sure to understand risks before making an investment decision.
Go Further
I encourage you to read the complete analyses of Seagate Technology Holdings plc and HP Inc. to enhance your investment decisions: