In the fast-evolving technology sector, HP Inc. and Rigetti Computing, Inc. represent two distinct yet overlapping forces in computer hardware. HP, a longstanding leader in personal computing and printing, contrasts with Rigetti’s cutting-edge focus on quantum computing innovation. This comparison reveals how traditional and emerging technologies compete and complement each other. Join me as we explore which company offers the most compelling opportunity for investors today.
Table of contents
Companies Overview
I will begin the comparison between HP Inc. and Rigetti Computing, Inc. by providing an overview of these two companies and their main differences.
HP Inc. Overview
HP Inc. is a well-established technology company specializing in personal computing, imaging, and printing products, along with related technologies and services. It operates through three segments: Personal Systems, Printing, and Corporate Investments. Serving a broad customer base including consumers, businesses, and government sectors, HP Inc. has a market cap of approximately 19.7B and employs around 58,000 people worldwide.
Rigetti Computing, Inc. Overview
Rigetti Computing, Inc. is a newer player founded in 2013, focusing on the development of quantum computers and superconducting quantum processors. The company integrates its machines into various cloud environments via its Quantum Cloud Services platform. With a market cap near 8.1B, Rigetti is significantly smaller, employing about 137 people and operating primarily in the cutting-edge quantum computing space.
Key similarities and differences
Both HP Inc. and Rigetti operate in the technology sector, specifically within computer hardware, but their business models differ substantially. HP focuses on traditional computing and printing solutions for a diverse customer base, whereas Rigetti targets the emerging quantum computing market with specialized hardware and cloud integration. HP’s scale and diversified segments contrast with Rigetti’s niche focus on quantum technology and smaller workforce.
Income Statement Comparison
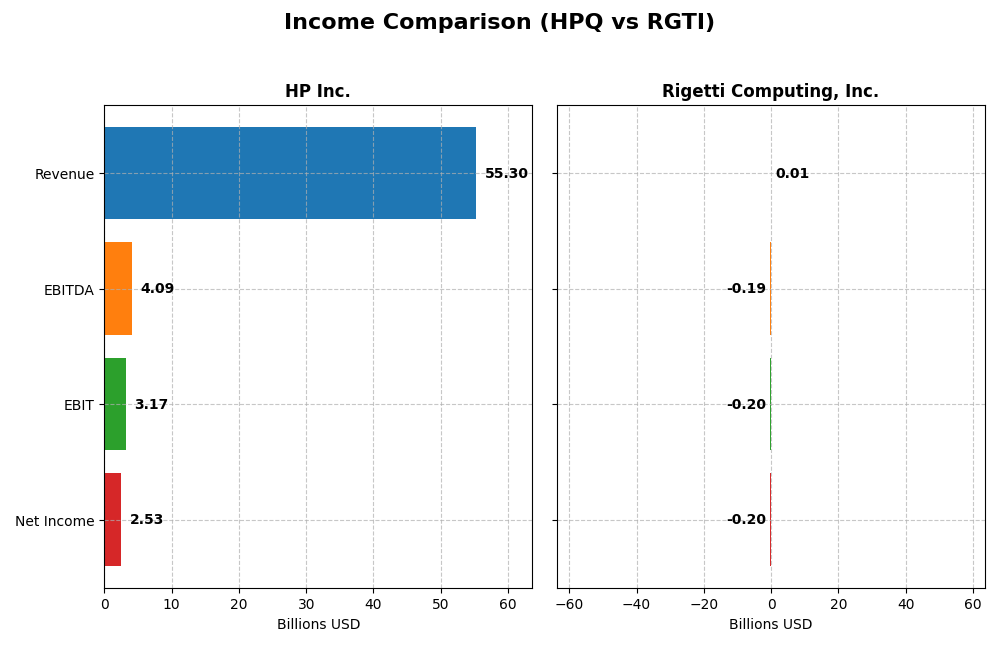
This table compares key income statement metrics for HP Inc. and Rigetti Computing, Inc. for their most recent fiscal years, highlighting their financial scale and profitability.
| Metric | HP Inc. (HPQ) | Rigetti Computing, Inc. (RGTI) |
|---|---|---|
| Market Cap | 19.7B | 8.1B |
| Revenue | 55.3B | 10.8M |
| EBITDA | 4.1B | -191M |
| EBIT | 3.2B | -198M |
| Net Income | 2.5B | -201M |
| EPS | 2.67 | -1.09 |
| Fiscal Year | 2025 | 2024 |
Income Statement Interpretations
HP Inc.
HP Inc. experienced declining revenue and net income over 2021-2025, with revenue falling from $63.5B to $55.3B and net income dropping from $6.5B to $2.5B. Margins weakened, with gross margin near 20% and net margin at 4.6% in 2025. The latest year showed modest revenue growth of 3.2% but declining profitability and margins, reflecting operational pressures.
Rigetti Computing, Inc.
Rigetti Computing’s revenue grew overall from $5.5M in 2020 to $10.8M in 2024 but declined 10.1% in the last year. Net income remained deeply negative, worsening to a $201M loss in 2024. Despite a strong gross margin of 52.8%, EBIT and net margins were heavily negative, and profitability deteriorated significantly in the most recent period.
Which one has the stronger fundamentals?
HP Inc. shows more stable fundamentals with positive earnings and moderate margins, despite recent declines in profitability and revenue. Rigetti exhibits high revenue growth but sustained and increasing losses with negative margins and worsening net income. Both face challenges, but HP’s scale and profitability position it with comparatively stronger income fundamentals.
Financial Ratios Comparison
The table below presents a side-by-side comparison of key financial ratios for HP Inc. and Rigetti Computing, Inc. based on their most recent fiscal year data, highlighting differences in profitability, liquidity, leverage, and market valuation.
| Ratios | HP Inc. (2025) | Rigetti Computing, Inc. (2024) |
|---|---|---|
| ROE | -7.31% | -158.77% |
| ROIC | 24.97% | -24.91% |
| P/E | 10.35 | -14.02 |
| P/B | -75.65 | 22.26 |
| Current Ratio | 0.77 | 17.42 |
| Quick Ratio | 0.48 | 17.42 |
| D/E (Debt-to-Equity) | -31.45 | 0.07 |
| Debt-to-Assets | 26.05% | 3.09% |
| Interest Coverage | 7.16 | -21.05 |
| Asset Turnover | 1.32 | 0.04 |
| Fixed Asset Turnover | 13.23 | 0.20 |
| Payout Ratio | 43.02% | 0% |
| Dividend Yield | 4.16% | 0% |
Interpretation of the Ratios
HP Inc.
HP Inc. presents mostly favorable ratios, including a strong return on invested capital (25%) and a low debt-to-assets ratio (26%), but has weaknesses such as a negative return on equity (-730.92%) and a low current ratio (0.77). The company pays dividends with a 4.16% yield, supported by free cash flow, though caution is warranted due to some uneven profitability indicators.
Rigetti Computing, Inc.
Rigetti Computing shows predominantly unfavorable ratios, including a deeply negative net margin (-1862.72%) and return on equity (-158.77%), coupled with a very high current ratio (17.42) which may indicate inefficient asset use. It does not pay dividends, reflecting its high-growth phase and reinvestment strategy, prioritizing R&D over shareholder returns.
Which one has the best ratios?
HP Inc. holds the advantage with 71% favorable ratios reflecting stronger profitability, capital efficiency, and dividend yield. Rigetti’s ratios are mostly unfavorable at 71%, indicating operational and financial challenges typical of a growth-stage tech company, making HP a relatively more stable profile based on these metrics.
Strategic Positioning
This section compares the strategic positioning of HP Inc. and Rigetti Computing, Inc., including their market position, key segments, and exposure to technological disruption:
HP Inc.
- Established market player with 20B market cap facing moderate competitive pressure.
- Diverse revenue streams: Personal Systems (38.5B), Printing (16.7B), Corporate Investments (62M).
- Moderate exposure to technological disruption, focused on traditional computer hardware and printing.
Rigetti Computing, Inc.
- Smaller market cap of 8B, higher beta indicating greater volatility and pressure.
- Concentrated on quantum computing systems and professional research services.
- High exposure as a pioneer in quantum computing and cloud-based quantum services.
HP Inc. vs Rigetti Computing, Inc. Positioning
HP Inc. follows a diversified model across established hardware and printing segments, providing stability but limited growth in emerging tech. Rigetti is highly concentrated in quantum computing, offering innovation potential but facing higher market risks and volatility.
Which has the best competitive advantage?
HP Inc. shows a slightly favorable moat by creating value despite declining profitability. Rigetti has a slightly unfavorable moat, currently shedding value but improving profitability, reflecting a riskier competitive position.
Stock Comparison
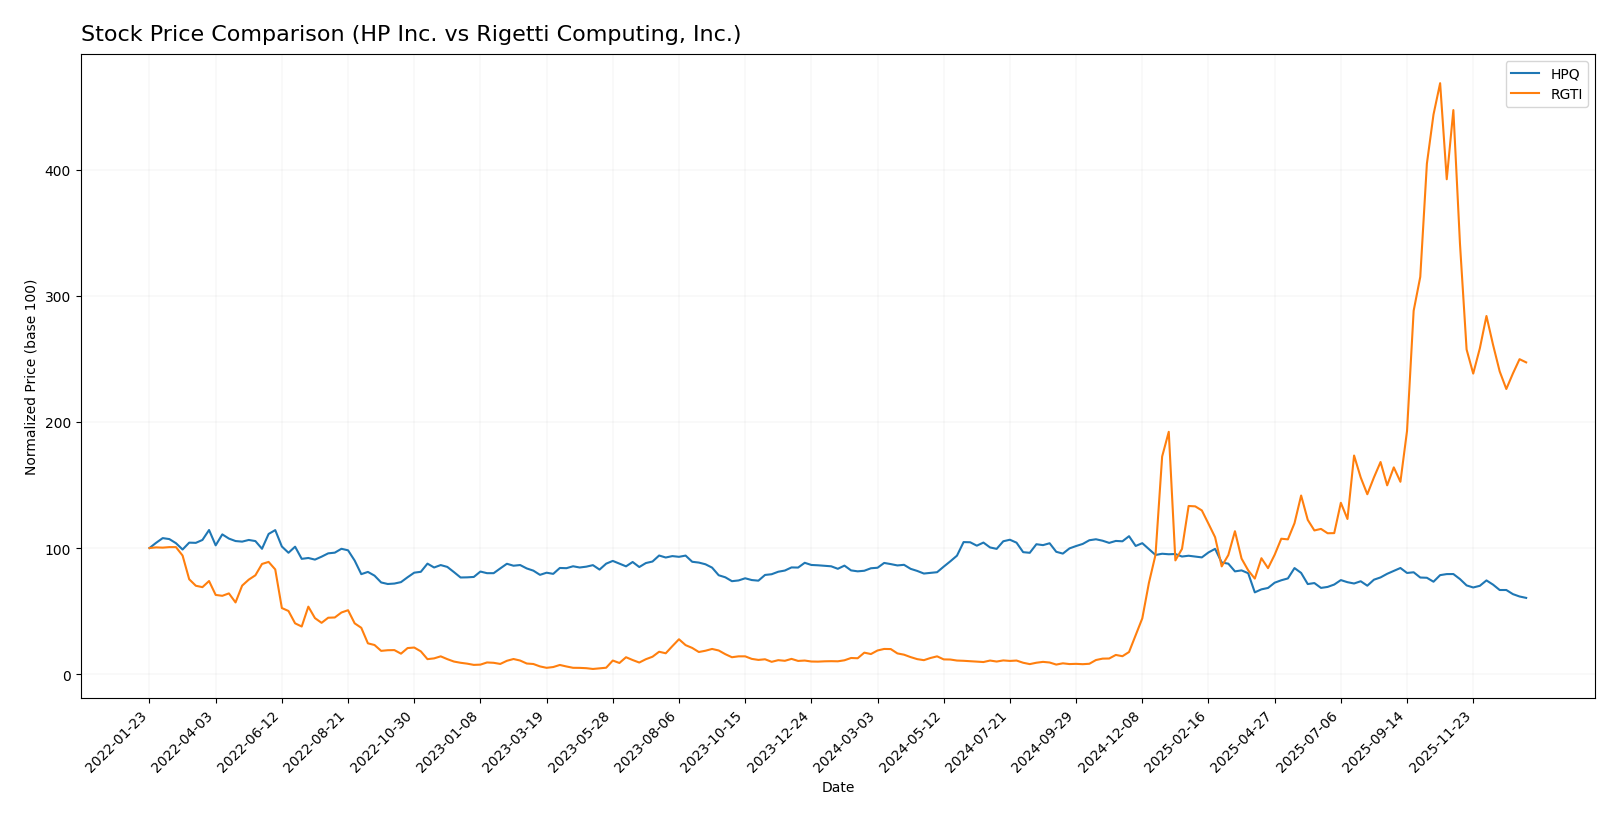
The stock price chart highlights contrasting movements over the past 12 months, with HP Inc. showing a sustained decline and Rigetti Computing, Inc. exhibiting remarkable growth followed by recent volatility.
Trend Analysis
HP Inc. experienced a bearish trend over the past year with a price decline of 27.98% and decelerating losses, ranging from a high of 38.13 to a low of 21.08. Recent months show continued weakness with a 23.82% drop.
Rigetti Computing, Inc. posted a strong bullish trend over 12 months, soaring 1448.73%, though with decelerating momentum and high volatility between 0.75 and 46.38. The recent period saw a sharp 44.73% decline.
Comparing the two, Rigetti Computing delivered the highest market performance with substantial growth despite recent setbacks, while HP Inc. showed consistent bearish performance throughout the year.
Target Prices
Analysts present a clear target price consensus for HP Inc. and Rigetti Computing, Inc.
| Company | Target High | Target Low | Consensus |
|---|---|---|---|
| HP Inc. | 30 | 20 | 24.8 |
| Rigetti Computing, Inc. | 50 | 18 | 35.83 |
The consensus target prices for HP Inc. and Rigetti Computing suggest potential upside from their current prices of $21.08 and $24.47, respectively, reflecting optimistic analyst expectations.
Analyst Opinions Comparison
This section compares analysts’ ratings and financial scores for HP Inc. and Rigetti Computing, Inc.:
Rating Comparison
HPQ Rating
- Rating: B-, evaluated as Very Favorable by analysts.
- Discounted Cash Flow Score: 4, indicating a favorable valuation.
- ROE Score: 1, considered very unfavorable for profitability.
- ROA Score: 4, favorable asset utilization.
- Debt To Equity Score: 1, indicating very unfavorable financial risk.
- Overall Score: 2, moderate overall financial standing.
RGTI Rating
- Rating: C, also assessed as Very Favorable by analysts.
- Discounted Cash Flow Score: 1, reflecting a very unfavorable valuation.
- ROE Score: 1, also very unfavorable for profitability.
- ROA Score: 1, very unfavorable in asset utilization.
- Debt To Equity Score: 4, favorable financial stability.
- Overall Score: 2, also moderate overall financial standing.
Which one is the best rated?
Based strictly on the data, HP Inc. holds a better rating (B-) compared to Rigetti’s (C). HPQ scores higher on discounted cash flow and asset usage, while Rigetti shows strength only in debt-to-equity ratio.
Scores Comparison
Here is a comparison of the Altman Z-Score and Piotroski Score for HP Inc. and Rigetti Computing, Inc.:
HPQ Scores
- Altman Z-Score: 1.6 indicates financial distress, high bankruptcy risk.
- Piotroski Score: 6 reflects average financial strength and investment quality.
RGTI Scores
- Altman Z-Score: 101.7 shows strong financial safety with minimal bankruptcy risk.
- Piotroski Score: 2 signals very weak financial health and poor investment quality.
Which company has the best scores?
Rigetti Computing, Inc. has a much higher Altman Z-Score placing it in the safe zone, but a very weak Piotroski Score. HP Inc. shows financial distress but holds an average Piotroski Score. The companies show mixed strengths based on these scores.
Grades Comparison
Here is the comparison of the latest grades and ratings for HP Inc. and Rigetti Computing, Inc.:
HP Inc. Grades
The following table shows recent grades assigned to HP Inc. by major financial institutions:
| Grading Company | Action | New Grade | Date |
|---|---|---|---|
| Goldman Sachs | Maintain | Neutral | 2025-11-26 |
| Evercore ISI Group | Maintain | In Line | 2025-11-26 |
| Citigroup | Maintain | Neutral | 2025-11-26 |
| Morgan Stanley | Maintain | Underweight | 2025-11-26 |
| JP Morgan | Maintain | Neutral | 2025-11-26 |
| Barclays | Maintain | Equal Weight | 2025-11-26 |
| TD Cowen | Maintain | Hold | 2025-11-26 |
| UBS | Maintain | Neutral | 2025-11-26 |
| Morgan Stanley | Maintain | Underweight | 2025-11-21 |
| B of A Securities | Maintain | Neutral | 2025-11-21 |
Overall, HP Inc.’s grades show a consistent neutral to hold stance with some underweight ratings, reflecting cautious sentiment.
Rigetti Computing, Inc. Grades
Below is a summary of Rigetti Computing’s recent grades from recognized grading firms:
| Grading Company | Action | New Grade | Date |
|---|---|---|---|
| B. Riley Securities | Maintain | Neutral | 2025-11-12 |
| Benchmark | Maintain | Buy | 2025-11-12 |
| B. Riley Securities | Downgrade | Neutral | 2025-11-03 |
| Benchmark | Maintain | Buy | 2025-10-07 |
| B. Riley Securities | Maintain | Buy | 2025-09-22 |
| Benchmark | Maintain | Buy | 2025-08-13 |
| Needham | Maintain | Buy | 2025-08-04 |
| B. Riley Securities | Maintain | Buy | 2025-07-23 |
| Benchmark | Maintain | Buy | 2025-05-15 |
| Needham | Maintain | Buy | 2025-05-14 |
Rigetti Computing’s grades predominantly indicate buy ratings, with only a recent neutral downgrade, suggesting more positive analyst sentiment.
Which company has the best grades?
Rigetti Computing, Inc. has received generally better grades, with most analysts recommending buy, while HP Inc. is rated mostly neutral or hold. This contrast may imply stronger growth expectations for Rigetti but also potentially higher risk.
Strengths and Weaknesses
Below is a comparison of key strengths and weaknesses of HP Inc. and Rigetti Computing, Inc. based on recent financial and operational data.
| Criterion | HP Inc. | Rigetti Computing, Inc. |
|---|---|---|
| Diversification | Strong diversification with revenues from Personal Systems (38.5B), Printing (16.7B), and Corporate Investments (62M) in 2025. | Limited diversification, mainly quantum computing access services with 356K revenue in 2024. |
| Profitability | Creating value with ROIC of 24.97% and favorable P/E of 10.35, though net margin (4.57%) and ROE (-731%) are unfavorable. | Negative profitability: ROIC -24.91%, net margin -1862.72%, and ROE -158.77%. |
| Innovation | Moderate innovation; corporate investments are low but steady; printing and systems segments mature. | High innovation potential with growing ROIC trend (67%), focused on quantum computing technology. |
| Global presence | Well-established global presence through diverse hardware and printing markets. | Nascent global presence, niche quantum computing market with limited scale. |
| Market Share | Large market share in personal computing and printing sectors. | Small market share, early-stage in quantum computing industry. |
HP Inc. shows solid diversification and market presence with favorable capital returns but faces margin pressure and declining ROIC trend. Rigetti Computing is still unprofitable but demonstrates promising innovation and improving profitability trends in a cutting-edge field. Investors should weigh HP’s stability against Rigetti’s growth potential and higher risk.
Risk Analysis
Below is a comparative table outlining key risks for HP Inc. and Rigetti Computing, Inc. based on the most recent data available for 2025 and 2024 respectively:
| Metric | HP Inc. (HPQ) | Rigetti Computing, Inc. (RGTI) |
|---|---|---|
| Market Risk | Moderate (Beta 1.22) | High (Beta 1.71) |
| Debt level | Moderate (Debt/Assets 26.05%) | Low (Debt/Assets 3.09%) |
| Regulatory Risk | Moderate (Tech sector exposure) | Moderate (Emerging quantum tech) |
| Operational Risk | Moderate (Legacy and innovation balance) | High (Early-stage quantum development) |
| Environmental Risk | Low to Moderate | Low |
| Geopolitical Risk | Moderate (Global supply chains) | Moderate (US-based, tech sensitive) |
The most likely and impactful risks are market volatility for Rigetti due to its high beta and operational risks given its early-stage quantum computing focus. HP faces moderate risks from legacy market pressures and supply chain dependencies but maintains a more stable debt profile. Investors should weigh Rigetti’s high growth potential against its financial and operational uncertainties.
Which Stock to Choose?
HP Inc. (HPQ) shows a mixed income evolution with mostly unfavorable net margin and EPS growth over 2021-2025, yet it maintains a slightly favorable moat by creating value despite declining profitability. Its financial ratios are largely favorable (71%), including a low debt ratio and decent returns on invested capital, supported by a very favorable B- rating.
Rigetti Computing, Inc. (RGTI) exhibits a challenging income profile, with severe net margin losses and negative profitability metrics over 2020-2024, alongside an unfavorable moat status reflecting value destruction despite improving ROIC. Its financial ratios are mostly unfavorable (71%), though it has a very favorable C rating driven by a strong balance sheet and low debt levels.
Investors with a risk-tolerant, growth-oriented profile might find RGTI’s bullish price trend and improving profitability intriguing despite ongoing losses. Conversely, those prioritizing established value creation and stronger financial metrics could perceive HPQ’s stable moat and favorable ratios as more aligned with quality investing.
Disclaimer: Investment carries a risk of loss of initial capital. The past performance is not a reliable indicator of future results. Be sure to understand risks before making an investment decision.
Go Further
I encourage you to read the complete analyses of HP Inc. and Rigetti Computing, Inc. to enhance your investment decisions: