In today’s fast-evolving tech landscape, HP Inc. and Quantum Computing, Inc. represent two compelling facets of the computer hardware industry. HP, a long-established leader, excels in personal computing and printing solutions, while Quantum Computing pioneers cutting-edge quantum software and applications. This comparison highlights their distinct innovation strategies and market positions. Join me as we explore which company holds the most promise for your investment portfolio.
Table of contents
Companies Overview
I will begin the comparison between HP Inc. and Quantum Computing, Inc. by providing an overview of these two companies and their main differences.
HP Inc. Overview
HP Inc. operates in the computer hardware industry, offering personal computing devices, printing products, and related technologies worldwide. It serves a broad customer base including individuals, businesses, and government sectors through its Personal Systems, Printing, and Corporate Investments segments. Founded in 1939 and headquartered in Palo Alto, California, HP Inc. holds a significant market position with a market cap of 19.7B USD.
Quantum Computing, Inc. Overview
Quantum Computing, Inc. focuses on quantum software tools and applications, enabling developers to build quantum-ready applications compatible with various quantum processors. It primarily serves commercial and government clients, operating out of Leesburg, Virginia. Founded in 2018, the company is much smaller, with 41 employees and a market capitalization of approximately 1.6B USD, reflecting its niche position in the emerging quantum computing sector.
Key similarities and differences
Both companies operate within the technology sector and computer hardware industry, yet their business models differ substantially. HP Inc. offers a diverse range of traditional computing and printing hardware with established global reach. Conversely, Quantum Computing, Inc. specializes in software enabling quantum computing applications, targeting a more specific and innovative market segment. The scale and maturity of HP Inc. contrast with the startup nature of Quantum Computing, reflected in their employee numbers and market caps.
Income Statement Comparison
Below is a comparison of key income statement metrics for HP Inc. and Quantum Computing, Inc. based on their most recent fiscal year data.

| Metric | HP Inc. (HPQ) | Quantum Computing, Inc. (QUBT) |
|---|---|---|
| Market Cap | 19.7B | 1.6B |
| Revenue | 55.3B | 373K |
| EBITDA | 4.1B | -62.2M |
| EBIT | 3.2B | -66.0M |
| Net Income | 2.5B | -68.5M |
| EPS | 2.67 | -0.73 |
| Fiscal Year | 2025 | 2024 |
Income Statement Interpretations
HP Inc.
HP Inc. showed a declining trend in revenue and net income from 2021 to 2025, with revenues falling from 63.46B to 55.30B and net income dropping from 6.54B to 2.53B. Margins remained mostly neutral but exhibited deterioration in gross profit and EBIT margins in the most recent year. The 2025 performance reflected slower growth and weaker profitability compared to prior years.
Quantum Computing, Inc.
Quantum Computing, Inc. posted minimal revenue growth, with sales rising slightly from nearly zero in 2020 to 373K in 2024, yet net losses widened significantly from -24.7M to -68.5M. Margins stayed deeply negative throughout the period, with severe deterioration in EBIT and net margin. The 2024 results showed further margin contraction and increased net losses despite modest revenue gains.
Which one has the stronger fundamentals?
Both companies face unfavorable income statement trends, but HP Inc. still generates positive earnings and maintains neutral margins, while Quantum Computing, Inc. endures consistent heavy losses and steeply negative margins. HP’s larger scale and positive net income contrast with Quantum’s ongoing losses, indicating stronger fundamentals for HP based on income statement performance alone.
Financial Ratios Comparison
Below is a comparison of key financial ratios for HP Inc. and Quantum Computing, Inc. based on their most recent fiscal year data.
| Ratios | HP Inc. (2025) | Quantum Computing, Inc. (2024) |
|---|---|---|
| ROE | -7.31% | -63.89% |
| ROIC | 24.97% | -17.41% |
| P/E | 10.35 | -22.67 |
| P/B | -75.65 | 14.48 |
| Current Ratio | 0.77 | 17.36 |
| Quick Ratio | 0.48 | 17.36 |
| D/E (Debt to Equity) | -31.45 | 0.01 |
| Debt-to-Assets | 26.05% | 0.77% |
| Interest Coverage | 7.16 | -10.39 |
| Asset Turnover | 1.32 | 0.0024 |
| Fixed Asset Turnover | 13.23 | 0.038 |
| Payout Ratio | 43.02% | -0.31% |
| Dividend Yield | 4.16% | 0.01% |
Interpretation of the Ratios
HP Inc.
HP Inc. exhibits mostly favorable ratios, with strong returns on invested capital (24.97%) and a WACC of 7.6%, indicating efficient capital use. However, concerns arise from a negative return on equity (-730.92%) and weak liquidity ratios, including a current ratio of 0.77. The company pays dividends, offering a 4.16% yield with a consistent payout, supported by solid free cash flow coverage, though negative equity returns warrant caution.
Quantum Computing, Inc.
Quantum Computing, Inc. shows predominantly unfavorable ratios, suffering from a steep negative net margin (-18,375.87%) and negative returns on equity (-63.89%) and invested capital (-17.41%). Its liquidity ratio is very high but flagged as unfavorable due to unusual balance sheet structure. The firm does not pay dividends, reflecting its high growth phase and reinvestment strategy, prioritizing R&D over shareholder returns.
Which one has the best ratios?
HP Inc. holds the advantage with a majority of favorable financial ratios, demonstrating stronger profitability and capital efficiency despite some liquidity weaknesses. In contrast, Quantum Computing, Inc. faces significant challenges with mostly unfavorable ratios and negative profitability metrics, characteristic of an early-stage growth company with no dividend payouts.
Strategic Positioning
This section compares the strategic positioning of HP Inc. and Quantum Computing, Inc. including market position, key segments, and exposure to technological disruption:
HP Inc.
- Large market cap of 19.7B with mature competitive pressure in computer hardware industry
- Key segments: Personal Systems (38.5B), Printing (16.7B), and Corporate Investments (62M)
- Exposure to disruption moderate; traditional hardware with some investment in emerging tech
Quantum Computing, Inc.
- Smaller market cap of 1.6B, higher beta indicating more volatility and risk
- Focused on quantum software tools and applications, serving commercial and government sectors
- High exposure to technological disruption as a pioneer in quantum computing software
HP Inc. vs Quantum Computing, Inc. Positioning
HP Inc. operates a diversified business with substantial revenues from mature hardware segments, balancing steady income and innovation investments. Quantum Computing, Inc. focuses narrowly on quantum software, positioning itself in a nascent but highly disruptive technology space with limited revenue scale.
Which has the best competitive advantage?
HP Inc. shows a slightly favorable moat by creating value despite declining profitability, reflecting stable competitive advantage. Quantum Computing, Inc. has a slightly unfavorable moat, indicating value destruction but improving profitability, signaling emerging potential yet higher risk.
Stock Comparison
The past year revealed contrasting stock price movements: HP Inc. experienced a notable bearish trend with a price decline nearing 28%, while Quantum Computing, Inc. exhibited a strong bullish surge exceeding 1300%, both showing deceleration in momentum.
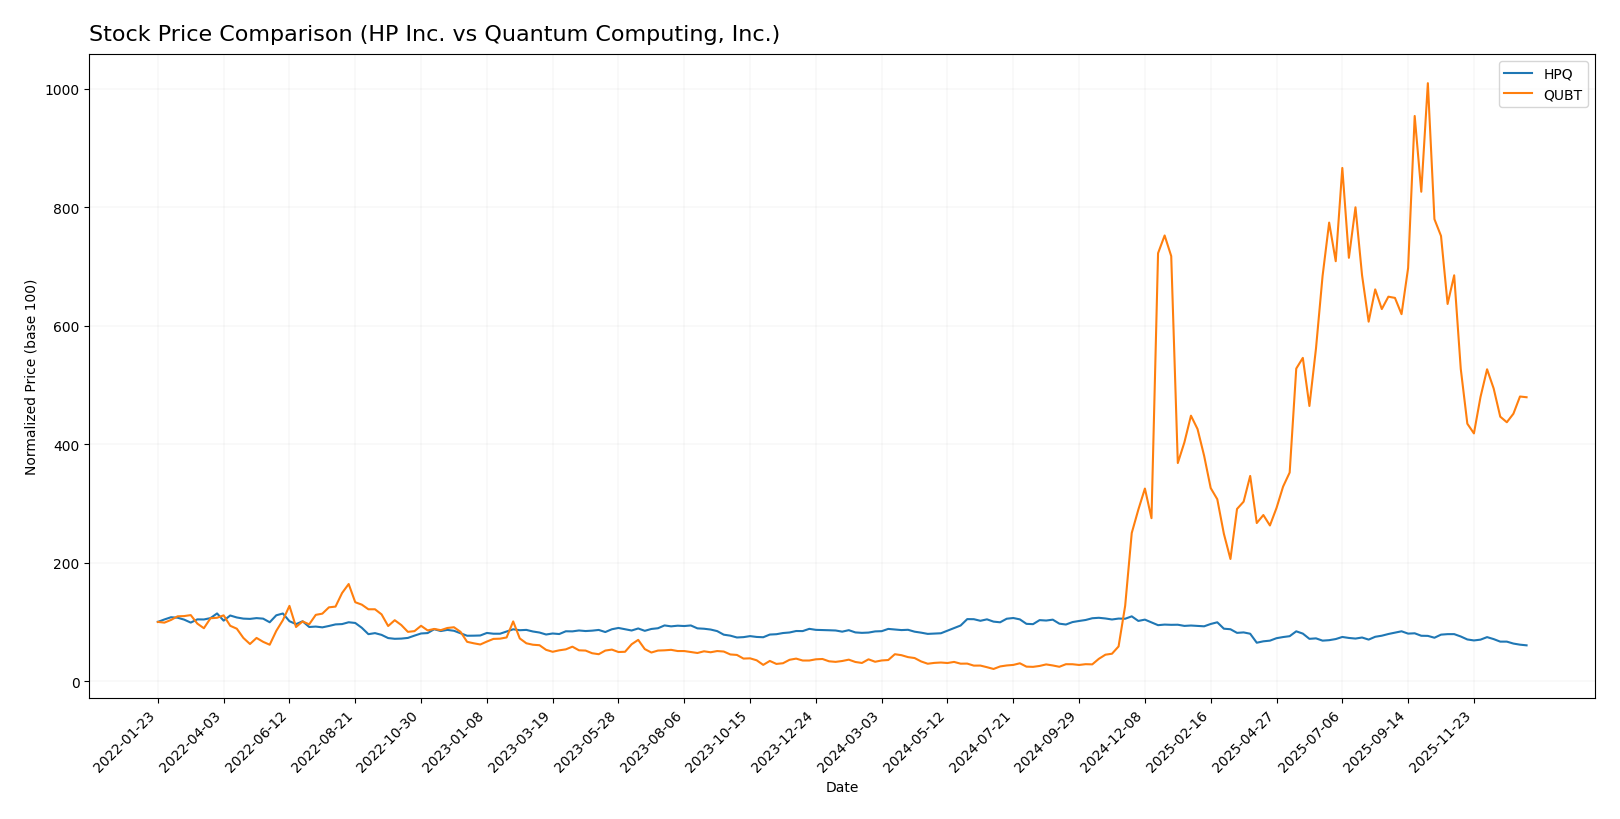
Trend Analysis
HP Inc. (HPQ) showed a bearish trend over the past 12 months with a -27.98% price change and decelerating downward momentum, reaching a high of 38.13 and a low of 21.08. Volatility was moderate with a standard deviation of 4.65.
Quantum Computing, Inc. (QUBT) posted a bullish trend with a 1362.9% price increase despite recent deceleration. The stock’s volatility was higher, with a standard deviation of 6.91, hitting a low of 0.5 and a high of 24.62.
Comparing both, QUBT delivered the highest market performance with a substantial positive gain, while HPQ faced a significant negative correction over the same period.
Target Prices
The consensus target prices reflect moderate upside potential for both HP Inc. and Quantum Computing, Inc.
| Company | Target High | Target Low | Consensus |
|---|---|---|---|
| HP Inc. | 30 | 20 | 24.8 |
| Quantum Computing, Inc. | 40 | 10 | 19.5 |
Analysts expect HP Inc.’s stock to rise modestly above its current price of 21.08 USD, while Quantum Computing, Inc. shows a wider target range, indicating higher volatility but potential gains from its 11.69 USD trading level.
Analyst Opinions Comparison
This section compares analysts’ ratings and grades for HP Inc. and Quantum Computing, Inc.:
Rating Comparison
HPQ Rating
- Rating: B-, considered very favorable overall.
- Discounted Cash Flow Score: 4, indicating a favorable valuation based on future cash flows.
- ROE Score: 1, very unfavorable, indicating low efficiency in generating profit from equity.
- ROA Score: 4, favorable, showing effective asset utilization for earnings.
- Debt To Equity Score: 1, very unfavorable, suggesting higher financial risk.
- Overall Score: 2, moderate overall financial standing.
QUBT Rating
- Rating: C+, considered very favorable overall.
- Discounted Cash Flow Score: 2, moderate valuation based on future cash flows.
- ROE Score: 1, very unfavorable, indicating low efficiency in generating profit from equity.
- ROA Score: 1, very unfavorable, showing poor asset utilization for earnings.
- Debt To Equity Score: 5, very favorable, indicating low financial risk.
- Overall Score: 2, moderate overall financial standing.
Which one is the best rated?
Based strictly on the provided data, HP Inc. has a higher rating (B-) and stronger scores in discounted cash flow and return on assets, while Quantum Computing, Inc. scores better on debt to equity but has lower performance in other key metrics.
Scores Comparison
The comparison of scores for HPQ and QUBT highlights their financial health and stability:
HPQ Scores
- Altman Z-Score: 1.60, indicating financial distress and high bankruptcy risk.
- Piotroski Score: 6, representing average financial strength.
QUBT Scores
- Altman Z-Score: 50.17, indicating a safe zone and low bankruptcy risk.
- Piotroski Score: 4, also representing average financial strength.
Which company has the best scores?
Based on the Altman Z-Score, QUBT shows significantly stronger financial stability than HPQ, which is in distress. Both companies have average Piotroski Scores, but QUBT’s Z-Score places it clearly ahead in terms of financial health.
Grades Comparison
Here is a comparison of the recent grades assigned to HP Inc. and Quantum Computing, Inc.:
HP Inc. Grades
The following table presents recent grades from notable financial institutions for HP Inc.:
| Grading Company | Action | New Grade | Date |
|---|---|---|---|
| Goldman Sachs | Maintain | Neutral | 2025-11-26 |
| Evercore ISI Group | Maintain | In Line | 2025-11-26 |
| Citigroup | Maintain | Neutral | 2025-11-26 |
| Morgan Stanley | Maintain | Underweight | 2025-11-26 |
| JP Morgan | Maintain | Neutral | 2025-11-26 |
| Barclays | Maintain | Equal Weight | 2025-11-26 |
| TD Cowen | Maintain | Hold | 2025-11-26 |
| UBS | Maintain | Neutral | 2025-11-26 |
| Morgan Stanley | Maintain | Underweight | 2025-11-21 |
| B of A Securities | Maintain | Neutral | 2025-11-21 |
Overall, HP Inc.’s grades mostly indicate a neutral to cautious stance, with multiple “Neutral” and “Underweight” ratings maintained.
Quantum Computing, Inc. Grades
The following table summarizes recent grades from verified grading companies for Quantum Computing, Inc.:
| Grading Company | Action | New Grade | Date |
|---|---|---|---|
| Ascendiant Capital | Maintain | Buy | 2025-12-22 |
| Cantor Fitzgerald | Maintain | Neutral | 2025-12-18 |
| Lake Street | Maintain | Buy | 2025-11-17 |
| Ascendiant Capital | Maintain | Buy | 2025-10-03 |
| Ascendiant Capital | Maintain | Buy | 2025-06-06 |
| Ascendiant Capital | Maintain | Buy | 2025-04-28 |
| Ascendiant Capital | Maintain | Buy | 2024-11-13 |
| Ascendiant Capital | Maintain | Buy | 2023-11-24 |
Quantum Computing, Inc. shows a consistent buy rating trend, primarily supported by repeated “Buy” grades from Ascendiant Capital.
Which company has the best grades?
Quantum Computing, Inc. has received consistently stronger buy ratings compared to HP Inc.’s mainly neutral and underweight grades. This suggests a more optimistic outlook from analysts on Quantum Computing, which could imply higher expected growth potential for investors relative to HP Inc.’s more cautious positioning.
Strengths and Weaknesses
Below is a comparison of key strengths and weaknesses for HP Inc. and Quantum Computing, Inc. based on the most recent financial and strategic data.
| Criterion | HP Inc. (HPQ) | Quantum Computing, Inc. (QUBT) |
|---|---|---|
| Diversification | High: Multiple segments including Personal Systems (38.5B), Printing (16.7B), and Corporate Investments (62M) in 2025 | Very Low: Single revenue source from Services Member (346K in 2024) |
| Profitability | Moderate: ROIC 24.97% favorable but declining trend; net margin low at 4.57% | Negative: ROIC -17.41%, net margin deeply negative (-18375.87%) |
| Innovation | Moderate: Steady investment in corporate initiatives but no rapid ROIC growth | Emerging: Strong ROIC growth trend but still value destroying |
| Global presence | Strong: Leading global player in PCs and printing markets | Limited: Early-stage company with minimal revenue and market footprint |
| Market Share | Significant in Personal Systems and Printing segments | Negligible, niche quantum computing sector |
Key takeaways: HP Inc. demonstrates a diversified business model with stable profitability despite a declining ROIC trend. Quantum Computing, Inc. shows promising growth potential with improving profitability metrics but remains unprofitable and highly risky. Investors seeking stability may favor HP, while those with higher risk appetite might consider QUBT for speculative growth.
Risk Analysis
Below is a comparative table outlining key risks for HP Inc. and Quantum Computing, Inc. based on the most recent financial and market data:
| Metric | HP Inc. | Quantum Computing, Inc. |
|---|---|---|
| Market Risk | Beta 1.22; moderate volatility | Beta 3.49; high volatility |
| Debt level | Debt-to-assets 26.05%, manageable | Debt-to-assets 0.77%, very low |
| Regulatory Risk | Moderate, tech sector compliance | Moderate, emerging tech regulation |
| Operational Risk | Large workforce, complex supply chain | Small team, scalability risks |
| Environmental Risk | Standard for tech hardware | Limited footprint, low risk |
| Geopolitical Risk | US-based, exposure to trade policies | US-based, limited global exposure |
HP Inc. faces moderate market risk with stable debt levels but operational complexity due to its size. Quantum Computing, Inc. has greater market volatility and operational risks from its small scale, although it benefits from low debt. Market volatility and operational scalability are the most likely and impactful risks for investors to consider.
Which Stock to Choose?
HP Inc. (HPQ) shows a mixed income evolution with a slight revenue growth of 3.24% last year but an overall decline of -12.87% since 2021. Its profitability is moderate, with a 4.57% net margin and a favorable ROIC of 24.97%. The company maintains manageable debt ratios and a solid interest coverage, earning a very favorable B- rating.
Quantum Computing, Inc. (QUBT) presents an unfavorable income trajectory with negative margins and large net losses despite a 4.19% revenue increase last year. Financial ratios highlight weakness with a negative ROIC and high WACC, although it has very low debt levels and a high current ratio. It holds a very favorable C+ rating, reflecting a challenging but improving profile.
Investors focused on value and financial stability might find HPQ’s favorable financial ratios and moderate profitability more aligned with their goals, while those with a risk-tolerant or growth-oriented profile could view QUBT’s improving profitability and bullish long-term price trend as potential, albeit speculative, opportunities.
Disclaimer: Investment carries a risk of loss of initial capital. The past performance is not a reliable indicator of future results. Be sure to understand risks before making an investment decision.
Go Further
I encourage you to read the complete analyses of HP Inc. and Quantum Computing, Inc. to enhance your investment decisions: