NetApp, Inc. and HP Inc. are two prominent players in the computer hardware industry, each with distinct yet overlapping market focuses. NetApp excels in cloud-led data management and storage solutions, while HP specializes in personal computing and printing technologies. Both companies emphasize innovation to maintain competitive edges in evolving tech landscapes. In this article, I will analyze their strengths and risks to help you identify which stock might be the smarter investment choice in 2026.
Table of contents
Companies Overview
I will begin the comparison between NetApp and HP Inc. by providing an overview of these two companies and their main differences.
NetApp Overview
NetApp, Inc. specializes in cloud-led and data-centric services aimed at managing and sharing data across on-premises, private, and public clouds globally. It operates mainly in Hybrid Cloud and Public Cloud segments, offering intelligent data management software and storage infrastructure solutions. Founded in 1992 and headquartered in San Jose, California, NetApp serves diverse industries via direct sales and partner ecosystems.
HP Inc. Overview
HP Inc. focuses on personal computing devices, imaging, printing products, and related technologies, operating in three segments: Personal Systems, Printing, and Corporate Investments. The company provides hardware, software, and services to individual consumers, SMBs, and large enterprises, including government and education sectors. Established in 1939 and based in Palo Alto, California, HP Inc. is a long-standing player in the computer hardware industry.
Key similarities and differences
Both companies operate within the computer hardware industry and serve broad markets including enterprise and government. However, NetApp’s business centers on cloud data management and storage solutions, while HP emphasizes personal computing and printing hardware. NetApp’s offerings focus on cloud infrastructure and software, contrasting with HP’s diversified portfolio spanning devices, printing, and corporate investments.
Income Statement Comparison
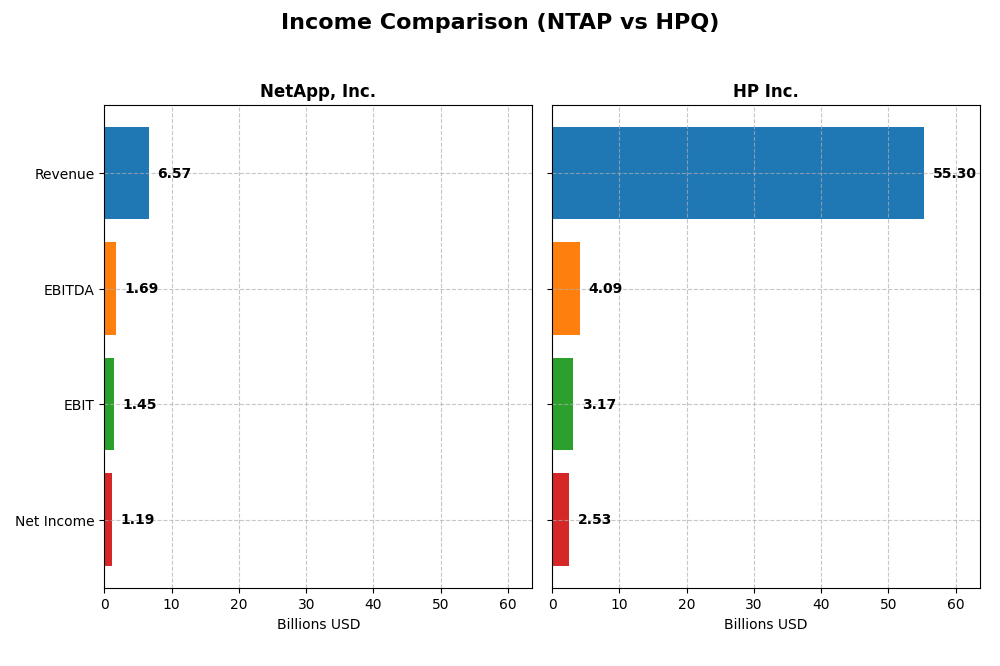
The following table compares key income statement metrics for NetApp, Inc. and HP Inc. based on their most recent fiscal year data.
| Metric | NetApp, Inc. (NTAP) | HP Inc. (HPQ) |
|---|---|---|
| Market Cap | 21.4B | 19.7B |
| Revenue | 6.57B | 55.3B |
| EBITDA | 1.69B | 4.09B |
| EBIT | 1.45B | 3.17B |
| Net Income | 1.19B | 2.53B |
| EPS | 5.81 | 2.67 |
| Fiscal Year | 2025 | 2025 |
Income Statement Interpretations
NetApp, Inc.
NetApp’s revenue showed a steady growth of 14.42% over 2021-2025, with net income rising 62.47%, reflecting solid profitability improvements. Margins have been favorable, notably a gross margin of 70.19% and net margin of 18.05%. In 2025, revenue growth slowed to 4.85%, but net margin expanded by 14.72%, indicating healthier bottom-line efficiency.
HP Inc.
HP’s revenue declined by 12.87% from 2021 to 2025, with net income falling 61.34%, showing weakening earnings performance. Margins remained neutral to unfavorable, with a gross margin near 20% and net margin at 4.57%. The latest year saw a modest 3.24% revenue increase but deteriorating net margin by 11.73%, signaling ongoing margin pressure.
Which one has the stronger fundamentals?
NetApp demonstrates stronger fundamentals, supported by consistent revenue and net income growth, robust margins, and positive margin expansions. Conversely, HP faces declining revenues, significant net income contraction, and deteriorating margins. The favorable income statement trends and margin stability favor NetApp over HP in terms of fundamental financial health.
Financial Ratios Comparison
Below is a comparison of key financial ratios for NetApp, Inc. and HP Inc. based on their most recent fiscal year data available.
| Ratios | NetApp, Inc. (NTAP) FY2025 | HP Inc. (HPQ) FY2025 |
|---|---|---|
| ROE | 114.0% | -730.9% |
| ROIC | 16.5% | 24.97% (approx.)¹ |
| P/E | 15.4 | 10.4 |
| P/B | 17.6 | -75.7 |
| Current Ratio | 1.26 | 0.77 |
| Quick Ratio | 1.22 | 0.48 |
| D/E (Debt to Equity) | 3.36 | -31.45 |
| Debt-to-Assets | 32.3% | 26.1% |
| Interest Coverage | 20.9 | 7.16 |
| Asset Turnover | 0.61 | 1.32 |
| Fixed Asset Turnover | 8.17 | 13.23 |
| Payout ratio | 35.8% | 43.0% |
| Dividend yield | 2.32% | 4.16% |
¹HP Inc.’s Return on Invested Capital (ROIC) is approximated by its reported Return on Capital Employed of 28.97% adjusted for leverage, as explicit ROIC was not provided. Negative P/B and D/E ratios for HP reflect negative equity values.
Interpretation of the Ratios
NetApp, Inc.
NetApp shows a slightly favorable overall ratio profile with 50% favorable and 14.29% unfavorable metrics. Strengths include a high return on equity (114.04%) and solid interest coverage (22.61), though a high price-to-book ratio (17.6) raises valuation concerns. The company pays a dividend with a 2.32% yield, supported by stable free cash flow, indicating manageable payout risks.
HP Inc.
HP presents a favorable ratio profile, with 71.43% favorable and 28.57% unfavorable ratios. The company benefits from strong returns on invested capital (24.97%) and capital employed (28.97%), alongside a healthy dividend yield of 4.16%. However, weak profitability metrics like negative return on equity (-730.92%) and low liquidity ratios (current ratio 0.77) suggest financial stress despite dividend payments.
Which one has the best ratios?
HP exhibits a more favorable overall ratio mix (71.43% favorable) compared to NetApp’s slight favorability (50%), driven by stronger returns on invested capital and asset turnover. However, HP’s weaker liquidity and profitability ratios contrast with NetApp’s solid earnings and cash flow coverage, making the comparison nuanced depending on financial priorities.
Strategic Positioning
This section compares the strategic positioning of NetApp, Inc. and HP Inc. in terms of market position, key segments, and exposure to technological disruption:
NetApp, Inc.
- Positioned in cloud-led data management with moderate market cap and competitive NASDAQ presence.
- Focuses on Hybrid Cloud and Public Cloud segments, driven by intelligent data management software and storage solutions.
- Exposure centered on cloud and data-centric innovations, including cloud storage and operations services.
HP Inc.
- Larger market cap with broad presence in personal computing and printing on NYSE.
- Operates through Personal Systems, Printing, and Corporate Investments segments, driven by computing devices and printing products.
- Faces technological disruption through evolving computing devices and printing technologies, with corporate investments in incubation projects.
NetApp, Inc. vs HP Inc. Positioning
NetApp concentrates on cloud and data management services, leveraging focused segments in Hybrid and Public Cloud, while HP operates a more diversified business across personal systems, printing, and investments. NetApp’s approach targets specialized cloud innovations; HP’s breadth spans hardware and services with broader customer bases.
Which has the best competitive advantage?
NetApp demonstrates a very favorable moat with growing ROIC exceeding WACC, indicating durable competitive advantage and increasing profitability. HP creates value but shows a slightly favorable moat with declining ROIC, suggesting weakening profitability despite value creation.
Stock Comparison
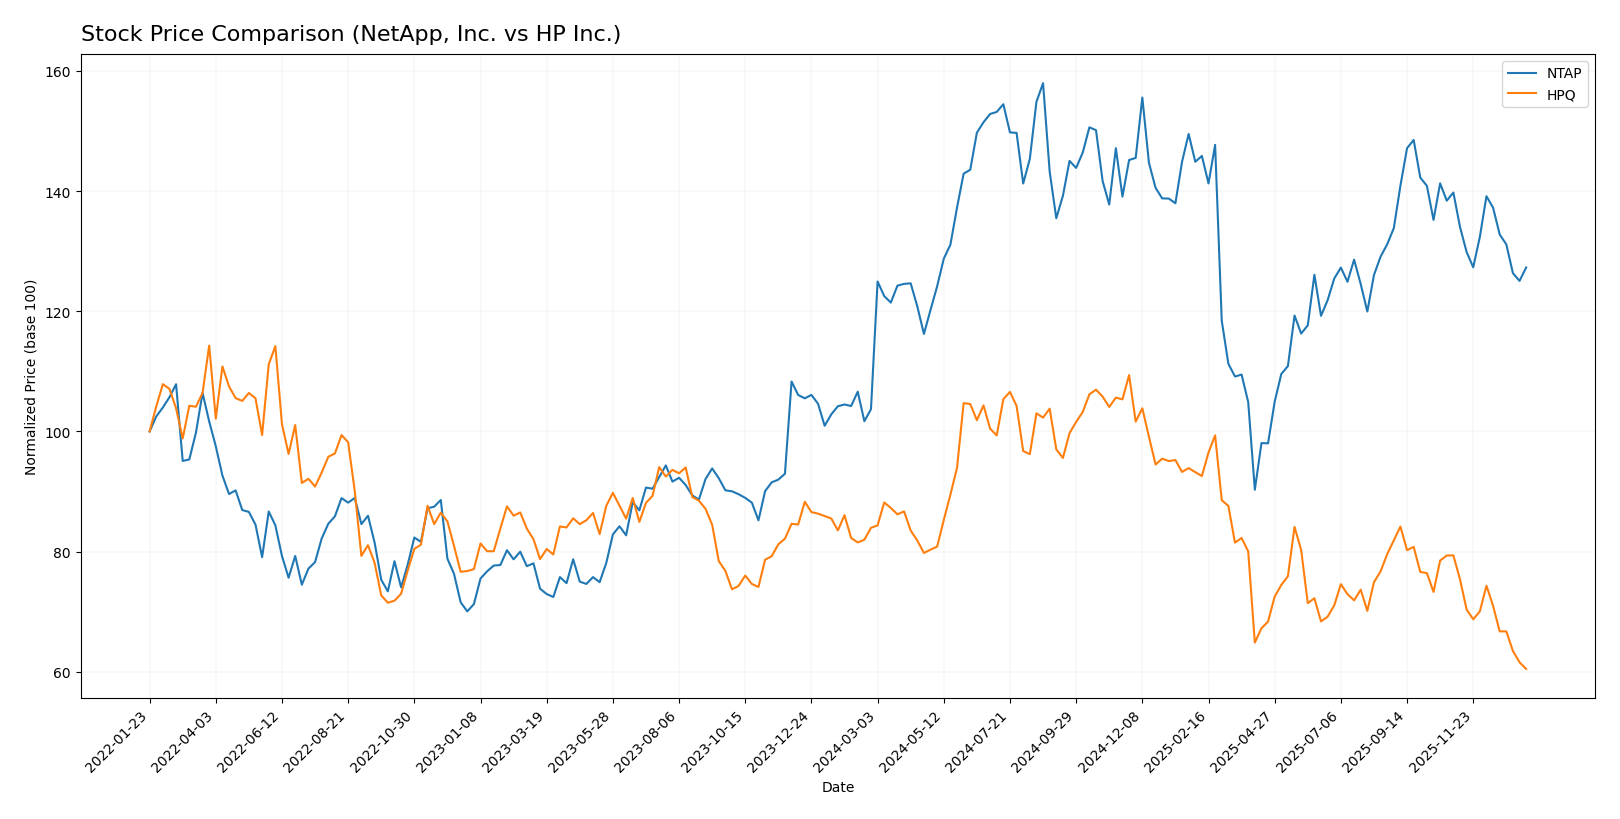
The stock price movements over the past 12 months illustrate contrasting trajectories, with NetApp, Inc. showing a significant bullish trend and HP Inc. experiencing a marked bearish trend, both exhibiting deceleration in their momentum.
Trend Analysis
NetApp, Inc. (NTAP) recorded a 22.75% price increase over the past year, indicating a bullish trend despite deceleration in momentum; the stock traded between 76.1 and 133.12, with a high volatility reflected by a 12.21 standard deviation.
HP Inc. (HPQ) posted a 27.98% price decline over the last 12 months, confirming a bearish trend with deceleration; the stock fluctuated between 21.08 and 38.13, showing lower volatility at a 4.65 standard deviation.
Comparatively, NetApp, Inc.’s stock delivered the highest market performance with a positive price change, contrasting with HP Inc.’s significant negative return over the same period.
Target Prices
The analyst consensus presents clear target price ranges for NetApp, Inc. and HP Inc., indicating moderate upside potential.
| Company | Target High | Target Low | Consensus |
|---|---|---|---|
| NetApp, Inc. | 137 | 115 | 125.17 |
| HP Inc. | 30 | 20 | 24.8 |
Analysts expect NetApp’s price to rise above its current 107.28 USD, with a consensus near 125 USD. HP’s consensus target of 24.8 USD also suggests modest upside from its current 21.08 USD.
Analyst Opinions Comparison
This section compares analysts’ ratings and grades for NetApp, Inc. (NTAP) and HP Inc. (HPQ):
Rating Comparison
NTAP Rating
- Rating: B+, considered Very Favorable by analysts.
- Discounted Cash Flow Score: 4, indicating a Favorable valuation based on future cash flows.
- ROE Score: 5, Very Favorable, showing high efficiency in generating profit from equity.
- ROA Score: 5, Very Favorable, demonstrating strong asset utilization to generate earnings.
- Debt To Equity Score: 1, Very Unfavorable, indicating higher financial risk due to debt levels.
- Overall Score: 3, Moderate, reflecting a balanced but not outstanding overall financial standing.
HPQ Rating
- Rating: B-, considered Very Favorable by analysts.
- Discounted Cash Flow Score: 4, indicating a Favorable valuation based on future cash flows.
- ROE Score: 1, Very Unfavorable, reflecting low efficiency in generating profit from equity.
- ROA Score: 4, Favorable, showing good effectiveness in using assets to generate earnings.
- Debt To Equity Score: 1, Very Unfavorable, indicating higher financial risk due to debt levels.
- Overall Score: 2, Moderate, reflecting a balanced but lower overall financial standing than NTAP.
Which one is the best rated?
Based strictly on the provided data, NTAP has a higher overall score and better returns on equity and assets, while both have similar unfavorable debt-to-equity scores. NTAP is therefore better rated overall.
Scores Comparison
Here is a comparison of the financial health scores for NetApp, Inc. and HP Inc.:
NetApp, Inc. Scores
- Altman Z-Score: 2.86, positioned in the grey zone, indicating moderate bankruptcy risk.
- Piotroski Score: 7, categorized as strong financial health.
HP Inc. Scores
- Altman Z-Score: 1.60, in the distress zone, indicating high bankruptcy risk.
- Piotroski Score: 6, classified as average financial health.
Which company has the best scores?
NetApp, Inc. shows better scores overall with a higher Altman Z-Score in the grey zone and a strong Piotroski Score of 7. HP Inc. has a lower Altman Z-Score in the distress zone and a more moderate Piotroski Score of 6.
Grades Comparison
Here is a comparison of the recent grades assigned to NetApp, Inc. and HP Inc. by reputable grading companies:
NetApp, Inc. Grades
The following table lists recent grades from recognized financial institutions for NetApp, Inc.:
| Grading Company | Action | New Grade | Date |
|---|---|---|---|
| Barclays | Maintain | Overweight | 2025-11-26 |
| Wells Fargo | Maintain | Equal Weight | 2025-11-26 |
| Northland Capital Markets | Upgrade | Outperform | 2025-11-26 |
| B of A Securities | Maintain | Neutral | 2025-11-26 |
| UBS | Maintain | Neutral | 2025-11-26 |
| Citigroup | Maintain | Neutral | 2025-11-12 |
| Citigroup | Maintain | Neutral | 2025-10-16 |
| Argus Research | Maintain | Buy | 2025-08-29 |
| UBS | Maintain | Neutral | 2025-08-28 |
| Barclays | Maintain | Overweight | 2025-08-28 |
Overall, NetApp has a mixed but generally positive grade trend with multiple “Neutral” and “Overweight” ratings, and an upgrade to “Outperform” noted recently.
HP Inc. Grades
The following table summarizes recent grades for HP Inc. from established grading companies:
| Grading Company | Action | New Grade | Date |
|---|---|---|---|
| Goldman Sachs | Maintain | Neutral | 2025-11-26 |
| Evercore ISI Group | Maintain | In Line | 2025-11-26 |
| Citigroup | Maintain | Neutral | 2025-11-26 |
| Morgan Stanley | Maintain | Underweight | 2025-11-26 |
| JP Morgan | Maintain | Neutral | 2025-11-26 |
| Barclays | Maintain | Equal Weight | 2025-11-26 |
| TD Cowen | Maintain | Hold | 2025-11-26 |
| UBS | Maintain | Neutral | 2025-11-26 |
| Morgan Stanley | Maintain | Underweight | 2025-11-21 |
| B of A Securities | Maintain | Neutral | 2025-11-21 |
HP Inc.’s grades indicate a more cautious outlook with a prevalence of “Neutral,” “Hold,” and “Underweight” ratings.
Which company has the best grades?
NetApp, Inc. generally holds stronger grades with several “Overweight,” “Buy,” and an “Outperform” upgrade, whereas HP Inc. mostly receives “Neutral” and “Underweight” ratings. For investors, NetApp’s more positive grades may suggest relatively higher confidence from analysts.
Strengths and Weaknesses
The table below summarizes key strengths and weaknesses of NetApp, Inc. (NTAP) and HP Inc. (HPQ) based on their recent financial performance, market positioning, and strategic focus.
| Criterion | NetApp, Inc. (NTAP) | HP Inc. (HPQ) |
|---|---|---|
| Diversification | Moderate: Focused on hybrid and public cloud segments | High: Broad segments including Personal Systems and Printing |
| Profitability | Strong: ROIC 16.5%, net margin 18.05%, growing ROIC | Moderate: ROIC 25%, but net margin 4.57%, declining ROIC |
| Innovation | Robust: Very favorable economic moat with rising ROIC | Mixed: Slightly favorable moat, profitability declining |
| Global presence | Established global reach through cloud services | Extensive global footprint in hardware and printing |
| Market Share | Niche leader in data management and cloud storage | Large share in personal systems and printing markets |
Key takeaways: NetApp shows a strong and growing profitability driven by cloud-focused innovation but with moderate diversification. HP offers broader market exposure and solid market share, though its profitability is under pressure, signaling caution for investors prioritizing stable returns.
Risk Analysis
Below is a comparison of key risks for NetApp, Inc. (NTAP) and HP Inc. (HPQ) based on their most recent financial and operational data from 2025.
| Metric | NetApp, Inc. (NTAP) | HP Inc. (HPQ) |
|---|---|---|
| Market Risk | Beta 1.37, moderately volatile | Beta 1.22, slightly less volatile |
| Debt level | Debt/Equity 3.36, unfavorable (high leverage) | Debt/Equity -31.45, favorable (low or negative leverage) |
| Regulatory Risk | Moderate, tech industry compliance | Moderate, printer & PC manufacturing regulations |
| Operational Risk | Moderate, reliance on cloud & hybrid infrastructure | Moderate, diversified in PCs & printing |
| Environmental Risk | Moderate, data center energy use & e-waste | Moderate to high, printing consumables impact |
| Geopolitical Risk | Moderate, global supply chain exposure | Moderate, global market & supply chain exposure |
NetApp faces its most impactful risks from high leverage and market volatility, with a solid operational base but cautious debt management needed. HP, while showing better debt metrics, struggles with profitability and liquidity, and must manage environmental impact risks in printing. Both companies operate in competitive, regulated tech sectors with moderate geopolitical exposure.
Which Stock to Choose?
NetApp, Inc. (NTAP) exhibits a favorable income evolution with strong profitability, including an 18.05% net margin and a 114.04% ROE. Despite a moderate debt level and high P/B ratio, its overall rating is very favorable with a durable competitive advantage indicated by a very favorable moat.
HP Inc. (HPQ) shows a less favorable income trend marked by a 4.57% net margin and negative ROE, despite a high ROIC and favorable valuation ratios. The company carries high debt with weaker liquidity ratios and a slightly favorable moat, reflecting declining profitability and financial stability concerns.
Investors prioritizing value creation and durable profitability might find NTAP’s strong income and financial ratios more appealing, while those focused on favorable valuation metrics and potentially higher risk tolerance could interpret HPQ’s profile differently given its declining profitability but attractive price metrics.
Disclaimer: Investment carries a risk of loss of initial capital. The past performance is not a reliable indicator of future results. Be sure to understand risks before making an investment decision.
Go Further
I encourage you to read the complete analyses of NetApp, Inc. and HP Inc. to enhance your investment decisions: