In the fast-evolving technology sector, HP Inc. and IonQ, Inc. represent two distinct yet overlapping frontiers in computer hardware. HP, a long-established leader in personal computing and printing solutions, contrasts sharply with IonQ’s pioneering work in quantum computing systems. This comparison highlights how traditional tech giants and cutting-edge innovators approach market demands and innovation strategies. Join me as we explore which company offers the most compelling opportunity for investors today.
Table of contents
Companies Overview
I will begin the comparison between HP Inc. and IonQ, Inc. by providing an overview of these two companies and their main differences.
HP Inc. Overview
HP Inc. is a longstanding leader in the computer hardware industry, providing personal computing devices, imaging and printing products, and related technologies. Established in 1939 and headquartered in Palo Alto, California, HP serves a broad customer base including individual consumers, businesses, and government sectors. The company operates through segments like Personal Systems, Printing, and Corporate Investments, emphasizing innovation and comprehensive technology solutions.
IonQ, Inc. Overview
IonQ, founded in 2015 and based in College Park, Maryland, specializes in quantum computing systems development. The company provides access to its quantum computers via cloud platforms such as AWS, Microsoft Azure, and Google Cloud. IonQ focuses on advancing general-purpose quantum computing, operating in a niche within the broader technology sector and employing a smaller workforce compared to traditional hardware companies.
Key similarities and differences
Both companies belong to the technology sector and operate within the computer hardware industry, with NYSE listings. However, HP Inc. focuses on conventional computing and printing hardware with an extensive global market presence and diversified product lines. In contrast, IonQ concentrates on cutting-edge quantum computing technology, offering cloud-based quantum services and targeting a highly specialized market segment with a smaller employee base and higher beta, indicating potentially greater stock volatility.
Income Statement Comparison
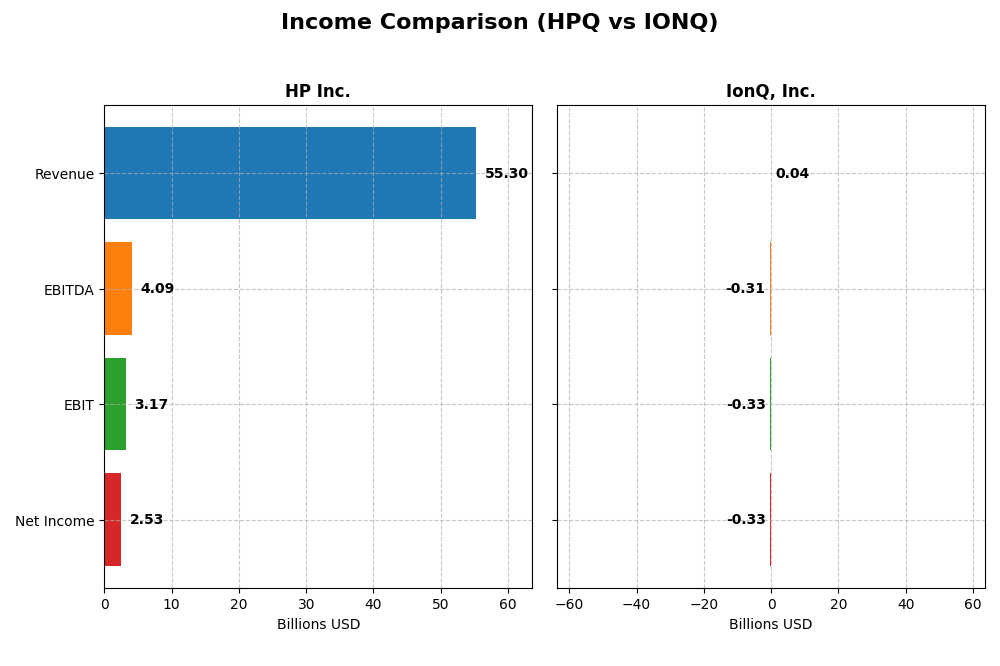
The table below compares the key income statement metrics for HP Inc. and IonQ, Inc. for their most recent fiscal years, highlighting their financial performance in absolute terms and per share.
| Metric | HP Inc. (HPQ) | IonQ, Inc. (IONQ) |
|---|---|---|
| Market Cap | 19.7B | 17.3B |
| Revenue | 55.3B | 43.1M |
| EBITDA | 4.09B | -313M |
| EBIT | 3.17B | -332M |
| Net Income | 2.53B | -332M |
| EPS | 2.67 | -1.56 |
| Fiscal Year | 2025 | 2024 |
Income Statement Interpretations
HP Inc.
HP Inc.’s revenue showed a slight decline over 2021-2025, with a 3.24% growth in the last year but a -12.87% overall period drop. Net income decreased significantly by 61.34% over the period, with a recent net margin decline of 11.73%. The 2025 results reveal margin pressures and reduced profitability despite stable gross margins near 20%.
IonQ, Inc.
IonQ experienced rapid revenue growth of 95.41% in 2024, yet overall revenue remained flat since 2020. The company reported large net losses with a net margin around -770%, and earnings per share deteriorated sharply. Despite top-line expansion, operating margins and profitability worsened, indicating heavy investment and ongoing operational challenges.
Which one has the stronger fundamentals?
Both companies face unfavorable income statement trends, but HP Inc. shows more stable margins and positive net income, albeit declining. IonQ’s strong revenue growth contrasts with persistent large losses and negative margins. HP’s lower interest expense and steadier profitability suggest relatively stronger fundamentals compared to IonQ’s continued negative earnings and high volatility.
Financial Ratios Comparison
The table below presents the most recent financial ratios for HP Inc. and IonQ, Inc., enabling a direct comparison of their key financial metrics as of fiscal year 2025 for HP Inc. and 2024 for IonQ, Inc.
| Ratios | HP Inc. (2025) | IonQ, Inc. (2024) |
|---|---|---|
| ROE | -7.31% | -86.40% |
| ROIC | 24.97% | -48.55% |
| P/E | 10.35 | -26.83 |
| P/B | -75.65 | 23.18 |
| Current Ratio | 0.77 | 10.50 |
| Quick Ratio | 0.48 | 9.98 |
| D/E (Debt-to-Equity) | -31.45 | 0.05 |
| Debt-to-Assets | 26.05% | 3.49% |
| Interest Coverage | 7.16 | 0 |
| Asset Turnover | 1.32 | 0.08 |
| Fixed Asset Turnover | 13.23 | 0.69 |
| Payout Ratio | 43.02% | 0% |
| Dividend Yield | 4.16% | 0% |
Interpretation of the Ratios
HP Inc.
HP Inc. shows a generally favorable ratio profile, with 71.43% of key ratios rated favorably, including strong ROIC at 24.97% and a low WACC of 7.6%. However, concerns arise from its negative ROE (-730.92%) and weak current and quick ratios, indicating liquidity challenges. The company pays a dividend, supported by a solid 4.16% yield, but investors should monitor payout sustainability given mixed profitability metrics.
IonQ, Inc.
IonQ presents a challenging ratio landscape, with 71.43% of ratios unfavorable, reflecting negative profitability metrics such as a net margin of -769.96% and ROE of -86.4%. The firm maintains a very high current ratio (10.5), showing liquidity strength but also inefficiency. IonQ does not pay dividends, consistent with its loss-making status and focus on R&D, typical for a growth-phase quantum computing company.
Which one has the best ratios?
HP Inc. clearly exhibits stronger financial ratios overall, with a majority favorable evaluation and better capital efficiency metrics compared to IonQ. Conversely, IonQ’s unfavorable profitability and operating ratios highlight its developmental stage and heightened risk profile. Thus, HP stands out as having the more robust ratio set among the two.
Strategic Positioning
This section compares the strategic positioning of HP Inc. and IonQ, Inc., including market position, key segments, and exposure to technological disruption:
HP Inc.
- Large market cap 19.7B, established in computer hardware with moderate competitive pressure.
- Diversified segments: Personal Systems, Printing, Corporate Investments drive revenues.
- Moderate exposure to tech disruption, with ongoing corporate investments in innovation.
IonQ, Inc.
- Smaller market cap 17.3B, newer quantum computing player with high competitive volatility.
- Focused on quantum computing systems accessed via cloud platforms, a niche high-tech segment.
- High exposure to emerging quantum technology, dependent on cloud platform partnerships.
HP Inc. vs IonQ, Inc. Positioning
HP Inc. operates a diversified business model across hardware and printing markets, offering scale advantages but facing moderate disruption risks. IonQ is concentrated in quantum computing, a high-risk, high-potential niche with limited revenue diversity and greater technological uncertainty.
Which has the best competitive advantage?
HP Inc. shows a slightly favorable moat with value creation despite declining profitability, while IonQ has a very unfavorable moat, shedding value and facing steep profitability declines, indicating HP’s stronger competitive advantage based on current MOAT evaluation.
Stock Comparison
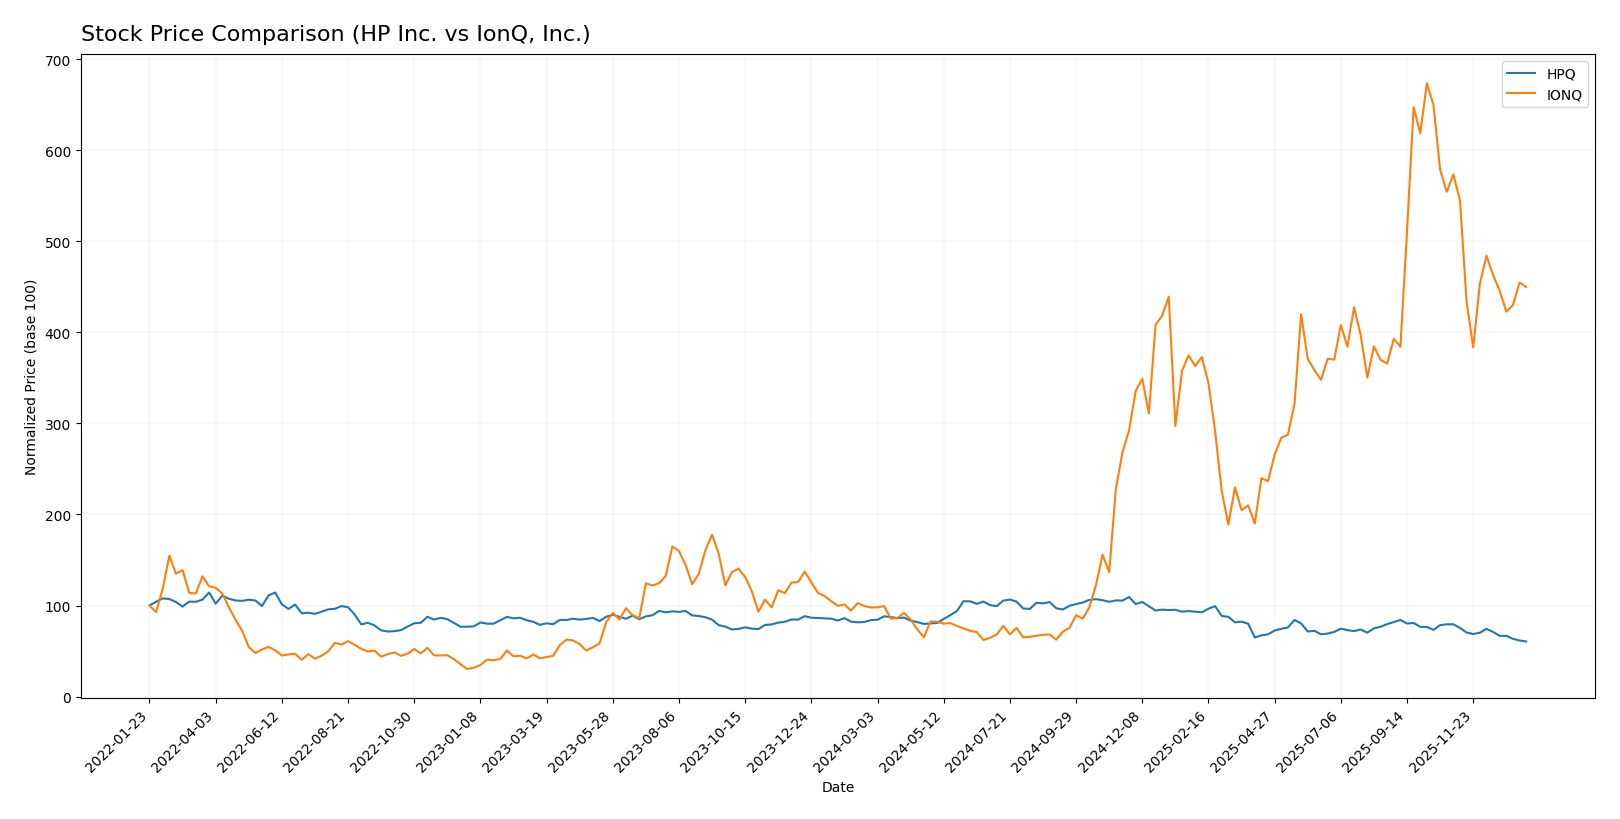
The past year has seen contrasting stock price movements for HP Inc. and IonQ, Inc., with HPQ facing a significant bearish trend and IonQ showing a strong bullish trajectory despite recent declines in both stocks.
Trend Analysis
HP Inc.’s stock has experienced a bearish trend over the past 12 months, with a price decline of 27.98%. The trend shows deceleration, with notable volatility at a 4.65 standard deviation and prices ranging from 38.13 to 21.08.
IonQ, Inc.’s stock exhibited a strong bullish trend over the same period, gaining 359.53%. Despite recent deceleration and a 21.55% drop in the last months, the stock remains highly volatile with an 18.7 standard deviation and a price range from 6.76 to 73.28.
Comparing both stocks, IonQ, Inc. has delivered the highest market performance over the past year, significantly outperforming HP Inc. despite recent downward pressure on both shares.
Target Prices
The current analyst consensus presents optimistic target prices for both HP Inc. and IonQ, Inc.
| Company | Target High | Target Low | Consensus |
|---|---|---|---|
| HP Inc. | 30 | 20 | 24.8 |
| IonQ, Inc. | 100 | 55 | 72.57 |
Analysts expect HP Inc.’s price to rise modestly above its current 21.08 USD, while IonQ, Inc. shows a more aggressive upside potential compared to its 48.94 USD trading price.
Analyst Opinions Comparison
This section compares analysts’ ratings and grades for HP Inc. and IonQ, Inc.:
Rating Comparison
HPQ Rating
- Rating: B- indicating a very favorable overall assessment by analysts.
- Discounted Cash Flow Score: 4, signaling a favorable valuation based on future cash flow.
- ROE Score: 1, rated very unfavorable for efficiency in generating profit from equity.
- ROA Score: 4, favorable score for asset utilization in earnings generation.
- Debt To Equity Score: 1, very unfavorable, reflecting higher financial risk.
- Overall Score: 2, moderate overall financial standing.
IONQ Rating
- Rating: C- also marked as very favorable despite a lower grade.
- Discounted Cash Flow Score: 1, considered very unfavorable by analysts.
- ROE Score: 1, also very unfavorable, showing low profit generation efficiency.
- ROA Score: 1, very unfavorable, indicating poor asset utilization.
- Debt To Equity Score: 4, favorable, indicating lower financial risk.
- Overall Score: 1, very unfavorable overall financial standing.
Which one is the best rated?
Based strictly on the provided scores, HP Inc. holds a better overall rating (B-) and more favorable scores in discounted cash flow and asset utilization, whereas IonQ has a lower overall score and mostly unfavorable financial metrics except for debt-to-equity.
Scores Comparison
The following table compares the Altman Z-Score and Piotroski Score of HP Inc. and IonQ, Inc.:
HPQ Scores
- Altman Z-Score: 1.60, in distress zone indicating high bankruptcy risk.
- Piotroski Score: 6, average financial strength.
IONQ Scores
- Altman Z-Score: 3.67, in safe zone indicating low bankruptcy risk.
- Piotroski Score: 2, very weak financial strength.
Which company has the best scores?
IonQ has a significantly better Altman Z-Score, placing it in the safe zone, while HP Inc. is in distress. However, HP Inc. has a stronger Piotroski Score, indicating better financial health compared to IonQ’s very weak score.
Grades Comparison
Here is a detailed comparison of the latest grades assigned to HP Inc. and IonQ, Inc.:
HP Inc. Grades
The following table summarizes recent grades from reputable financial institutions for HP Inc.:
| Grading Company | Action | New Grade | Date |
|---|---|---|---|
| Goldman Sachs | Maintain | Neutral | 2025-11-26 |
| Evercore ISI Group | Maintain | In Line | 2025-11-26 |
| Citigroup | Maintain | Neutral | 2025-11-26 |
| Morgan Stanley | Maintain | Underweight | 2025-11-26 |
| JP Morgan | Maintain | Neutral | 2025-11-26 |
| Barclays | Maintain | Equal Weight | 2025-11-26 |
| TD Cowen | Maintain | Hold | 2025-11-26 |
| UBS | Maintain | Neutral | 2025-11-26 |
| Morgan Stanley | Maintain | Underweight | 2025-11-21 |
| B of A Securities | Maintain | Neutral | 2025-11-21 |
HP Inc.’s grades primarily indicate a hold or neutral stance, with some underweight and equal weight ratings, reflecting cautious sentiment.
IonQ, Inc. Grades
Below is a summary of recent grades from recognized grading firms for IonQ, Inc.:
| Grading Company | Action | New Grade | Date |
|---|---|---|---|
| Benchmark | Maintain | Buy | 2024-08-12 |
| Goldman Sachs | Maintain | Neutral | 2024-08-09 |
| Craig-Hallum | Maintain | Buy | 2024-08-08 |
| Needham | Maintain | Buy | 2024-05-16 |
| Needham | Maintain | Buy | 2024-05-09 |
| Goldman Sachs | Maintain | Neutral | 2024-02-29 |
| Needham | Maintain | Buy | 2024-02-29 |
| Morgan Stanley | Maintain | Equal Weight | 2023-10-30 |
| Needham | Maintain | Buy | 2023-09-20 |
| Needham | Maintain | Buy | 2023-09-19 |
IonQ shows predominantly buy ratings with some neutral and equal weight assessments, suggesting a generally positive outlook.
Which company has the best grades?
IonQ, Inc. has received more buy ratings compared to HP Inc., whose consensus leans toward hold or neutral. This implies IonQ may be viewed with greater growth potential, while HP is seen as more stable but less likely to outperform.
Strengths and Weaknesses
Below is a summary comparison of key strengths and weaknesses for HP Inc. and IonQ, Inc. based on the most recent financial and strategic data.
| Criterion | HP Inc. | IonQ, Inc. |
|---|---|---|
| Diversification | Strong diversification with Personal Systems (~38.5B), Printing (~16.7B), and Corporate Investments segments | Limited diversification, primarily focused on quantum computing |
| Profitability | Positive ROIC of 25%, favorable WACC, but declining net margin (4.57%) and negative ROE (-730.92%) | Negative ROIC (-48.55%), net margin deeply negative (-770%), and negative ROE (-86.4%) |
| Innovation | Moderate innovation with steady investments in Corporate segment (62M in 2025) | High innovation potential in quantum technology but unproven profitability |
| Global presence | Established global presence with strong asset turnover (1.32) and fixed asset turnover (13.23) | Emerging global presence, low asset turnover (0.08), and limited scale |
| Market Share | Large market share in personal systems and printing sectors | Niche market player in quantum computing, small market share |
Key takeaways: HP Inc. shows solid diversification and favorable capital efficiency despite some profitability pressures, while IonQ, Inc. faces significant challenges with profitability and scale but holds promise in a cutting-edge technology niche. Investors should weigh HP’s stable, value-creating profile against IonQ’s high-risk, high-reward outlook.
Risk Analysis
Below is a table summarizing key risks for HP Inc. and IonQ, Inc. based on the most recent data available in 2026:
| Metric | HP Inc. | IonQ, Inc. |
|---|---|---|
| Market Risk | Moderate (Beta 1.22) | High (Beta 2.63) |
| Debt level | Low (Debt to Assets 26.05%) | Very Low (Debt to Assets 3.49%) |
| Regulatory Risk | Moderate (Tech sector regulations) | Elevated (Emerging quantum tech) |
| Operational Risk | Moderate (Large scale manufacturing) | High (Early-stage tech development) |
| Environmental Risk | Moderate (Printing & hardware impact) | Low (Cloud-based quantum services) |
| Geopolitical Risk | Moderate (Global supply chain exposure) | Moderate (US-based, global cloud reliance) |
HP Inc. faces moderate market and operational risks due to supply chain and legacy hardware challenges, but maintains a manageable debt level and good interest coverage. IonQ’s high market volatility and operational risks stem from its emerging quantum technology and early development phase, despite low debt. IonQ’s financial distress signals and weak profitability metrics increase its risk profile significantly.
Which Stock to Choose?
HP Inc. (HPQ) shows a stable income evolution with a 3.24% revenue growth in 2025 but declining profitability over the 2021-2025 period. Its financial ratios are predominantly favorable (71%), including a strong ROIC of 24.97% exceeding its WACC, indicating value creation despite declining ROIC trend. The company carries moderate debt with a net debt to EBITDA of 1.76 and a very favorable overall rating of B-.
IonQ, Inc. (IONQ) experienced substantial revenue growth of 95.41% in 2024 but suffers from negative profitability and unfavorable financial ratios (71%), including a negative ROIC well below WACC, signaling value destruction. It maintains a very strong liquidity position with a high current ratio of 10.5 and low debt, but has a very unfavorable overall rating of C- due to weak returns and high operational costs.
Investors focused on value and financial stability may find HPQ’s favorable ratios and value-creating moat more aligned with their profile, while those with a tolerance for risk and interest in high-growth potential might interpret IONQ’s rapid revenue expansion and liquidity as opportunities despite its unfavorable profitability and rating.
Disclaimer: Investment carries a risk of loss of initial capital. The past performance is not a reliable indicator of future results. Be sure to understand risks before making an investment decision.
Go Further
I encourage you to read the complete analyses of HP Inc. and IonQ, Inc. to enhance your investment decisions: