Home > Comparison > Industrials > HWM vs XYL
The strategic competition between Howmet Aerospace Inc. and Xylem Inc. shapes the industrial machinery sector’s current landscape. Howmet Aerospace excels as a capital-intensive aerospace components manufacturer, while Xylem specializes in engineered water solutions with a diversified global footprint. This head-to-head reflects a classic contrast between aerospace precision manufacturing and infrastructure-driven growth. This analysis will identify which business model delivers superior risk-adjusted returns for a balanced industrial portfolio.
Table of contents
Companies Overview
Howmet Aerospace and Xylem Inc. both play pivotal roles in the industrial machinery sector, shaping distinct global markets.
Howmet Aerospace Inc.: Advanced Engineered Solutions Leader
Howmet Aerospace dominates the aerospace and transportation industries by delivering engineered solutions such as airfoils, fastening systems, and forged wheels. Its revenue stems from four core segments targeting aircraft engines, structural parts, and commercial transportation. In 2026, the company sharpened its focus on innovation in engine products and lightweight materials to enhance fuel efficiency and performance.
Xylem Inc.: Water Technology Innovator
Xylem Inc. specializes in engineered products for water and wastewater management, generating income through water infrastructure, applied water, and measurement solutions. Its strategy centers on expanding smart water technologies and cloud-based analytics to optimize water treatment and distribution systems worldwide. The company emphasizes sustainable solutions to address global water challenges in 2026.
Strategic Collision: Similarities & Divergences
Both companies excel in industrial machinery but embrace different philosophies: Howmet focuses on precision aerospace components while Xylem drives water infrastructure innovation. Their primary battleground is technological advancement—lightweight materials versus smart water analytics. This divergence translates into distinct investment profiles, with Howmet appealing to aerospace-centric portfolios and Xylem attracting sustainability-driven investors.
Income Statement Comparison
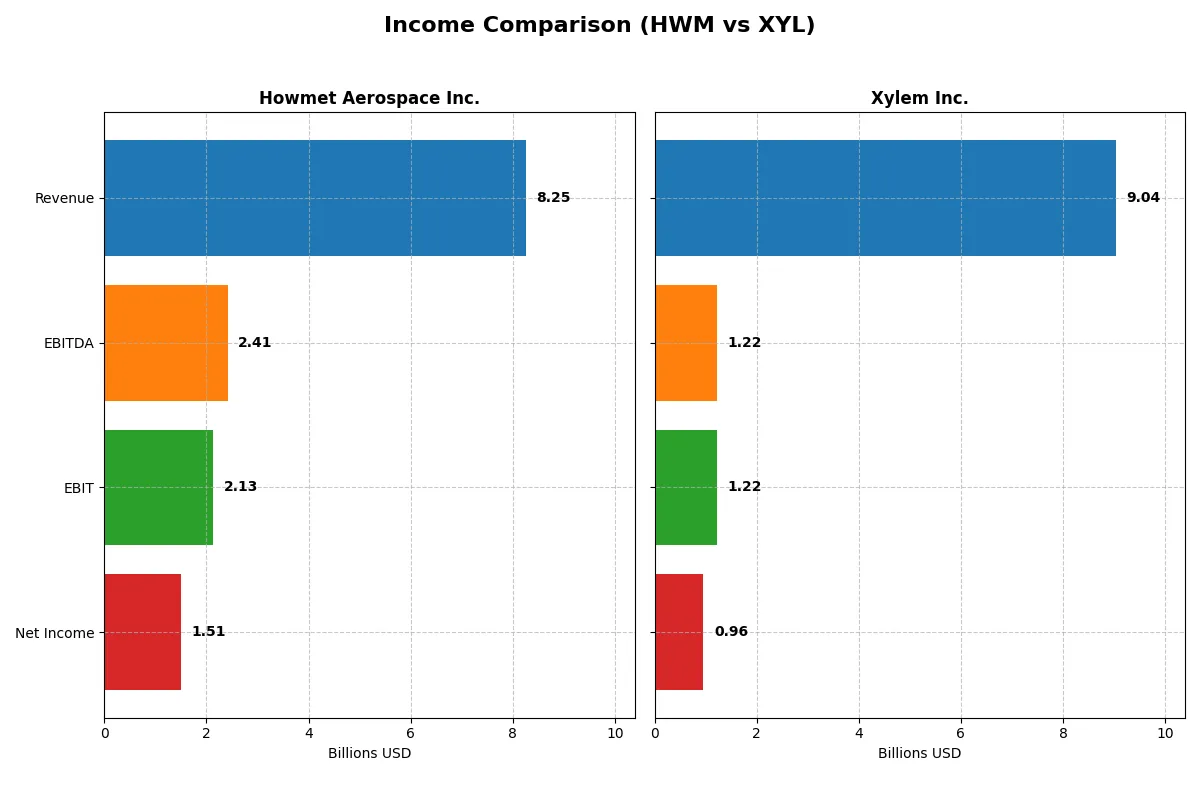
This data dissects the core profitability and scalability of both corporate engines to reveal who dominates the bottom line:
| Metric | Howmet Aerospace Inc. (HWM) | Xylem Inc. (XYL) |
|---|---|---|
| Revenue | 8.25B | 9.04B |
| Cost of Revenue | 5.72B | 5.56B |
| Operating Expenses | 407M | 2.25B |
| Gross Profit | 2.54B | 3.48B |
| EBITDA | 2.41B | 1.22B |
| EBIT | 2.13B | 1.22B |
| Interest Expense | 151M | 29M |
| Net Income | 1.51B | 957M |
| EPS | 3.73 | 3.93 |
| Fiscal Year | 2025 | 2025 |
Income Statement Analysis: The Bottom-Line Duel
The following income statement comparison reveals the true efficiency and profitability momentum driving each company’s corporate engine.
Howmet Aerospace Inc. Analysis
Howmet Aerospace grew revenue from 5.0B in 2021 to 8.3B in 2025, boosting net income from 256M to 1.51B. Gross and net margins expanded strongly to 30.7% and 18.3%, respectively. The 2025 year showed sharp EBIT growth of 36%, reflecting improved cost control and operational leverage.
Xylem Inc. Analysis
Xylem increased revenue from 5.2B in 2021 to 9.0B in 2025, with net income rising from 427M to 957M. Its gross margin stands higher at 38.5%, though net margin lags at 10.6%. Despite solid revenue gains, 2025 EBIT grew moderately by 8%, indicating less operational efficiency compared to Howmet.
Margin Expansion vs. Revenue Growth
Howmet Aerospace delivers superior margin expansion and bottom-line leverage, nearly doubling net income growth relative to Xylem. Xylem’s advantage lies in higher gross margins and top-line scale but shows weaker net margin conversion. For investors prioritizing profitability efficiency, Howmet’s profile appears more compelling.
Financial Ratios Comparison
These vital ratios act as a diagnostic tool to expose the underlying fiscal health, valuation premiums, and capital efficiency of the companies compared below:
| Ratios | Howmet Aerospace Inc. (HWM) | Xylem Inc. (XYL) |
|---|---|---|
| ROE | 28.17% | 8.34% |
| ROIC | 18.19% | 6.42% |
| P/E | 54.93 | 34.64 |
| P/B | 15.47 | 2.89 |
| Current Ratio | 2.13 | 1.63 |
| Quick Ratio | 1.09 | 1.28 |
| D/E | 0.57 | 0.17 |
| Debt-to-Assets | 27.28% | 11.01% |
| Interest Coverage | 14.11 | 42.17 |
| Asset Turnover | 0.74 | 0.51 |
| Fixed Asset Turnover | 3.18 | 7.80 |
| Payout ratio | 12.00% | 40.86% |
| Dividend yield | 0.22% | 1.18% |
| Fiscal Year | 2025 | 2025 |
Efficiency & Valuation Duel: The Vital Signs
Financial ratios act as the company’s DNA, revealing hidden risks and operational excellence that drive long-term shareholder value.
Howmet Aerospace Inc.
Howmet Aerospace delivers robust profitability with a 28.17% ROE and an 18.27% net margin, signaling strong operational efficiency. The stock trades at a stretched P/E of 54.93 and a high P/B of 15.47, indicating premium valuation. Dividend yield is modest at 0.22%, reflecting a focus on reinvestment over payouts.
Xylem Inc.
Xylem posts a moderate 8.34% ROE and a 10.59% net margin, reflecting less operational efficiency than peers. Its valuation is lower but still elevated, with a P/E of 34.64 and a neutral P/B of 2.89. Xylem offers a 1.18% dividend yield, balancing shareholder returns with steady capital discipline.
Premium Valuation vs. Operational Safety
Howmet Aerospace commands a premium for superior profitability and efficiency but carries valuation risk. Xylem offers a more conservative entry with reasonable dividends and lower leverage. Investors prioritizing growth may prefer Howmet; those seeking stability might favor Xylem’s steady profile.
Which one offers the Superior Shareholder Reward?
I compare Howmet Aerospace (HWM) and Xylem Inc. (XYL) by examining dividends, payout ratios, and buyback intensity to assess sustainable shareholder returns. HWM yields a meager 0.22% with a low 12% payout, preserving 76% FCF coverage. XYL pays a robust 1.18% yield but with a high 41% payout ratio, reducing reinvestment capacity. Both deploy capital in buybacks, yet HWM’s moderate leverage and improving cash flow support sustainable distributions. XYL’s higher payout and aggressive buybacks risk growth reinvestment. I conclude HWM offers a more durable total return profile for prudent investors in 2026.
Comparative Score Analysis: The Strategic Profile
The radar chart reveals the fundamental DNA and trade-offs of Howmet Aerospace Inc. and Xylem Inc., highlighting their financial strengths and valuation dynamics:
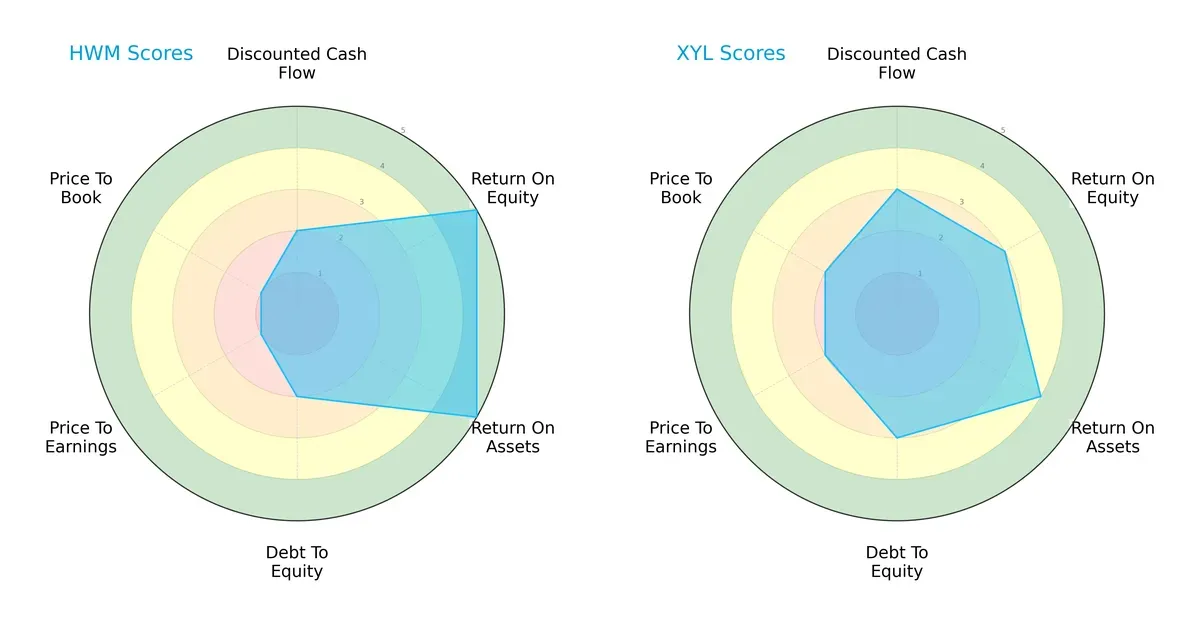
Howmet Aerospace excels in profitability with top ROE and ROA scores (5 each) but struggles with valuation, scoring very low on P/E and P/B (1 each) and carries higher financial risk with a weak debt-to-equity score (2). Xylem offers a more balanced profile, featuring moderate profitability and better financial stability, reflected in its higher debt-to-equity (3) and valuation scores (2). I see Howmet relying on operational efficiency, while Xylem emphasizes financial prudence and valuation discipline.
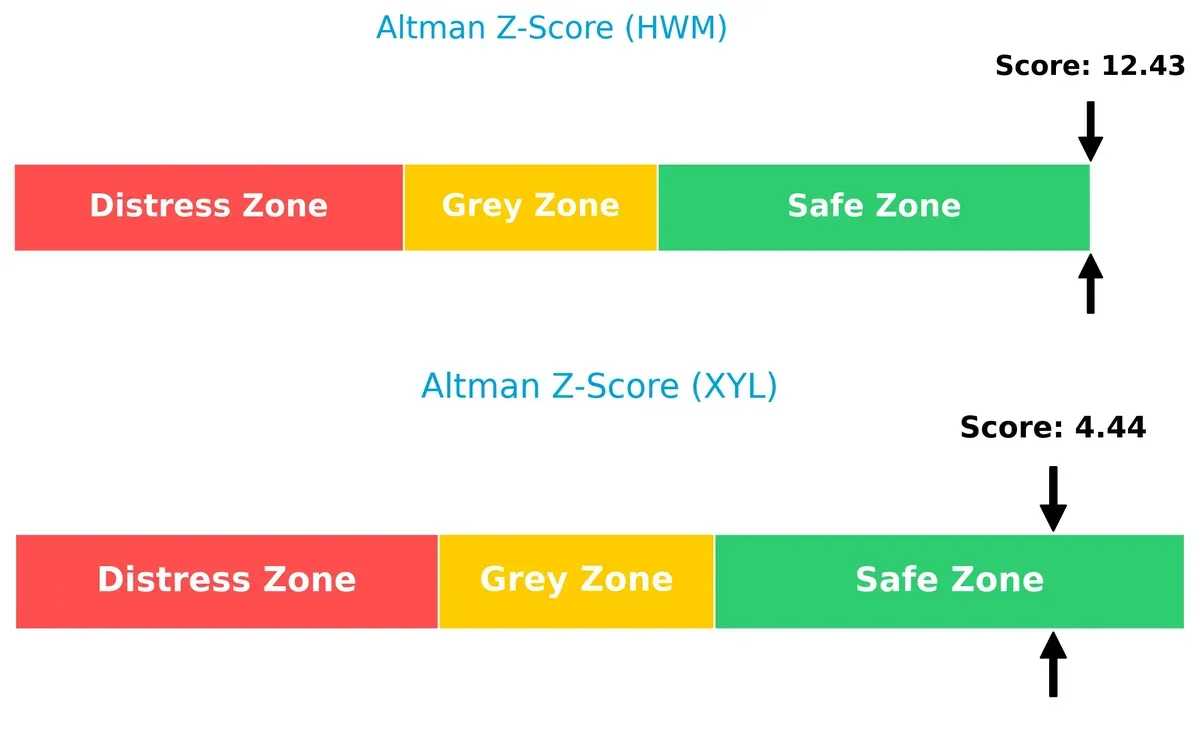
Bankruptcy Risk: Solvency Showdown
Howmet Aerospace’s Altman Z-Score of 12.4 vastly outperforms Xylem’s 4.4, signaling superior long-term solvency and resilience even in a volatile market cycle:
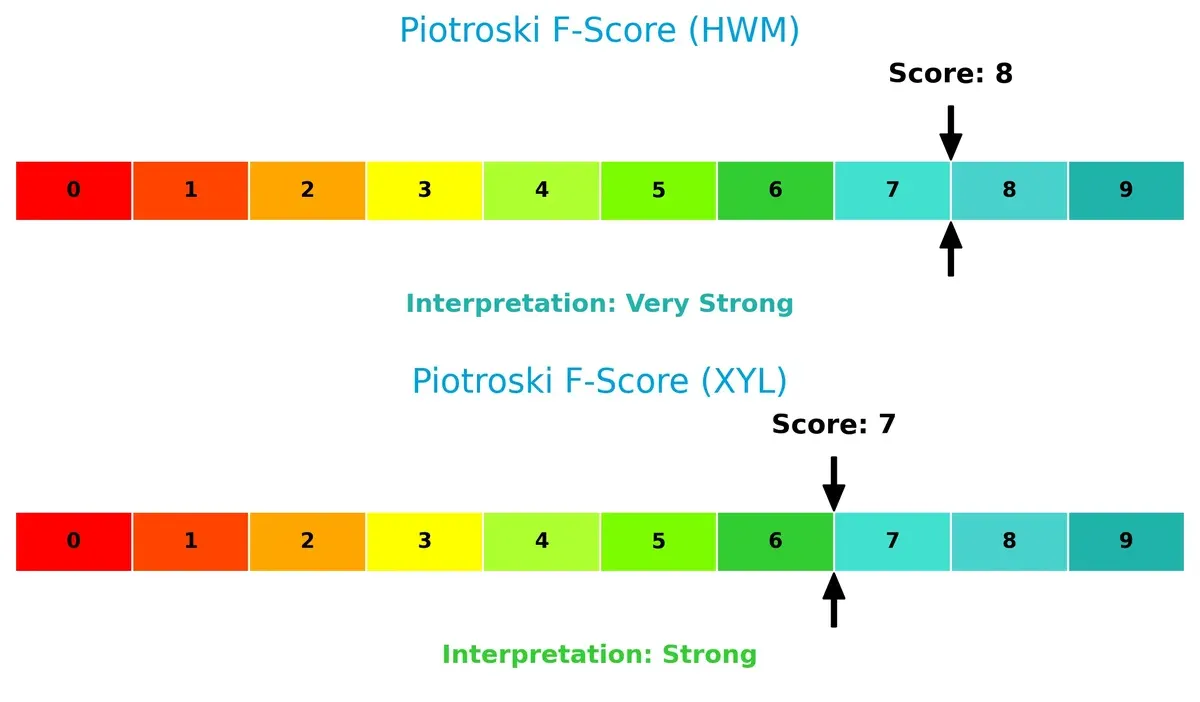
Financial Health: Quality of Operations
Howmet Aerospace scores an 8 on the Piotroski scale, indicating very strong financial health, slightly edging out Xylem’s strong 7. This suggests Howmet has more robust internal metrics and fewer red flags:
How are the two companies positioned?
This section dissects the operational DNA of HWM and XYL by comparing their revenue distribution by segment and internal dynamics. The goal is to confront their economic moats and reveal which business model holds the most resilient competitive advantage today.
Revenue Segmentation: The Strategic Mix
The following visual comparison dissects how Howmet Aerospace Inc. and Xylem Inc. diversify their income streams and where their primary sector bets lie:
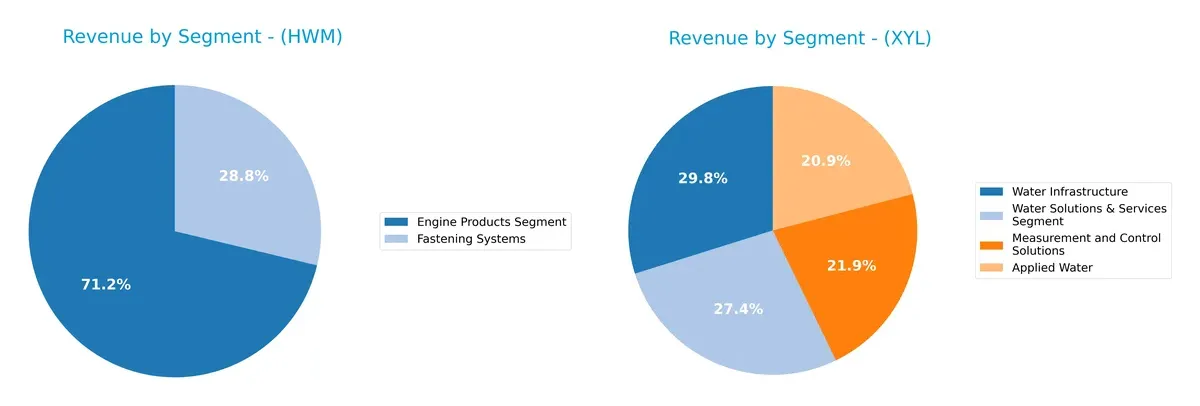
Howmet Aerospace anchors revenue in its Engine Products Segment with $4.3B in 2025, dwarfing its Fastening Systems at $1.7B. This signals concentration risk but also strength in aerospace components. Conversely, Xylem displays a more balanced mix, with Water Infrastructure at $2.6B, Water Solutions & Services at $2.3B, and Measurement and Control Solutions near $1.9B, fostering ecosystem lock-in across water management markets.
Strengths and Weaknesses Comparison
This table compares the Strengths and Weaknesses of Howmet Aerospace Inc. and Xylem Inc.:
HWM Strengths
- High net margin at 18.27%
- Strong ROE at 28.17%
- Favorable current and quick ratios
- Diverse product segments including Engine and Fastening Systems
- Significant global presence with strong US revenue
- Favorable debt-to-assets ratio and interest coverage
XYL Strengths
- Positive net margin at 10.59%
- Favorable current and quick ratios
- Low debt-to-equity at 0.17
- High fixed asset turnover at 7.8
- Well-diversified water-related segments
- Balanced geographic sales with strong US and Europe presence
HWM Weaknesses
- High P/E of 54.93 and P/B of 15.47 indicate expensive valuation
- Low dividend yield at 0.22%
- Moderate debt-to-equity ratio at 0.57
- Neutral asset turnover at 0.74
- Market concentration in US with less diversification
XYL Weaknesses
- Low ROE at 8.34%
- P/E of 34.64 is relatively high
- Neutral P/B at 2.89
- Neutral ROIC at 6.42%
- Asset turnover at 0.51 is low
- Lower profitability compared to HWM
Howmet Aerospace displays superior profitability and solid liquidity but faces valuation and dividend yield concerns. Xylem shows prudent leverage and efficient fixed asset use but struggles with lower returns on equity and profitability. These factors shape each company’s strategic financial positioning.
The Moat Duel: Analyzing Competitive Defensibility
A structural moat is the only reliable shield protecting long-term profits from relentless competition erosion. Let’s dissect the competitive moats of two industrial giants:
Howmet Aerospace Inc.: Engineering a Cost and Scale Moat
Howmet leverages advanced manufacturing and scale to sustain a cost advantage. Its high ROIC of 8.8% above WACC and 25.8% EBIT margin confirm efficient capital use. New aerospace and transportation contracts in 2026 could deepen its moat further.
Xylem Inc.: Innovation-Driven but Struggling with Capital Efficiency
Xylem’s moat centers on proprietary water technology and brand portfolio, contrasting Howmet’s cost focus. Yet, declining ROIC and a negative spread versus WACC signal weakening capital efficiency. Expansion into smart water solutions in 2026 offers growth, but profitability risks persist.
Cost Leadership vs. Innovation Under Pressure
Howmet Aerospace exhibits a deeper, widening moat with rising ROIC and margin stability. Xylem’s innovation moat faces pressure from declining returns and capital inefficiency. Howmet is better positioned to defend its market share through superior operational leverage and capital allocation.
Which stock offers better returns?
The past year revealed stark contrasts in price dynamics: Howmet Aerospace surged sharply while Xylem declined modestly, reflecting divergent investor sentiment and momentum shifts.
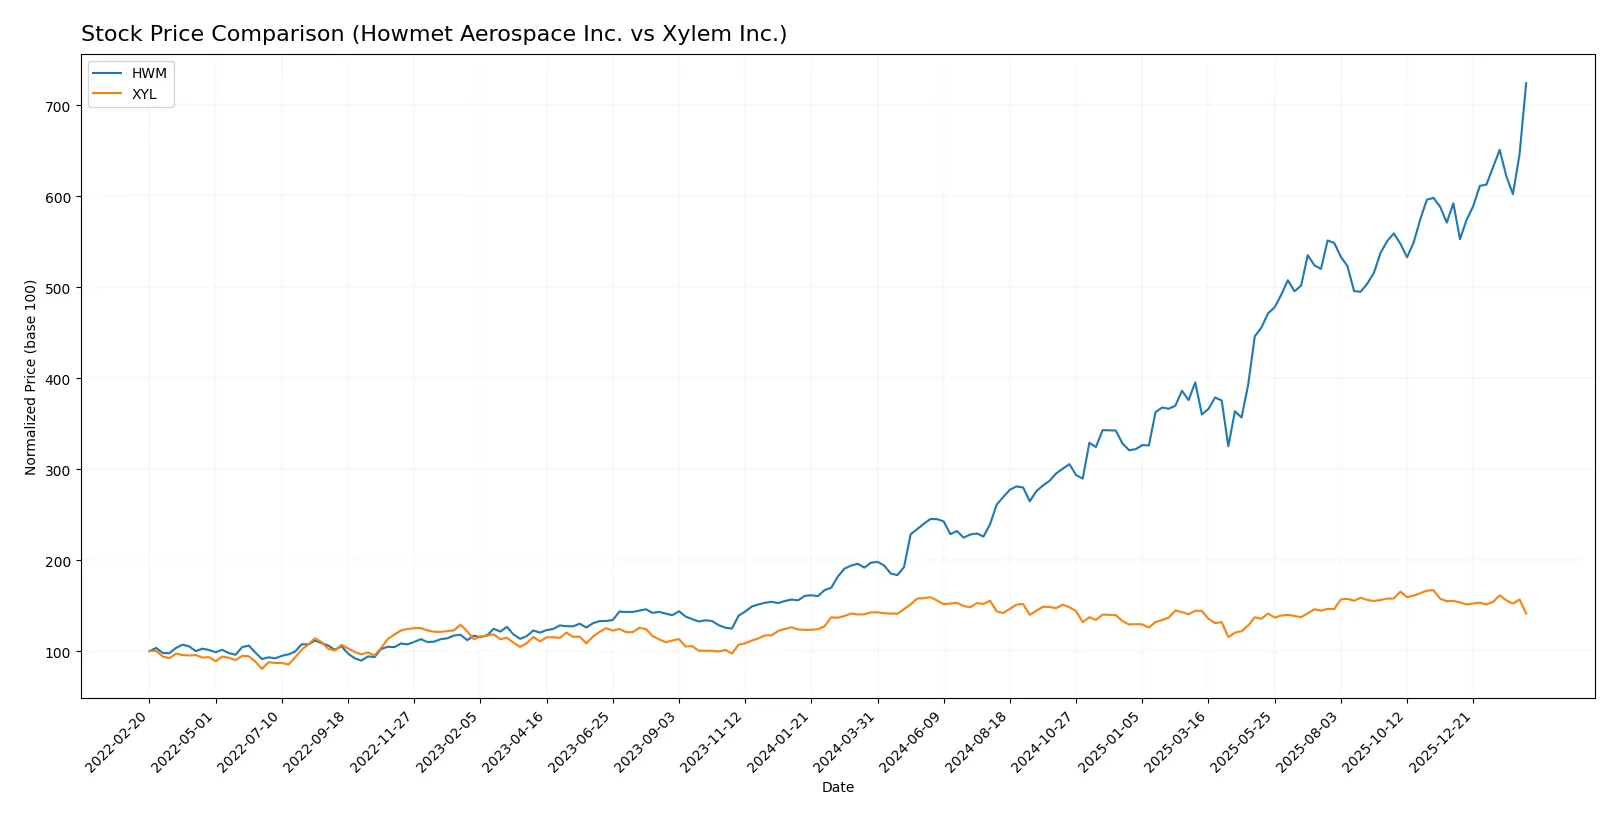
Trend Comparison
Howmet Aerospace Inc. (HWM) shows a strong bullish trend with a 267.42% price increase over 12 months, accelerating steadily from a low of 63.41 to a peak of 250.21, with high volatility (std dev 48.78).
Xylem Inc. (XYL) experienced a slight bearish trend, dropping 0.87% in the same period, marked by deceleration and lower volatility (std dev 9.59), with prices ranging between 104.6 and 151.31.
Comparing both, Howmet Aerospace clearly outperformed Xylem, delivering the highest market returns and stronger positive momentum throughout the year.
Target Prices
Analysts present a confident upside potential for Howmet Aerospace Inc. and Xylem Inc. based on current consensus targets.
| Company | Target Low | Target High | Consensus |
|---|---|---|---|
| Howmet Aerospace Inc. | 209 | 290 | 259.63 |
| Xylem Inc. | 138 | 176 | 162.67 |
Howmet Aerospace’s consensus target at 259.63 exceeds its current price of 250.21, suggesting moderate upside. Xylem’s consensus at 162.67 is significantly above its 128.09 price, indicating stronger growth expectations.

Don’t Let Luck Decide Your Entry Point
Optimize your entry points with our advanced ProRealTime indicators. You’ll get efficient buy signals with precise price targets for maximum performance. Start outperforming now!
How do institutions grade them?
The institutional grades for Howmet Aerospace Inc. and Xylem Inc. reflect their recent analyst assessments:
Howmet Aerospace Inc. Grades
Below is a summary of recent analyst grades for Howmet Aerospace Inc.:
| Grading Company | Action | New Grade | Date |
|---|---|---|---|
| Susquehanna | Maintain | Positive | 2026-02-13 |
| Citigroup | Maintain | Buy | 2026-01-13 |
| B of A Securities | Maintain | Buy | 2025-11-14 |
| JP Morgan | Maintain | Overweight | 2025-11-10 |
| BTIG | Maintain | Buy | 2025-11-03 |
| Goldman Sachs | Maintain | Buy | 2025-11-03 |
| TD Cowen | Maintain | Buy | 2025-10-31 |
| RBC Capital | Maintain | Outperform | 2025-10-31 |
| UBS | Maintain | Neutral | 2025-10-31 |
| Truist Securities | Maintain | Buy | 2025-10-15 |
Xylem Inc. Grades
Below is a summary of recent analyst grades for Xylem Inc.:
| Grading Company | Action | New Grade | Date |
|---|---|---|---|
| Citigroup | Maintain | Buy | 2026-02-11 |
| Stifel | Maintain | Buy | 2026-02-11 |
| RBC Capital | Maintain | Outperform | 2026-02-11 |
| Barclays | Maintain | Overweight | 2026-02-11 |
| Barclays | Maintain | Overweight | 2026-01-07 |
| Mizuho | Maintain | Neutral | 2026-01-05 |
| TD Cowen | Maintain | Hold | 2025-12-05 |
| UBS | Maintain | Buy | 2025-11-06 |
| Stifel | Maintain | Buy | 2025-10-29 |
| RBC Capital | Maintain | Outperform | 2025-10-29 |
Which company has the best grades?
Howmet Aerospace Inc. receives predominantly Buy and Outperform ratings, with one Neutral. Xylem Inc. also shows strong Buy and Outperform ratings but includes a Hold and Neutral. Howmet’s slightly more consistent positive outlook may suggest greater analyst conviction. Investors might interpret this as a marginally stronger institutional confidence in Howmet.
Risks specific to each company
The following categories identify the critical pressure points and systemic threats facing both firms in the 2026 market environment:
1. Market & Competition
Howmet Aerospace Inc.
- Faces intense competition in aerospace and transportation with high innovation demands.
Xylem Inc.
- Competes in water technology with pressure to innovate and maintain infrastructure contracts.
2. Capital Structure & Debt
Howmet Aerospace Inc.
- Moderate debt-to-equity ratio at 0.57; interest coverage strong at 14.11x.
Xylem Inc.
- Lower debt-to-equity at 0.17; very strong interest coverage at 42.17x.
3. Stock Volatility
Howmet Aerospace Inc.
- Beta of 1.25 suggests higher volatility than market average.
Xylem Inc.
- Beta of 1.16 indicates moderately elevated volatility but less than Howmet.
4. Regulatory & Legal
Howmet Aerospace Inc.
- Aerospace industry faces strict export controls and safety regulations.
Xylem Inc.
- Water infrastructure regulated by environmental and local government standards.
5. Supply Chain & Operations
Howmet Aerospace Inc.
- Complex global supply chain exposed to geopolitical tensions and raw material costs.
Xylem Inc.
- Relies on diversified suppliers but sensitive to disruptions in manufacturing and logistics.
6. ESG & Climate Transition
Howmet Aerospace Inc.
- Pressure to reduce emissions in aerospace manufacturing; ESG compliance costly.
Xylem Inc.
- Positioned to benefit from water sustainability trends but faces transition costs.
7. Geopolitical Exposure
Howmet Aerospace Inc.
- Global footprint in sensitive defense and aerospace markets raises geopolitical risks.
Xylem Inc.
- International sales expose it to trade tensions and regulatory variability.
Which company shows a better risk-adjusted profile?
Howmet Aerospace’s biggest risk is market competition combined with high valuation multiples (P/E 55x). Xylem faces lower leverage risk but weaker profitability and ROE. Howmet’s Altman Z-Score and Piotroski Score signal stronger financial health despite valuation concerns. Xylem’s lower debt and more stable interest coverage ease financial risk but its moderate profitability tempers upside. Overall, Howmet shows a better risk-adjusted profile, but investors should watch valuation and sector cyclicality closely.
Final Verdict: Which stock to choose?
Howmet Aerospace (HWM) excels as a cash-generating powerhouse with a robust economic moat. Its soaring returns on invested capital suggest efficient capital use and strong value creation. Yet, its lofty valuation multiples signal a point of vigilance. HWM suits investors targeting aggressive growth with tolerance for premium pricing.
Xylem Inc. (XYL) offers a strategic moat rooted in stable, recurring revenue streams from water technology solutions. It presents a safer financial profile with lower leverage and steadier cash flows compared to HWM. XYL fits well in GARP portfolios seeking moderate growth balanced with relative stability.
If you prioritize high-growth and value creation backed by strong capital efficiency, Howmet Aerospace outshines with accelerating momentum despite valuation risks. However, if you seek better stability and a more conservative risk profile, Xylem provides a compelling alternative with its steady cash flow and durable market niche. Both present distinct analytical scenarios for different investor archetypes.
Disclaimer: Investment carries a risk of loss of initial capital. The past performance is not a reliable indicator of future results. Be sure to understand risks before making an investment decision.
Go Further
I encourage you to read the complete analyses of Howmet Aerospace Inc. and Xylem Inc. to enhance your investment decisions: