Howmet Aerospace Inc. (HWM) and Symbotic Inc. (SYM) are two prominent players in the industrial machinery sector, each driving innovation in distinct yet overlapping markets. Howmet Aerospace focuses on advanced engineered solutions for aerospace and transportation, while Symbotic leads in warehouse automation technology. This comparison highlights their strategic approaches and market potential, guiding investors toward the most compelling opportunity in this dynamic industry.
Table of contents
Companies Overview
I will begin the comparison between Howmet Aerospace Inc. and Symbotic Inc. by providing an overview of these two companies and their main differences.
Howmet Aerospace Inc. Overview
Howmet Aerospace Inc. delivers advanced engineered solutions primarily for the aerospace and transportation sectors globally, with operations spanning the US, Europe, and Asia. The company operates through four core segments: Engine Products, Fastening Systems, Engineered Structures, and Forged Wheels. Founded in 1888 and based in Pittsburgh, PA, Howmet holds a strong position in industrial machinery markets with a focus on specialized aerospace components.
Symbotic Inc. Overview
Symbotic Inc. specializes in automation technology, providing robotics and warehouse automation systems that enhance efficiency for retailers and wholesalers in the US. The company’s flagship offering, The Symbotic System, integrates robotics to reduce costs and optimize inventory management. Founded more recently and headquartered in Wilmington, MA, Symbotic operates within the industrial machinery sector with a focus on technology-driven warehouse solutions.
Key similarities and differences
Both Howmet and Symbotic operate in the industrial machinery sector in the US, targeting efficiency improvements in their respective markets. Howmet focuses on engineered components for aerospace and transportation, offering diverse product segments, while Symbotic centers on robotics and automation for warehouse operations. Additionally, Howmet has a broader international presence and a longer corporate history, whereas Symbotic is a newer company with a technology-centric business model.
Income Statement Comparison
The table below presents a side-by-side comparison of the latest full fiscal year income statement figures for Howmet Aerospace Inc. and Symbotic Inc., highlighting key financial metrics.
| Metric | Howmet Aerospace Inc. (HWM) | Symbotic Inc. (SYM) |
|---|---|---|
| Market Cap | 88B | 42.5B |
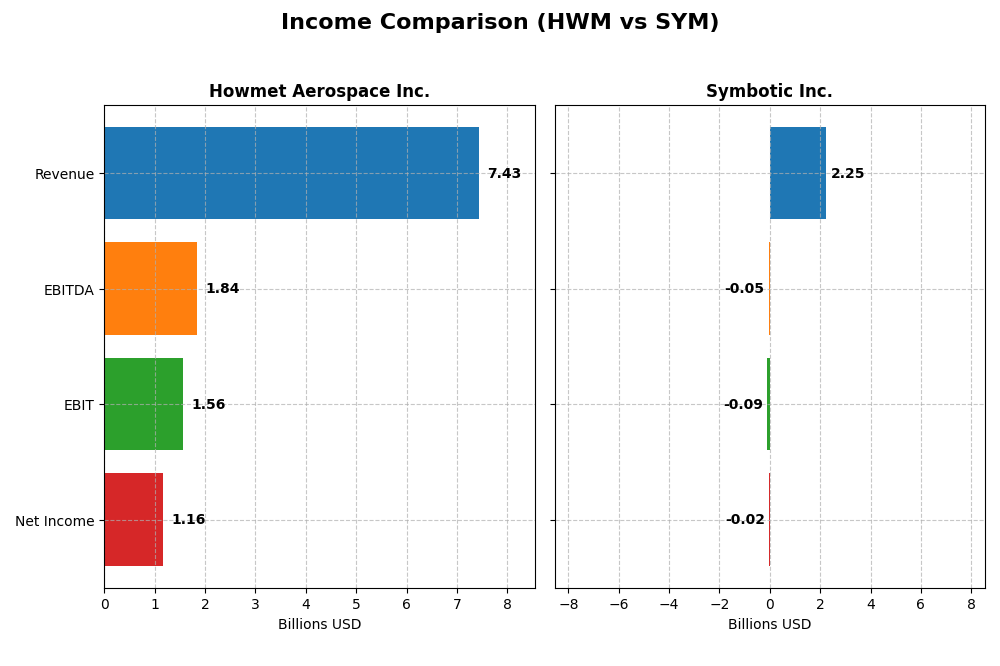
| Revenue | 7.43B (2024) | 2.25B (2025) |
| EBITDA | 1.84B (2024) | -48M (2025) |
| EBIT | 1.57B (2024) | -92M (2025) |
| Net Income | 1.16B (2024) | -17M (2025) |
| EPS | 2.83 (2024) | -0.16 (2025) |
| Fiscal Year | 2024 | 2025 |
Income Statement Interpretations
Howmet Aerospace Inc.
Howmet Aerospace showed consistent revenue growth from 2020 to 2024, reaching $7.43B in 2024, a 41.3% increase over five years. Net income surged by 447%, hitting $1.16B in 2024, with margins improving notably. The 2024 fiscal year saw a solid 11.9% revenue rise and a 34.9% net margin expansion, reflecting robust profitability and margin stability.
Symbotic Inc.
Symbotic’s revenue expanded rapidly from $252M in 2021 to $2.25B in the trailing twelve months ending 2025, marking a 792% growth overall. Despite this, net income remained negative, with a slight improvement to -$17M in 2025. Margins are pressured, showing an unfavorable EBIT margin of -4.1%, and EPS declined sharply in the latest year, signaling ongoing profitability challenges.
Which one has the stronger fundamentals?
Howmet Aerospace exhibits stronger fundamentals with favorable and improving gross, EBIT, and net margins alongside substantial net income growth and profitability. Symbotic, while growing revenue impressively, struggles with losses, negative EBIT margin, and declining EPS, reflecting higher risk despite favorable revenue expansion. Overall, Howmet’s income statement metrics indicate more stable and solid financial health.
Financial Ratios Comparison
The table below presents a side-by-side comparison of key financial ratios for Howmet Aerospace Inc. (HWM) and Symbotic Inc. (SYM) based on their most recent fiscal year data.
| Ratios | Howmet Aerospace Inc. (HWM) 2024 | Symbotic Inc. (SYM) 2025 |
|---|---|---|
| ROE | 25.4% | -7.7% |
| ROIC | 15.5% | -16.6% |
| P/E | 38.6 | -335 |
| P/B | 9.80 | 25.6 |
| Current Ratio | 2.17 | 1.08 |
| Quick Ratio | 0.98 | 0.99 |
| D/E (Debt-to-Equity) | 0.76 | 0.14 |
| Debt-to-Assets | 33.0% | 1.3% |
| Interest Coverage | 9.19 | 0 (no coverage) |
| Asset Turnover | 0.71 | 0.94 |
| Fixed Asset Turnover | 2.92 | 15.9 |
| Payout ratio | 9.4% | 0% (no dividends) |
| Dividend yield | 0.24% | 0% |
Interpretation of the Ratios
Howmet Aerospace Inc.
Howmet Aerospace presents generally strong financial ratios, with favorable net margin at 15.55%, ROE at 25.36%, and ROIC at 15.49%, indicating solid profitability and efficient capital use. However, high PE and PB ratios suggest the stock may be overvalued. The company pays dividends with a low 0.24% yield, reflecting modest shareholder returns and a cautious payout approach.
Symbotic Inc.
Symbotic shows weak profitability metrics, including negative net margin (-0.75%), ROE (-7.65%), and ROIC (-16.63%), reflecting ongoing losses and operational challenges. The firm does not pay dividends, consistent with its reinvestment strategy during a high-growth phase. Favorable low debt ratios indicate conservative leverage, but negative interest coverage signals financial strain.
Which one has the best ratios?
Howmet Aerospace holds a slightly favorable overall ratio profile with strong profitability and liquidity, despite valuation concerns. Symbotic’s ratios are more mixed, with significant profitability weaknesses and financial risks, though it benefits from low leverage. On balance, Howmet Aerospace’s ratios appear more robust compared to Symbotic’s current financial condition.
Strategic Positioning
This section compares the strategic positioning of Howmet Aerospace Inc. and Symbotic Inc., including Market position, Key segments, and exposure to disruption:
Howmet Aerospace Inc.
- Large industrial machinery player with $88B market cap facing moderate competitive pressure.
- Diverse aerospace and transportation segments: Engine Products, Fastening Systems, Structures, and Forged Wheels.
- Operates in traditional aerospace and transportation manufacturing with limited direct exposure to tech disruption.
Symbotic Inc.
- Smaller industrial machinery firm with $42.5B market cap, higher competitive volatility.
- Focused on automation technology for retail and wholesale warehouse efficiency, mainly through The Symbotic System.
- Positioned in robotics and automation, exposed to rapid technological change and innovation risks.
Howmet Aerospace Inc. vs Symbotic Inc. Positioning
Howmet Aerospace exhibits a diversified industrial portfolio across multiple segments, supporting stability but potentially limiting rapid innovation. Symbotic concentrates on warehouse automation technology, offering growth potential but higher risk from fast-paced technological evolution.
Which has the best competitive advantage?
Howmet Aerospace shows a very favorable moat with a growing ROIC above WACC, signaling durable value creation. Symbotic’s declining ROIC and negative moat indicate value destruction and weaker competitive advantage.
Stock Comparison
The stock price movements over the past year reveal strong bullish trends for both Howmet Aerospace Inc. and Symbotic Inc., with notable gains and decelerating acceleration in their upward trajectories. Trading volumes exhibit contrasting buyer dominance patterns.
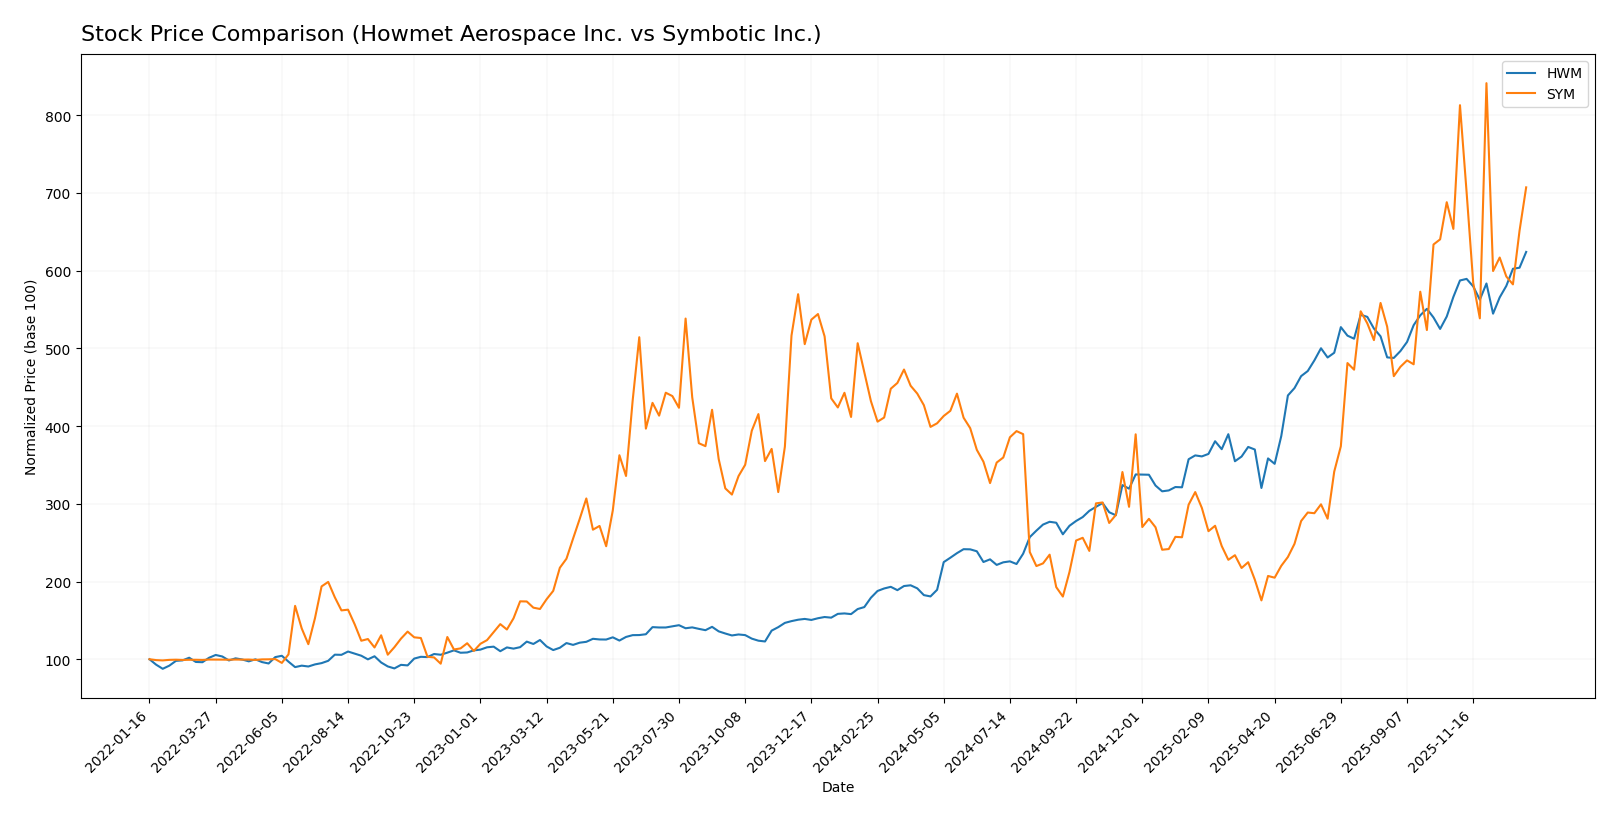
Trend Analysis
Howmet Aerospace Inc. (HWM) showed a robust 248.34% price increase over the past year with a deceleration in trend acceleration. The stock fluctuated between 62.82 and 218.82, with a high volatility indicated by a 47.02 standard deviation.
Symbotic Inc. (SYM) posted a 63.66% price rise over the same period, also with decelerating acceleration. Prices ranged from 17.5 to 83.77, supported by a moderate volatility level at 15.14 standard deviation.
Comparing both, Howmet Aerospace delivered the highest market performance with a significantly stronger price appreciation than Symbotic over the past year.
Target Prices
Analysts provide a clear consensus on target prices for Howmet Aerospace Inc. and Symbotic Inc., reflecting moderate upward potential.
| Company | Target High | Target Low | Consensus |
|---|---|---|---|
| Howmet Aerospace Inc. | 258 | 205 | 231.75 |
| Symbotic Inc. | 83 | 41 | 65.11 |
The consensus target prices for both companies suggest upside from current levels, with Howmet Aerospace’s consensus above its current price of $218.73 and Symbotic’s target consensus below its current price of $70.40, indicating mixed expectations.
Analyst Opinions Comparison
This section compares analysts’ ratings and grades for Howmet Aerospace Inc. (HWM) and Symbotic Inc. (SYM):
Rating Comparison
HWM Rating
- Rating: B, considered very favorable by analysts.
- Discounted Cash Flow Score: 2, moderate valuation.
- Return on Equity Score: 5, very favorable profit generation efficiency.
- Return on Assets Score: 5, very favorable asset utilization.
- Debt To Equity Score: 2, moderate financial risk.
- Overall Score: 3, moderate overall financial standing.
SYM Rating
- Rating: C+, also considered very favorable.
- Discounted Cash Flow Score: 5, very favorable valuation.
- Return on Equity Score: 1, very unfavorable efficiency.
- Return on Assets Score: 1, very unfavorable asset utilization.
- Debt To Equity Score: 3, moderate financial risk.
- Overall Score: 2, moderate overall financial standing.
Which one is the best rated?
Based strictly on the provided data, HWM holds a higher overall rating (B) and scores better in profitability and asset utilization metrics, while SYM has a stronger discounted cash flow score but lower profitability scores. Overall, HWM is better rated.
Scores Comparison
Here is a comparison of the financial scores for Howmet Aerospace Inc. and Symbotic Inc.:
HWM Scores
- Altman Z-Score: 10.43, indicating a safe zone with low bankruptcy risk.
- Piotroski Score: 9, classified as very strong financial health.
SYM Scores
- Altman Z-Score: 13.05, indicating a safe zone with low bankruptcy risk.
- Piotroski Score: 3, classified as very weak financial health.
Which company has the best scores?
Both companies have Altman Z-Scores in the safe zone, suggesting low bankruptcy risk. However, HWM has a very strong Piotroski Score of 9, compared to SYM’s very weak score of 3, indicating HWM’s stronger overall financial health.
Grades Comparison
The following is a comparison of the latest reliable grades provided by established grading companies for both Howmet Aerospace Inc. and Symbotic Inc.:
Howmet Aerospace Inc. Grades
This table summarizes recent grades assigned to Howmet Aerospace by leading financial institutions.
| Grading Company | Action | New Grade | Date |
|---|---|---|---|
| B of A Securities | Maintain | Buy | 2025-11-14 |
| JP Morgan | Maintain | Overweight | 2025-11-10 |
| Goldman Sachs | Maintain | Buy | 2025-11-03 |
| BTIG | Maintain | Buy | 2025-11-03 |
| UBS | Maintain | Neutral | 2025-10-31 |
| RBC Capital | Maintain | Outperform | 2025-10-31 |
| TD Cowen | Maintain | Buy | 2025-10-31 |
| Truist Securities | Maintain | Buy | 2025-10-15 |
| Susquehanna | Maintain | Positive | 2025-10-09 |
| B of A Securities | Maintain | Buy | 2025-08-05 |
Howmet Aerospace’s grades show a strong and consistent Buy and Outperform trend from multiple reputable firms with only one Neutral rating.
Symbotic Inc. Grades
This table presents recent grades assigned to Symbotic by recognized grading firms.
| Grading Company | Action | New Grade | Date |
|---|---|---|---|
| Goldman Sachs | Downgrade | Sell | 2025-12-02 |
| Barclays | Maintain | Underweight | 2025-11-26 |
| Baird | Maintain | Neutral | 2025-11-26 |
| Craig-Hallum | Upgrade | Buy | 2025-11-25 |
| Northland Capital | Maintain | Outperform | 2025-11-25 |
| Needham | Maintain | Buy | 2025-11-25 |
| Cantor Fitzgerald | Maintain | Overweight | 2025-11-25 |
| DA Davidson | Maintain | Neutral | 2025-11-25 |
| Citigroup | Maintain | Buy | 2025-11-25 |
| UBS | Downgrade | Sell | 2025-09-23 |
Symbotic exhibits a mixed pattern with several Buy and Outperform ratings but also notable recent downgrades to Sell and Underweight.
Which company has the best grades?
Howmet Aerospace has received more consistent and predominantly positive grades, mostly Buy and Outperform, whereas Symbotic shows a more divided outlook with both Buy and Sell ratings. This mixed grading for Symbotic may imply higher uncertainty or risk for investors compared to Howmet Aerospace’s steadier profile.
Strengths and Weaknesses
Below is a comparative overview of Howmet Aerospace Inc. (HWM) and Symbotic Inc. (SYM), focusing on key competitive and financial criteria:
| Criterion | Howmet Aerospace Inc. (HWM) | Symbotic Inc. (SYM) |
|---|---|---|
| Diversification | High: Multiple aerospace product segments with over $3.7B in Engine Products, $1.6B in Fastening Systems, and $1.1B in Structure Systems (2024). | Moderate: Concentrated in Systems ($2.1B), Operation Services, and Software Maintenance with smaller revenue streams. |
| Profitability | Strong: Net margin 15.55%, ROIC 15.49%, ROE 25.36%, all favorable. | Weak: Negative net margin (-0.75%), ROIC (-16.63%), ROE (-7.65%), indicating losses. |
| Innovation | Moderate: Stable growth in ROIC (+86% over 2020-2024) signals efficient capital use and competitive edge. | Low: Declining ROIC (-108% over 2021-2025) suggests challenges in sustaining innovation and profitability. |
| Global presence | Established global aerospace supplier with diverse product lines and revenues exceeding $6B in engineered products historically. | Emerging player focused on automation and robotics, less diversified geographically and by product. |
| Market Share | Significant in aerospace components with steady revenue growth across segments. | Niche in automation systems with rapid revenue growth but struggling profitability and market position. |
Key takeaways: Howmet Aerospace exhibits strong diversification, profitability, and a durable competitive advantage with growing returns on invested capital. Conversely, Symbotic faces profitability challenges and declining efficiency, indicating higher risk despite growth potential in its niche market. Investors should weigh Howmet’s stability against Symbotic’s volatility and strategic positioning.
Risk Analysis
Below is a comparative table of key risks for Howmet Aerospace Inc. (HWM) and Symbotic Inc. (SYM) based on the most recent data from 2025-2026:
| Metric | Howmet Aerospace Inc. (HWM) | Symbotic Inc. (SYM) |
|---|---|---|
| Market Risk | Moderate (Beta 1.29) | High (Beta 2.14) |
| Debt level | Moderate (Debt/Equity 0.76) | Low (Debt/Equity 0.14) |
| Regulatory Risk | Moderate (Global aerospace regulations) | Moderate (Tech & automation sector regulations) |
| Operational Risk | Moderate (Complex manufacturing processes) | Moderate-High (Reliance on tech innovation with scaling risks) |
| Environmental Risk | Moderate (Manufacturing emissions, materials) | Low-Moderate (Tech-focused, less material waste) |
| Geopolitical Risk | Moderate (Global supply chains in aerospace) | Low-Moderate (US-based, less exposed internationally) |
The most impactful and likely risks are market volatility for Symbotic due to its higher beta and operational challenges for Howmet given its manufacturing complexity. Howmet’s moderate debt level is manageable, while Symbotic’s low debt reduces financial risk but reflects early-stage growth pressures. Regulatory shifts in aerospace and automation sectors remain important to monitor.
Which Stock to Choose?
Howmet Aerospace Inc. (HWM) shows a favorable income evolution with revenue growth of 11.9% in 2024 and a strong net margin of 15.55%. Its financial ratios indicate solid profitability (ROE 25.36%) and moderate debt levels, supported by a very favorable rating and a durable competitive moat with ROIC exceeding WACC.
Symbotic Inc. (SYM) presents a mixed income profile, with favorable revenue growth of 25.65% but negative profitability metrics, including a net margin of -0.75% and declining ROIC. Its financial ratios reflect financial challenges despite low debt, and the company holds a very unfavorable moat rating but a very favorable overall rating.
Investors focused on stability and long-term value creation might find Howmet Aerospace’s robust profitability and strong moat more appealing, while those with a tolerance for risk and interest in growth potential could view Symbotic’s revenue expansion and favorable rating as suggestive of future opportunity, despite current profitability concerns.
Disclaimer: Investment carries a risk of loss of initial capital. The past performance is not a reliable indicator of future results. Be sure to understand risks before making an investment decision.
Go Further
I encourage you to read the complete analyses of Howmet Aerospace Inc. and Symbotic Inc. to enhance your investment decisions: