Home > Comparison > Industrials > HWM vs ROP
The strategic rivalry between Howmet Aerospace Inc. and Roper Technologies, Inc. shapes the Industrials sector’s innovation landscape. Howmet Aerospace operates as a capital-intensive machinery manufacturer serving aerospace and transportation, while Roper Technologies excels as a high-margin software and engineered products provider. This analysis explores their divergent operational models in a race for industrial leadership. I will determine which trajectory delivers superior risk-adjusted returns for a diversified portfolio.
Table of contents
Companies Overview
Howmet Aerospace and Roper Technologies hold pivotal roles in the industrial machinery sector, shaping diverse market segments.
Howmet Aerospace Inc.: Advanced Engineered Solutions Leader
Howmet Aerospace dominates aerospace and transportation with engineered components like airfoils, fasteners, and forged wheels. Its revenue hinges on four segments: Engine Products, Fastening Systems, Engineered Structures, and Forged Wheels. In 2026, it sharpens focus on aerospace innovation and heavy-duty transport solutions, leveraging a global footprint across key industrial economies.
Roper Technologies, Inc.: Software-Driven Industrial Innovator
Roper Technologies excels in software and engineered products spanning diagnostics, management, and precision instruments. Its core revenue derives from cloud-based analytics, healthcare software, and specialized equipment. The 2026 strategy emphasizes expanding cloud solutions and data analytics, targeting efficiency improvements across insurance, healthcare, and utility sectors with a diversified product portfolio.
Strategic Collision: Similarities & Divergences
Both companies operate in industrial machinery but differ fundamentally: Howmet pursues a manufacturing-centric, physical components approach while Roper invests heavily in software and data-driven solutions. Their competitive battleground centers on industrial innovation—hardware versus software integration. This divergence crafts distinct investment profiles: Howmet appeals through tangible industrial assets; Roper attracts with scalable, high-margin technology offerings.
Income Statement Comparison
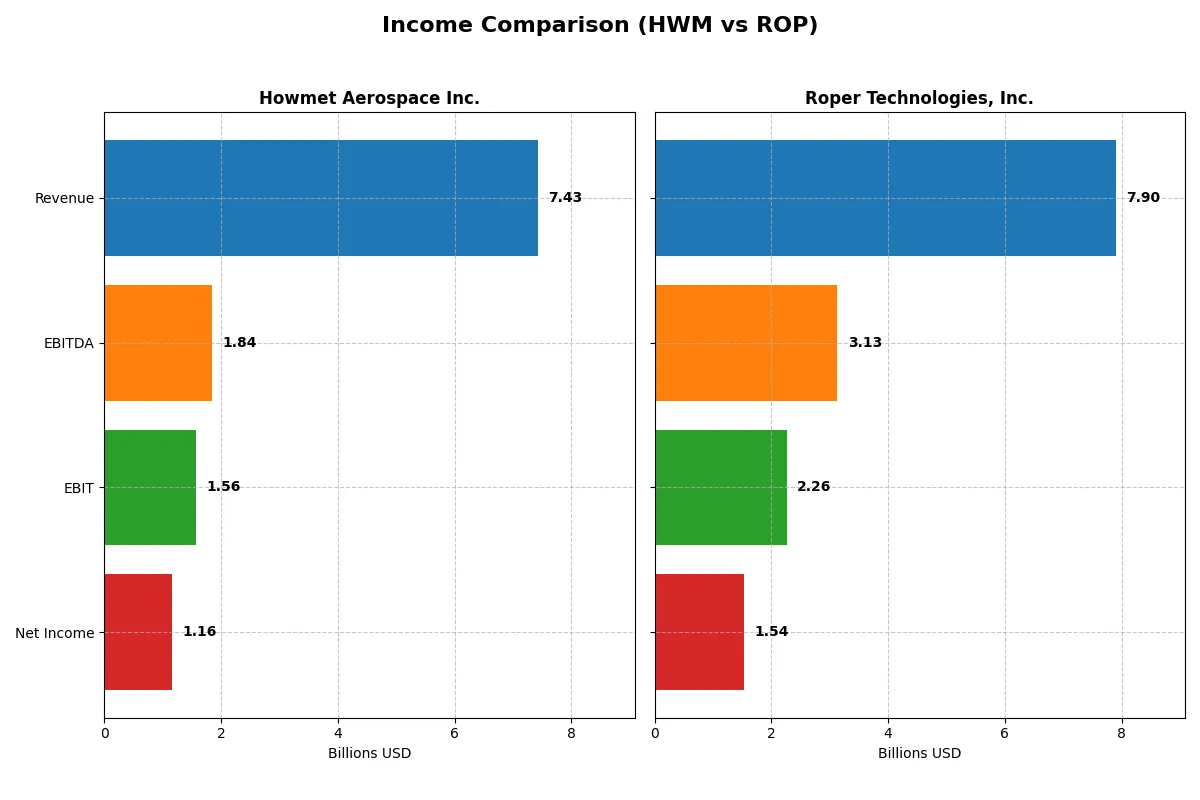
This data dissects the core profitability and scalability of both corporate engines to reveal who dominates the bottom line:
| Metric | Howmet Aerospace Inc. (HWM) | Roper Technologies, Inc. (ROP) |
|---|---|---|
| Revenue | 7.43B | 7.90B |
| Cost of Revenue | 5.38B | 2.43B |
| Operating Expenses | 380M | 3.24B |
| Gross Profit | 2.05B | 5.47B |
| EBITDA | 1.84B | 3.13B |
| EBIT | 1.57B | 2.26B |
| Interest Expense | 182M | 325M |
| Net Income | 1.16B | 1.54B |
| EPS | 2.83 | 14.31 |
| Fiscal Year | 2024 | 2025 |
Income Statement Analysis: The Bottom-Line Duel
This income statement comparison reveals which company leverages its revenues into profits more efficiently and sustainably.
Howmet Aerospace Inc. Analysis
Howmet Aerospace’s revenue grew steadily from 5.3B in 2020 to 7.4B in 2024, with net income surging from 209M to 1.15B. Gross margin improved to 27.6%, and net margin expanded to 15.6%, highlighting robust margin health. Its 2024 performance shows strong momentum with a 53.5% EPS growth, signaling effective cost control and rising profitability.
Roper Technologies, Inc. Analysis
Roper Technologies scaled revenue from 4.8B in 2021 to 7.9B in 2025, with net income climbing from 1.1B to 1.54B. It boasts a superior gross margin of 69.2% and a net margin of 19.4%, reflecting high operational leverage. However, recent net margin dipped 11.7%, and EBIT growth slowed to 1.6%, indicating margin pressure despite revenue gains.
Margin Efficiency vs. Revenue Growth Power
Howmet Aerospace demonstrates superior margin expansion and rapid profit growth, while Roper leads on top-line scale and gross profitability. Howmet’s accelerating net margin and EPS growth mark it as the more efficient profit generator. Investors seeking dynamic margin improvement may find Howmet’s profile more compelling despite Roper’s larger revenue base.
Financial Ratios Comparison
These vital ratios act as a diagnostic tool to expose the underlying fiscal health, valuation premiums, and capital efficiency of the companies compared below:
| Ratios | Howmet Aerospace Inc. (HWM) | Roper Technologies, Inc. (ROP) |
|---|---|---|
| ROE | 25.4% | 8.2% |
| ROIC | 15.5% | 5.5% |
| P/E | 38.6 | 35.9 |
| P/B | 9.8 | 3.0 |
| Current Ratio | 2.17 | 0.40 |
| Quick Ratio | 0.98 | 0.37 |
| D/E (Debt-to-Equity) | 0.76 | 0.41 |
| Debt-to-Assets | 33.0% | 24.5% |
| Interest Coverage | 9.19 | 7.70 |
| Asset Turnover | 0.71 | 0.22 |
| Fixed Asset Turnover | 2.92 | 47.0 |
| Payout Ratio | 9.4% | 20.8% |
| Dividend Yield | 0.24% | 0.58% |
| Fiscal Year | 2024 | 2024 |
Efficiency & Valuation Duel: The Vital Signs
Financial ratios act as a company’s DNA, unveiling hidden risks and operational excellence that shape investment decisions.
Howmet Aerospace Inc.
Howmet Aerospace shows strong profitability with a 25.36% ROE and a solid 15.55% net margin, signaling operational efficiency. Its P/E of 38.63 suggests the stock is stretched compared to market norms. Shareholders receive a modest 0.24% dividend yield, indicating a focus on reinvesting earnings for growth rather than high payouts.
Roper Technologies, Inc.
Roper posts an impressive 19.44% net margin but reveals zero ROE and ROIC data, clouding profitability clarity. Its P/E of 31.06 is elevated, reflecting an expensive valuation. The 0.74% dividend yield is low but higher than Howmet’s, suggesting some income return despite mixed leverage and liquidity metrics.
Valuation Stretch vs. Profitability Clarity
Howmet Aerospace balances robust profitability with a stretched valuation and low dividend, emphasizing growth. Roper’s valuation is high but lacks key return metrics, raising uncertainty. Investors favoring operational transparency may lean toward Howmet, while those accepting some risk for income might consider Roper’s profile.
Which one offers the Superior Shareholder Reward?
I compare Howmet Aerospace Inc. (HWM) and Roper Technologies, Inc. (ROP) by examining their dividend yields, payout ratios, and buyback intensity. HWM yields a modest 0.24% with a payout ratio around 9%, supported by steady free cash flow coverage near 75%. Its buybacks appear restrained but consistent, preserving capital for growth. ROP offers a stronger 0.74% yield and a payout ratio near 23%, backed by robust free cash flow conversion above 95%. ROP’s aggressive buybacks amplify total returns, underpinned by high operating margins and cash flow per share peaking above $23. Historically, ROP’s distribution model balances income and capital return better, making its shareholder reward more sustainable and attractive in 2026. I conclude Roper Technologies delivers superior total shareholder reward compared to Howmet Aerospace.
Comparative Score Analysis: The Strategic Profile
The radar chart reveals the fundamental DNA and trade-offs of Howmet Aerospace Inc. and Roper Technologies, Inc.:
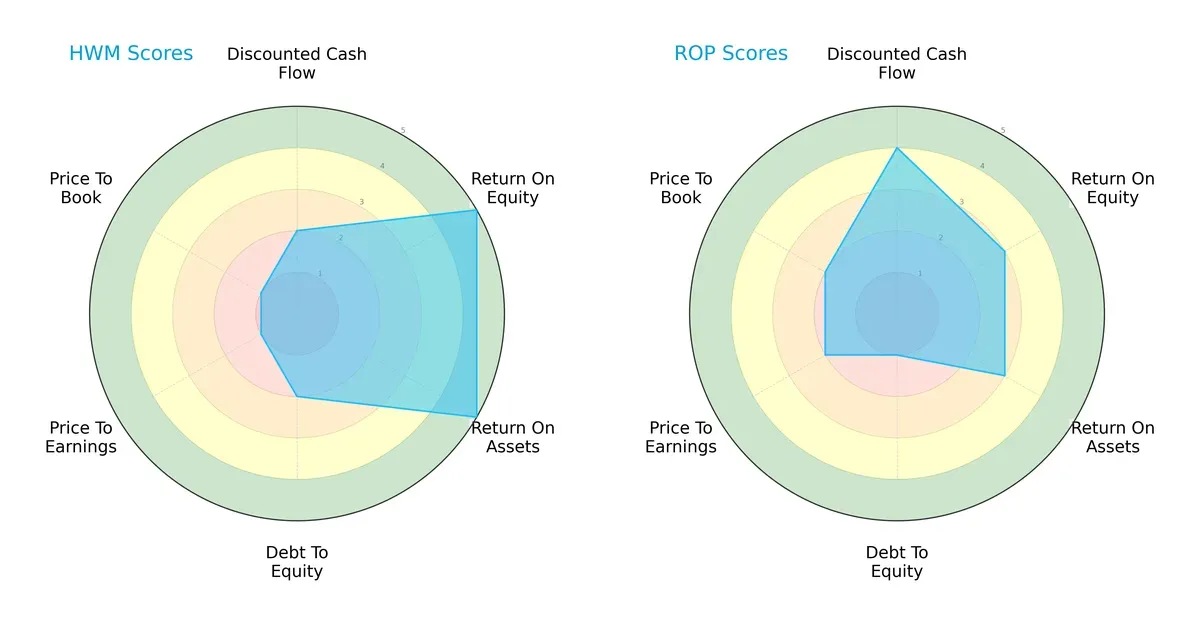
Howmet Aerospace excels in profitability with top ROE and ROA scores (5 each), but suffers valuation challenges, scoring very low on P/E and P/B (1 each). Roper shows a better discounted cash flow score (4 vs. 2), indicating stronger future cash flow prospects, but carries higher financial risk with a weaker debt-to-equity score (1 vs. 2). Howmet presents a more balanced profitability profile, while Roper leverages cash flow strength despite financial leverage concerns.
Bankruptcy Risk: Solvency Showdown
Howmet Aerospace’s Altman Z-Score is 10.43, placing it firmly in the safe zone. Roper’s score of 2.70 lies in the grey zone:
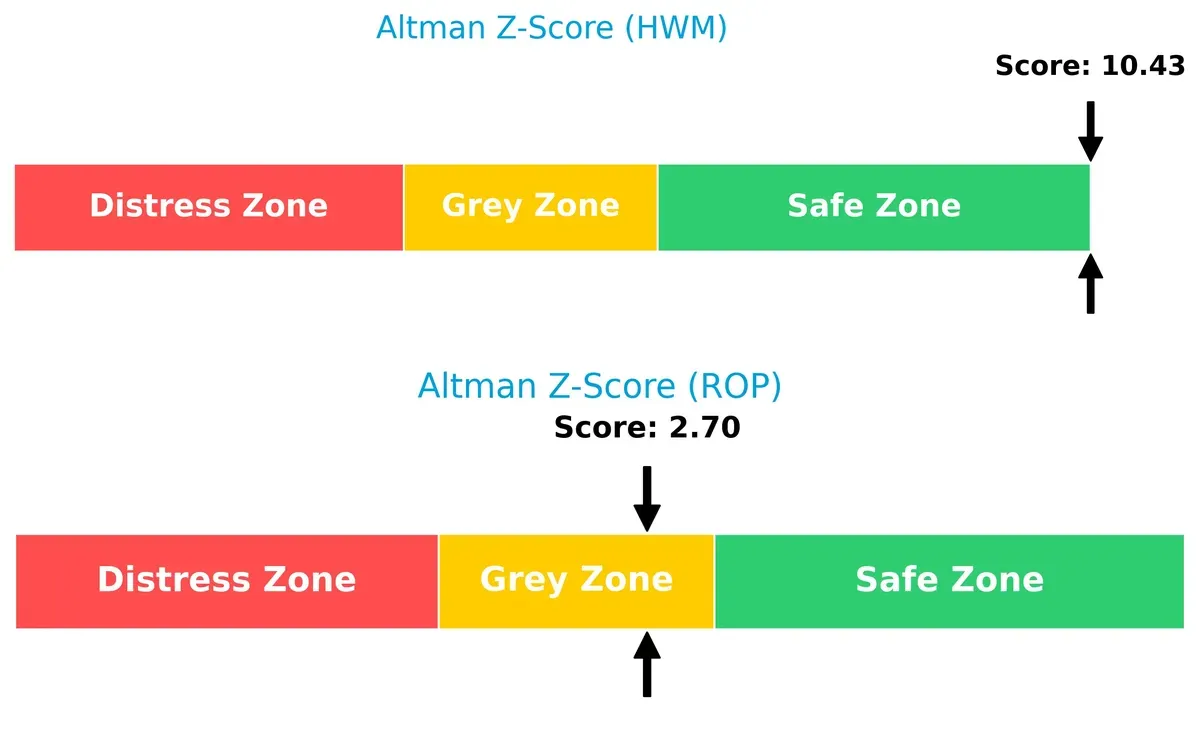
This significant delta signals Howmet’s superior resilience against bankruptcy risk in this economic cycle. Roper’s moderate score warns investors to monitor financial stability closely.
Financial Health: Quality of Operations
Both companies score a perfect 9 on the Piotroski F-Score, signaling very strong operational health:
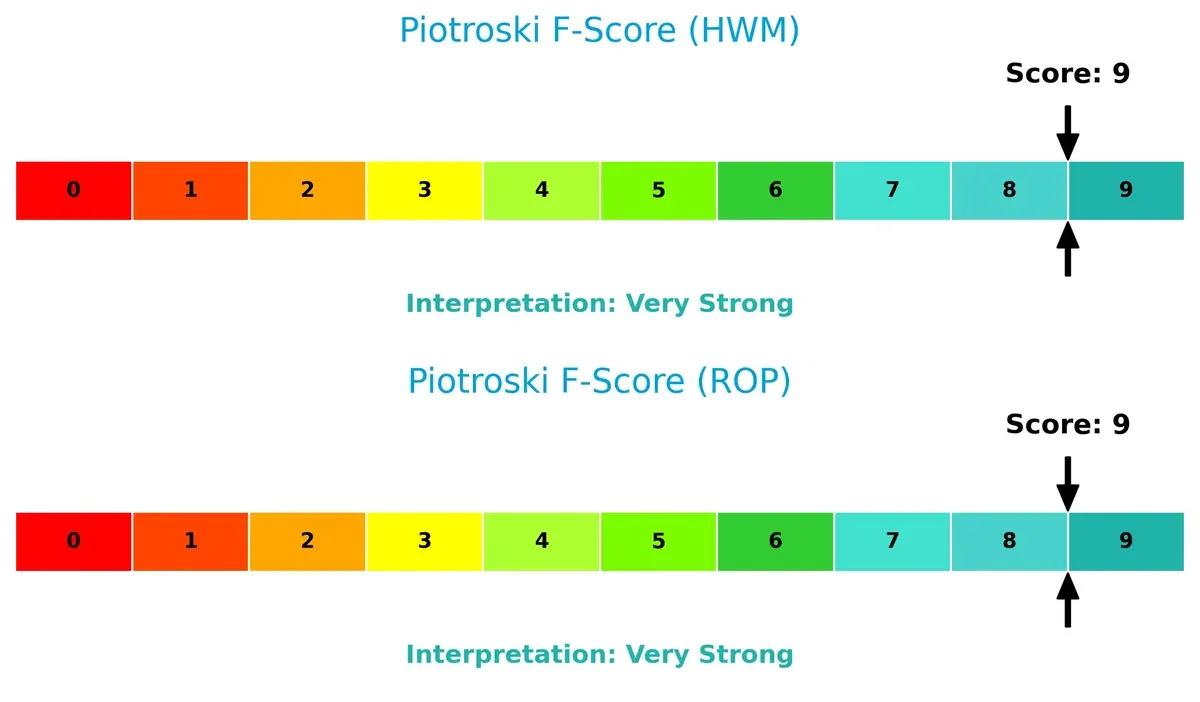
This parity suggests robust internal financial quality. Neither firm shows red flags in profitability, leverage, or liquidity metrics, reinforcing confidence in their core business operations.
How are the two companies positioned?
This section dissects the operational DNA of HWM and ROP by comparing their revenue distribution and internal dynamics. The goal is to confront their economic moats to identify which model ensures the most resilient competitive advantage today.
Revenue Segmentation: The Strategic Mix
The following visual comparison dissects how Howmet Aerospace Inc. and Roper Technologies, Inc. diversify their income streams and where their primary sector bets lie:
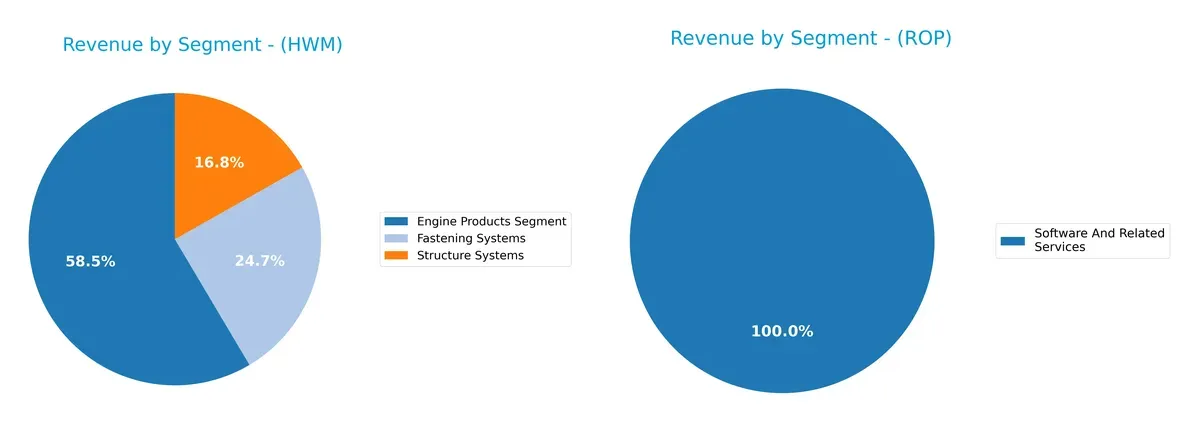
Howmet Aerospace anchors its revenue in Engine Products at $3.74B, complemented by Fastening Systems and Structure Systems, showing moderate diversification. Roper Technologies pivots predominantly on Software and Related Services with $10.74B, dwarfing other segments, indicating a strong focus on software ecosystems. Howmet’s mix limits concentration risk but relies on aerospace cycles, while Roper’s software dominance suggests high-margin stability but potential tech sector cyclicality.
Strengths and Weaknesses Comparison
This table compares the Strengths and Weaknesses of Howmet Aerospace Inc. (HWM) and Roper Technologies, Inc. (ROP):
HWM Strengths
- Diverse aerospace product segments including Engine, Fastening, and Structure Systems
- Favorable net margin (15.55%) and ROE (25.36%) indicating strong profitability
- Solid current ratio (2.17) signaling good short-term liquidity
- Favorable interest coverage (8.6) supporting debt servicing
ROP Strengths
- Large Software and Related Services revenue (10.7B in 2024) showing market focus
- Favorable net margin (19.44%) with strong profitability on sales
- Favorable debt ratios including debt-to-assets and debt/equity indicate conservative leverage
- Adequate interest coverage (6.96) ensuring interest obligations met
HWM Weaknesses
- High valuation metrics with unfavorable P/E (38.63) and P/B (9.8) may imply overpricing
- Neutral to unfavorable quick ratio (0.98) and debt ratios suggest moderate financial risk
- Low dividend yield (0.24%) might deter income-focused investors
- Asset turnover ratios neutral, indicating average operational efficiency
ROP Weaknesses
- Zero reported ROE and ROIC indicate weak capital returns
- Unavailable WACC limits cost of capital assessment
- Unfavorable liquidity ratios (current and quick ratio at 0) raise red flags on short-term financial health
- High proportion of unfavorable ratios (57.14%) reflects overall financial weakness
Overall, HWM shows strength in diversified aerospace operations and solid profitability metrics but faces valuation and liquidity concerns. ROP benefits from strong software market presence and conservative leverage but suffers from critical profitability and liquidity weaknesses, which could impact strategic flexibility.
The Moat Duel: Analyzing Competitive Defensibility
A structural moat is the only reliable barrier protecting long-term profits from relentless competitive erosion in industrial sectors:
Howmet Aerospace Inc. (HWM): Engineering Precision with a Durable Moat
Howmet’s moat stems from high switching costs and specialized aerospace engineering. Its ROIC exceeds WACC by 5.8%, showing efficient capital use and margin stability. New aerospace markets in 2026 could deepen this lead.
Roper Technologies, Inc. (ROP): Diversification with Innovation Challenges
ROP relies on intangible assets and software integration, contrasting Howmet’s manufacturing focus. Its ROIC trend is declining, signaling weakening capital efficiency. Expansion into cloud-based analytics offers upside but risks margin pressure.
Moat Battle: Engineering Rigor vs. Software Adaptability
Howmet Aerospace boasts a wider, more durable moat with growing ROIC and strong margin gains. Roper’s diverse portfolio faces margin headwinds, making Howmet better positioned to defend market share in 2026.
Which stock offers better returns?
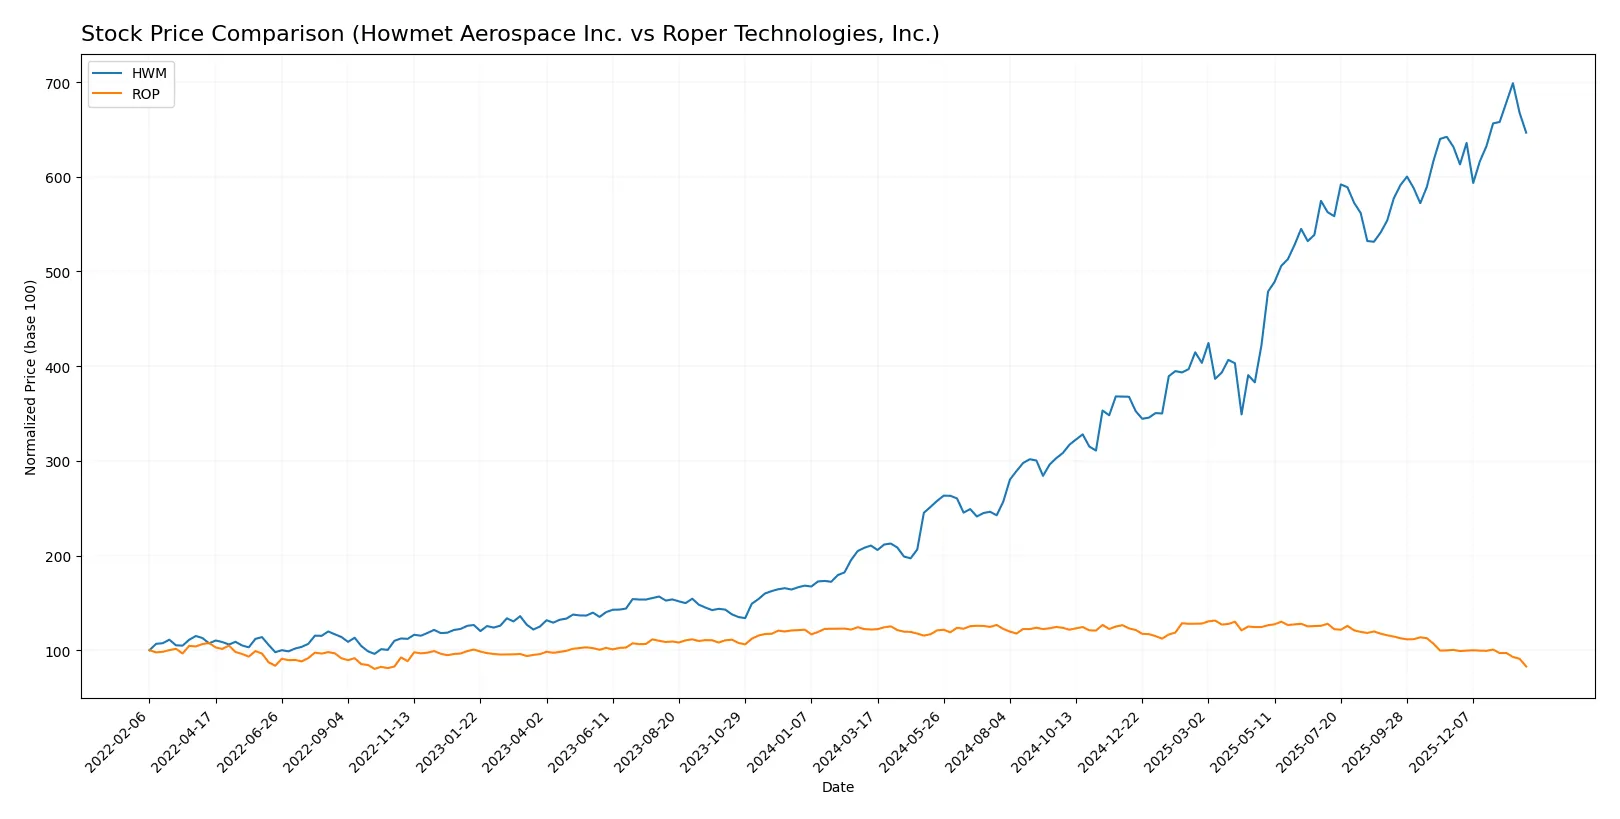
The past year reveals stark contrasts in price dynamics between Howmet Aerospace Inc. and Roper Technologies, Inc., highlighting divergent market sentiment and trading momentum.
Trend Comparison
Howmet Aerospace’s stock surged 207.17% over the past 12 months, displaying a strong bullish trend with accelerating gains and notable volatility. The price ranged from a low of 63.41 to a high of 224.89.
Roper Technologies’ stock declined 32.0% in the same period, reflecting a bearish trend with decelerating losses. Its price fluctuated between 371.23 and 588.38, showing significant downside pressure.
Howmet Aerospace clearly outperformed Roper Technologies, delivering robust market returns while Roper’s shares faced sustained downward momentum.
Target Prices
Analysts present a solid target price consensus for Howmet Aerospace Inc. and Roper Technologies, Inc.
| Company | Target Low | Target High | Consensus |
|---|---|---|---|
| Howmet Aerospace Inc. | 205 | 258 | 234.25 |
| Roper Technologies, Inc. | 365 | 575 | 475.5 |
The consensus targets exceed current prices by 12.5% for Howmet Aerospace and nearly 28% for Roper Technologies, indicating moderate to strong upside potential.

Don’t Let Luck Decide Your Entry Point
Optimize your entry points with our advanced ProRealTime indicators. You’ll get efficient buy signals with precise price targets for maximum performance. Start outperforming now!
How do institutions grade them?
Here is a summary of recent institutional grades for Howmet Aerospace Inc. and Roper Technologies, Inc.:
Howmet Aerospace Inc. Grades
The following table lists recent grades from major financial institutions for Howmet Aerospace Inc.:
| Grading Company | Action | New Grade | Date |
|---|---|---|---|
| Citigroup | Maintain | Buy | 2026-01-13 |
| B of A Securities | Maintain | Buy | 2025-11-14 |
| JP Morgan | Maintain | Overweight | 2025-11-10 |
| Goldman Sachs | Maintain | Buy | 2025-11-03 |
| BTIG | Maintain | Buy | 2025-11-03 |
| RBC Capital | Maintain | Outperform | 2025-10-31 |
| TD Cowen | Maintain | Buy | 2025-10-31 |
| UBS | Maintain | Neutral | 2025-10-31 |
| Truist Securities | Maintain | Buy | 2025-10-15 |
| Susquehanna | Maintain | Positive | 2025-10-09 |
Roper Technologies, Inc. Grades
This table presents recent ratings from well-known analysts for Roper Technologies, Inc.:
| Grading Company | Action | New Grade | Date |
|---|---|---|---|
| Goldman Sachs | Maintain | Neutral | 2026-01-29 |
| Argus Research | Downgrade | Hold | 2026-01-28 |
| Truist Securities | Maintain | Buy | 2026-01-28 |
| Mizuho | Maintain | Underperform | 2026-01-28 |
| Oppenheimer | Downgrade | Perform | 2026-01-28 |
| RBC Capital | Maintain | Sector Perform | 2026-01-28 |
| Barclays | Maintain | Underweight | 2026-01-28 |
| Stifel | Downgrade | Hold | 2026-01-28 |
| Citigroup | Maintain | Buy | 2026-01-28 |
| JP Morgan | Maintain | Underweight | 2026-01-28 |
Which company has the best grades?
Howmet Aerospace Inc. holds a stronger consensus with predominantly buy and outperform ratings. Roper Technologies, Inc. has more mixed grades, including downgrades and underperform classifications. Investors may view Howmet’s consistent positive outlook as a sign of greater institutional confidence.
Risks specific to each company
The following categories identify critical pressure points and systemic threats facing both firms in the 2026 market environment:
1. Market & Competition
Howmet Aerospace Inc.
- Faces intense competition in aerospace and industrial machinery sectors, requiring innovation and cost control.
Roper Technologies, Inc.
- Operates in diversified industrial software and equipment markets, facing competition from tech-driven disruptors.
2. Capital Structure & Debt
Howmet Aerospace Inc.
- Maintains moderate leverage with debt-to-equity of 0.76 and interest coverage of 8.6, indicating manageable debt risk.
Roper Technologies, Inc.
- Shows very low or unavailable debt data but rated unfavorable on debt-to-equity, suggesting potential financial risk or data gaps.
3. Stock Volatility
Howmet Aerospace Inc.
- Beta of 1.29 indicates higher volatility than the market, exposing investors to greater price swings.
Roper Technologies, Inc.
- Beta of 0.94 suggests lower volatility, offering relatively stable stock price movements.
4. Regulatory & Legal
Howmet Aerospace Inc.
- Aerospace industry faces strict regulatory compliance and export controls, increasing legal risk.
Roper Technologies, Inc.
- Software and industrial products subject to data privacy, cybersecurity, and compliance regulations, posing operational risks.
5. Supply Chain & Operations
Howmet Aerospace Inc.
- Global manufacturing footprint exposes it to supply chain disruptions and raw material price volatility.
Roper Technologies, Inc.
- Software-centric operations reduce physical supply chain risks but rely on tech infrastructure stability.
6. ESG & Climate Transition
Howmet Aerospace Inc.
- Pressure to reduce carbon footprint in manufacturing and aerospace sectors amid rising environmental regulations.
Roper Technologies, Inc.
- Faces ESG demands in software sustainability and governance, with lower direct emissions but reputational risks.
7. Geopolitical Exposure
Howmet Aerospace Inc.
- Operations in multiple countries including China and Europe create exposure to trade tensions and geopolitical volatility.
Roper Technologies, Inc.
- Primarily US-based but global client base exposes it to international regulatory and geopolitical uncertainties.
Which company shows a better risk-adjusted profile?
Howmet Aerospace’s key risk lies in market competition and geopolitical exposure, given its global manufacturing and aerospace focus. Roper faces greater capital structure and operational risks, with data indicating financial leverage concerns and weaker liquidity ratios. Howmet’s Altman Z-Score of 10.4 places it safely above distress levels, while Roper’s 2.7 signals moderate financial risk. Considering these factors, Howmet Aerospace presents a stronger risk-adjusted profile despite its higher stock volatility. The recent clarity on Roper’s unfavorable liquidity metrics accentuates caution.
Final Verdict: Which stock to choose?
Howmet Aerospace Inc. (HWM) shines as a cash-generating powerhouse with a durable competitive advantage. Its growing ROIC well above WACC signals efficient capital use and value creation. The point of vigilance is its relatively high valuation multiples, which could pressure returns. HWM suits portfolios targeting aggressive growth with a tolerance for premium pricing.
Roper Technologies, Inc. (ROP) impresses with a strategic moat rooted in recurring revenue streams and strong income quality. It offers better capital structure safety than HWM but shows a declining ROIC trend, which raises questions about future profitability. ROP fits well within growth-at-a-reasonable-price (GARP) portfolios seeking stability over rapid expansion.
If you prioritize dynamic value creation and expanding profitability, Howmet Aerospace outshines due to its strong economic moat and accelerating price momentum. However, if you seek a more stable income profile with a defensible recurring revenue base, Roper offers better stability despite its recent deceleration. Both present distinct scenarios depending on your risk appetite and investment horizon.
Disclaimer: Investment carries a risk of loss of initial capital. The past performance is not a reliable indicator of future results. Be sure to understand risks before making an investment decision.
Go Further
I encourage you to read the complete analyses of Howmet Aerospace Inc. and Roper Technologies, Inc. to enhance your investment decisions: