Howmet Aerospace Inc. (HWM) and Rockwell Automation, Inc. (ROK) are two prominent players in the industrial machinery sector, each driving innovation in their respective fields. Howmet focuses on advanced engineered solutions for aerospace and transportation, while Rockwell leads in industrial automation and digital transformation. Their overlapping industrial focus and commitment to innovation make this comparison essential. In this article, I will help you decide which company holds the most promise for your investment portfolio.

Table of contents
Companies Overview
I will begin the comparison between Howmet Aerospace Inc. and Rockwell Automation, Inc. by providing an overview of these two companies and their main differences.
Howmet Aerospace Inc. Overview
Howmet Aerospace Inc. specializes in advanced engineered solutions for aerospace and transportation industries globally. Operating through four segments—Engine Products, Fastening Systems, Engineered Structures, and Forged Wheels—it provides components such as airfoils, fastening systems, titanium mill products, and forged aluminum wheels. Founded in 1888 and headquartered in Pittsburgh, PA, Howmet has a market cap of 88B USD and employs approximately 24K people.
Rockwell Automation, Inc. Overview
Rockwell Automation, Inc. focuses on industrial automation and digital transformation solutions across various sectors, including automotive, semiconductor, and renewable energy. It operates in three segments: Intelligent Devices, Software & Control, and Lifecycle Services, offering hardware, software, and consulting services. Founded in 1903 and based in Milwaukee, WI, Rockwell has a market cap of 46B USD and a workforce of about 27K employees.
Key similarities and differences
Both companies operate in the industrial machinery sector and have global reach with extensive employee bases. However, Howmet Aerospace concentrates on engineered components primarily for aerospace and transportation, while Rockwell Automation provides automation hardware, software, and consulting services across diverse industries. Their business models differ, with Howmet focusing on manufacturing physical components and Rockwell emphasizing integrated automation solutions and lifecycle services.
Income Statement Comparison
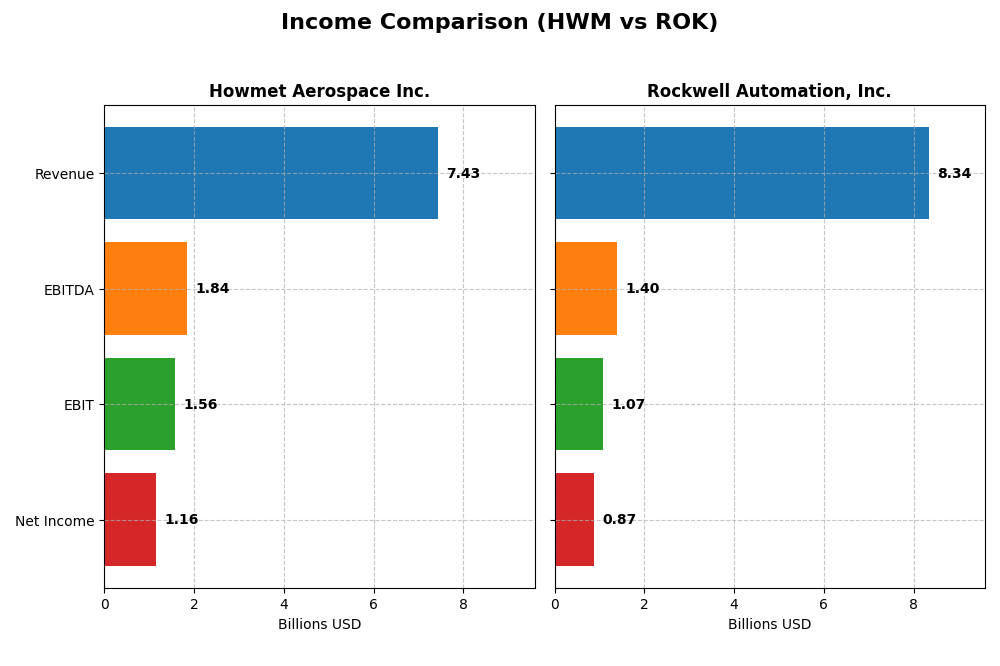
The table below compares key income statement metrics for Howmet Aerospace Inc. and Rockwell Automation, Inc. based on their most recent fiscal year data.
| Metric | Howmet Aerospace Inc. (HWM) | Rockwell Automation, Inc. (ROK) |
|---|---|---|
| Market Cap | 88B | 46B |
| Revenue | 7.43B | 8.34B |
| EBITDA | 1.84B | 1.40B |
| EBIT | 1.56B | 1.07B |
| Net Income | 1.16B | 0.87B |
| EPS | 2.83 | 7.69 |
| Fiscal Year | 2024 | 2025 |
Income Statement Interpretations
Howmet Aerospace Inc.
Howmet Aerospace demonstrated a robust upward trend in revenue, growing from 5.26B in 2020 to 7.43B in 2024, with net income surging from 209M to 1.16B in the same period. Margins consistently improved, highlighted by a favorable gross margin of 27.62% and net margin of 15.55% in 2024. The most recent year showed accelerated growth, with net income up 35% and EPS up 54%, signaling strong margin expansion and operational efficiency.
Rockwell Automation, Inc.
Rockwell Automation’s revenue increased from 7.0B in 2021 to 8.34B in 2025, yet net income declined from 1.36B to 869M over the same span. Despite a healthy gross margin of 48.14% in 2025, the net margin fell to 10.42%. The latest year indicated slowing revenue growth of less than 1% and declines in EBIT (-14%) and EPS (-7%), reflecting margin compression and deteriorating profitability.
Which one has the stronger fundamentals?
Howmet Aerospace exhibits stronger fundamentals with consistent revenue and net income growth, favorable margin trends, and notable improvements in profitability metrics. Conversely, Rockwell Automation faces margin erosion and net income decline despite revenue growth, leading to an unfavorable overall income statement evaluation. This contrast highlights Howmet’s more favorable operational and financial performance over the evaluation periods.
Financial Ratios Comparison
The table below presents a side-by-side comparison of key financial ratios for Howmet Aerospace Inc. (HWM) and Rockwell Automation, Inc. (ROK), based on their most recent fiscal year data.
| Ratios | Howmet Aerospace Inc. (HWM) 2024 | Rockwell Automation, Inc. (ROK) 2025 |
|---|---|---|
| ROE | 25.4% | 23.8% |
| ROIC | 15.5% | 13.7% |
| P/E | 38.6 | 45.3 |
| P/B | 9.8 | 10.8 |
| Current Ratio | 2.17 | 1.14 |
| Quick Ratio | 0.98 | 0.77 |
| D/E (Debt-to-Equity) | 0.76 | 1.00 |
| Debt-to-Assets | 33.0% | 32.5% |
| Interest Coverage | 9.19 | 9.12 |
| Asset Turnover | 0.71 | 0.74 |
| Fixed Asset Turnover | 2.92 | 6.95 |
| Payout Ratio | 9.4% | 68.0% |
| Dividend Yield | 0.24% | 1.50% |
Interpretation of the Ratios
Howmet Aerospace Inc.
Howmet Aerospace exhibits mostly favorable profitability ratios, with a strong return on equity (25.36%) and return on invested capital (15.49%), indicating efficient capital use. Liquidity is solid, with a current ratio of 2.17, but valuation metrics like P/E (38.63) and P/B (9.8) appear high. The dividend yield is low at 0.24%, reflecting modest shareholder returns.
Rockwell Automation, Inc.
Rockwell Automation shows favorable profitability with a return on equity of 23.78% and a solid net margin of 10.42%. Liquidity ratios are weaker; current ratio stands at 1.14 and quick ratio at 0.77, suggesting tighter short-term liquidity. Valuation multiples such as P/E (45.33) and P/B (10.78) are elevated. Dividend yield is moderate at 1.5%, indicating steady income for shareholders.
Which one has the best ratios?
Both companies present a slightly favorable overall ratio profile, balancing strong profitability against high valuation multiples. Howmet Aerospace’s stronger liquidity and higher returns contrast with Rockwell’s better fixed asset turnover and dividend yield. Each shows areas of strength and concern, making their ratio sets comparably balanced but distinct in focus.
Strategic Positioning
This section compares the strategic positioning of Howmet Aerospace Inc. and Rockwell Automation, Inc. across Market position, Key segments, and Exposure to technological disruption:
Howmet Aerospace Inc.
- Large market cap of 88B in industrial machinery; faces typical sector competition.
- Diverse aerospace and transportation segments: Engine Products, Fastening Systems, Engineered Structures, Forged Wheels.
- Exposure primarily in aerospace manufacturing; limited direct exposure to digital disruption.
Rockwell Automation, Inc.
- Mid-sized market cap of 46B in industrial machinery; operates amid strong competition.
- Focused on industrial automation: Intelligent Devices, Software & Control, Lifecycle Services.
- Significant exposure to digital transformation and industrial automation technologies.
Howmet Aerospace Inc. vs Rockwell Automation, Inc. Positioning
Howmet Aerospace operates a diversified portfolio across aerospace and transportation components, offering broad industrial exposure. Rockwell Automation concentrates on automation and software solutions, emphasizing digital transformation. Both approaches present distinct strategic focuses with differing market scopes and innovation exposures.
Which has the best competitive advantage?
Both companies show very favorable economic moats with growing ROIC exceeding WACC, indicating durable competitive advantages. Howmet Aerospace’s higher ROIC spread and growth suggest a slightly stronger value creation and capital efficiency over Rockwell Automation.
Stock Comparison
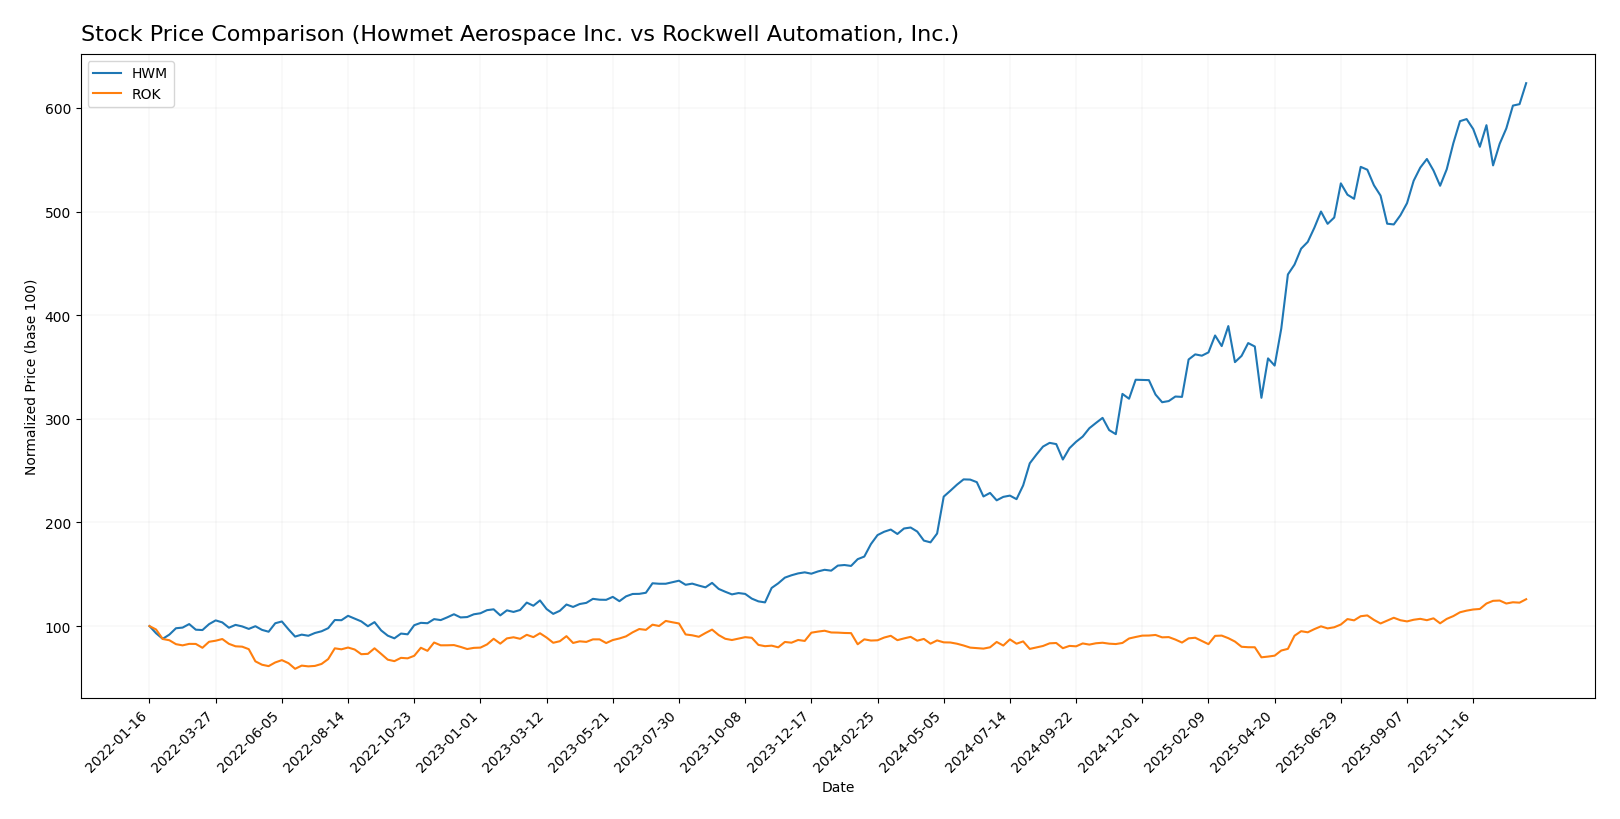
The past year saw significant bullish trends for both Howmet Aerospace Inc. (HWM) and Rockwell Automation, Inc. (ROK), with HWM showing a decelerating rise and ROK an accelerating upward movement in stock prices.
Trend Analysis
Howmet Aerospace Inc. (HWM) experienced a strong bullish trend over the past 12 months with a 248.31% price increase, though the trend shows deceleration. The stock ranged between 62.82 and 218.81 with a high volatility of 47.02.
Rockwell Automation, Inc. (ROK) also displayed a bullish trend with a 46.34% gain over the year, accompanied by acceleration in price growth. The stock’s price fluctuated between 227.11 and 409.36, with volatility measured at 44.55.
Comparing the two, HWM delivered the highest market performance with a substantially larger price increase over the last year, despite a slowing momentum relative to ROK’s accelerating trend.
Target Prices
The current analyst consensus shows promising upside potential for both Howmet Aerospace Inc. and Rockwell Automation, Inc.
| Company | Target High | Target Low | Consensus |
|---|---|---|---|
| Howmet Aerospace Inc. | 258 | 205 | 231.75 |
| Rockwell Automation, Inc. | 470 | 380 | 421.57 |
Analysts expect Howmet Aerospace’s price to rise above its current level of 218.56 USD, while Rockwell Automation’s consensus target of 421.57 USD slightly exceeds its current price of 409.32 USD, indicating moderate upside potential.
Analyst Opinions Comparison
This section compares analysts’ ratings and financial scores for Howmet Aerospace Inc. and Rockwell Automation, Inc.:
Rating Comparison
HWM Rating
- Rating: B, considered very favorable overall.
- Discounted Cash Flow Score: Moderate at 2 out of 5.
- ROE Score: Very favorable, highest at 5 out of 5.
- ROA Score: Very favorable at 5 out of 5.
- Debt To Equity Score: Moderate risk at 2 out of 5.
- Overall Score: Moderate at 3 out of 5.
ROK Rating
- Rating: B-, also considered very favorable overall.
- Discounted Cash Flow Score: Moderate at 3 out of 5.
- ROE Score: Very favorable, matching at 5 out of 5.
- ROA Score: Favorable at 4 out of 5.
- Debt To Equity Score: Very unfavorable at 1 out of 5.
- Overall Score: Moderate at 3 out of 5.
Which one is the best rated?
Based strictly on the data, HWM holds a slightly better rating with a higher debt-to-equity score indicating lower financial risk and a higher ROA score. Both share an equal overall and ROE score, but ROK scores lower on debt management.
Scores Comparison
Here is a comparison of the key financial health scores for Howmet Aerospace Inc. (HWM) and Rockwell Automation, Inc. (ROK):
HWM Scores
- Altman Z-Score: 10.43, indicating a safe zone with very low bankruptcy risk.
- Piotroski Score: 9, classified as very strong financial health.
ROK Scores
- Altman Z-Score: 5.32, indicating a safe zone with low bankruptcy risk.
- Piotroski Score: 8, classified as very strong financial health.
Which company has the best scores?
Based on the data, HWM has higher Altman Z-Score and Piotroski Score values than ROK, indicating comparatively stronger financial health and lower bankruptcy risk.
Grades Comparison
The following presents the recent grades assigned to Howmet Aerospace Inc. and Rockwell Automation, Inc.:
Howmet Aerospace Inc. Grades
This table summarizes the latest grades assigned by reputable grading companies for Howmet Aerospace Inc.
| Grading Company | Action | New Grade | Date |
|---|---|---|---|
| B of A Securities | Maintain | Buy | 2025-11-14 |
| JP Morgan | Maintain | Overweight | 2025-11-10 |
| Goldman Sachs | Maintain | Buy | 2025-11-03 |
| BTIG | Maintain | Buy | 2025-11-03 |
| UBS | Maintain | Neutral | 2025-10-31 |
| RBC Capital | Maintain | Outperform | 2025-10-31 |
| TD Cowen | Maintain | Buy | 2025-10-31 |
| Truist Securities | Maintain | Buy | 2025-10-15 |
| Susquehanna | Maintain | Positive | 2025-10-09 |
| B of A Securities | Maintain | Buy | 2025-08-05 |
Overall, Howmet Aerospace Inc. has consistently received buy or better ratings, with a consensus grade of “Buy,” indicating positive analyst sentiment.
Rockwell Automation, Inc. Grades
This table summarizes the latest grades assigned by reputable grading companies for Rockwell Automation, Inc.
| Grading Company | Action | New Grade | Date |
|---|---|---|---|
| Wells Fargo | Maintain | Equal Weight | 2026-01-07 |
| Barclays | Maintain | Overweight | 2026-01-07 |
| Goldman Sachs | Upgrade | Neutral | 2025-12-16 |
| Jefferies | Maintain | Buy | 2025-12-10 |
| Citigroup | Maintain | Buy | 2025-12-08 |
| Barclays | Maintain | Overweight | 2025-12-04 |
| Baird | Maintain | Outperform | 2025-11-21 |
| B of A Securities | Maintain | Buy | 2025-11-20 |
| JP Morgan | Maintain | Neutral | 2025-11-11 |
| Morgan Stanley | Maintain | Overweight | 2025-11-10 |
Rockwell Automation’s grades are more mixed, with a consensus of “Hold,” reflecting a more cautious analyst stance despite some buy and outperform ratings.
Which company has the best grades?
Howmet Aerospace Inc. has received stronger and more consistent buy and outperform grades compared to Rockwell Automation, Inc., which shows a broader range of neutral to buy ratings. This difference may influence investors prioritizing analyst confidence and growth prospects.
Strengths and Weaknesses
The following table summarizes the key strengths and weaknesses of Howmet Aerospace Inc. (HWM) and Rockwell Automation, Inc. (ROK) based on their recent financial performance, market presence, and innovation capabilities.
| Criterion | Howmet Aerospace Inc. (HWM) | Rockwell Automation, Inc. (ROK) |
|---|---|---|
| Diversification | Strong product diversification across Engine Products (3.74B), Fastening Systems (1.58B), and Structure Systems (1.08B) segments. | Diverse segments including Intelligent Devices (3.76B), Lifecycle Services (2.20B), and Software and Control (2.38B). |
| Profitability | High net margin (15.55%), ROE (25.36%), and ROIC (15.49%) indicating efficient capital use and strong profitability. | Solid net margin (10.42%), ROE (23.78%), and ROIC (13.71%) but slightly lower than HWM. |
| Innovation | Demonstrates growing ROIC (+86%) suggesting durable competitive advantage and continuous innovation in aerospace solutions. | Also shows growing ROIC (+77%) reflecting strong innovation, especially in automation and software. |
| Global presence | Significant presence in aerospace markets globally with expanding sales in Engine Products and Systems. | Global leader in industrial automation with strong software and service offerings enhancing global footprint. |
| Market Share | Strong in aerospace components, with increasing revenue in key segments indicating expanding market share. | Leading market share in automation and control systems, supported by growing software and service revenues. |
In summary, both companies exhibit durable competitive advantages with growing profitability and innovation. Howmet Aerospace excels in aerospace product diversification and profitability, while Rockwell Automation leads in automation technology and software integration. Investors should weigh these factors alongside valuation metrics and risk tolerance.
Risk Analysis
Below is a comparative table summarizing key risk factors for Howmet Aerospace Inc. (HWM) and Rockwell Automation, Inc. (ROK) in 2026:
| Metric | Howmet Aerospace Inc. (HWM) | Rockwell Automation, Inc. (ROK) |
|---|---|---|
| Market Risk | Beta 1.29, moderate exposure to aerospace cyclical demand | Beta 1.52, higher volatility due to automation tech trends |
| Debt level | Debt-to-equity 0.76 (neutral), interest coverage strong at 8.6x | Debt-to-equity 1.0 (neutral), interest coverage lower at 6.9x |
| Regulatory Risk | Aerospace industry regulations and export controls | Automation industry compliance, cybersecurity regulations |
| Operational Risk | Complex manufacturing processes, supply chain dependencies | Software & hardware integration challenges |
| Environmental Risk | Exposure to emissions and sustainability pressures in aerospace | Energy efficiency and e-waste management focus |
| Geopolitical Risk | Global footprint including China, Europe, potential trade tensions | International sales, especially in industrial markets, impacted by tariffs and geopolitical shifts |
The most significant risks include market volatility for both companies, with Rockwell Automation showing higher beta, implying greater sensitivity to market swings. Debt levels are manageable but warrant monitoring, especially for Rockwell given its higher leverage. Regulatory and geopolitical uncertainties remain impactful due to global operations and industry-specific constraints. Operational complexity and environmental compliance pose ongoing challenges that could affect profitability. Vigilant risk management is advised to navigate these factors effectively.
Which Stock to Choose?
Howmet Aerospace Inc. (HWM) shows a strong income evolution with consistent revenue and net income growth, supported by favorable profitability margins and solid financial ratios. Debt levels are moderate with a net debt to EBITDA of 1.58, and its rating is very favorable with a “B”. The company’s economic moat is very favorable, indicating durable competitive advantage and growing ROIC.
Rockwell Automation, Inc. (ROK) has a less favorable income evolution, marked by declining net income and mixed growth figures. Its financial ratios are slightly favorable overall, but debt is higher with net debt to EBITDA at 2.27, and it holds a very favorable “B-” rating. The company also demonstrates a very favorable moat with increasing profitability, though with some caution on debt metrics.
Investors prioritizing growth and strong profitability might view Howmet Aerospace as more appealing due to its robust income growth and excellent financial health. Conversely, those valuing stable competitive advantage with some tolerance for higher leverage could find Rockwell Automation potentially suitable. The interpretation depends on the investor’s risk profile and investment strategy.
Disclaimer: Investment carries a risk of loss of initial capital. The past performance is not a reliable indicator of future results. Be sure to understand risks before making an investment decision.
Go Further
I encourage you to read the complete analyses of Howmet Aerospace Inc. and Rockwell Automation, Inc. to enhance your investment decisions: