Home > Comparison > Industrials > HWM vs PSN
The strategic rivalry between Howmet Aerospace Inc. and Parsons Corporation defines the current trajectory of the Industrials sector. Howmet Aerospace operates as a capital-intensive machinery provider focused on aerospace components. Parsons Corporation delivers integrated defense and critical infrastructure services with a technology-driven model. This analysis pits manufacturing strength against service innovation to identify which path offers superior risk-adjusted returns for diversified investors.

Table of contents
Companies Overview
Howmet Aerospace and Parsons Corporation represent pivotal players in the industrial machinery sector, shaping aerospace and defense landscapes.
Howmet Aerospace Inc.: Advanced Engineered Solutions Leader
Howmet Aerospace dominates aerospace and transportation with engineered components like airfoils, fasteners, and forged wheels. Its core revenue stems from four segments, notably Engine Products and Fastening Systems. In 2026, the company focuses on expanding engineered structures and enhancing global aerospace manufacturing capabilities, leveraging its broad international footprint and innovation in materials.
Parsons Corporation: Integrated Defense & Infrastructure Innovator
Parsons Corporation specializes in defense, intelligence, and critical infrastructure with technology-driven services spanning cybersecurity, missile defense, and smart infrastructure. Revenue flows primarily from Federal Solutions and Critical Infrastructure segments. Its 2026 strategy emphasizes advanced cyber capabilities and integrated infrastructure management, targeting government and industrial clients with sophisticated, mission-critical systems.
Strategic Collision: Similarities & Divergences
Both firms operate in industrial machinery but diverge sharply: Howmet prioritizes manufacturing precision components for aerospace, while Parsons delivers integrated tech solutions for defense and infrastructure. Their battleground lies in government and commercial aerospace markets, where hardware meets software innovation. Howmet offers a tangible industrial play; Parsons leans on technology-driven growth, creating distinct risk and return profiles for investors.
Income Statement Comparison
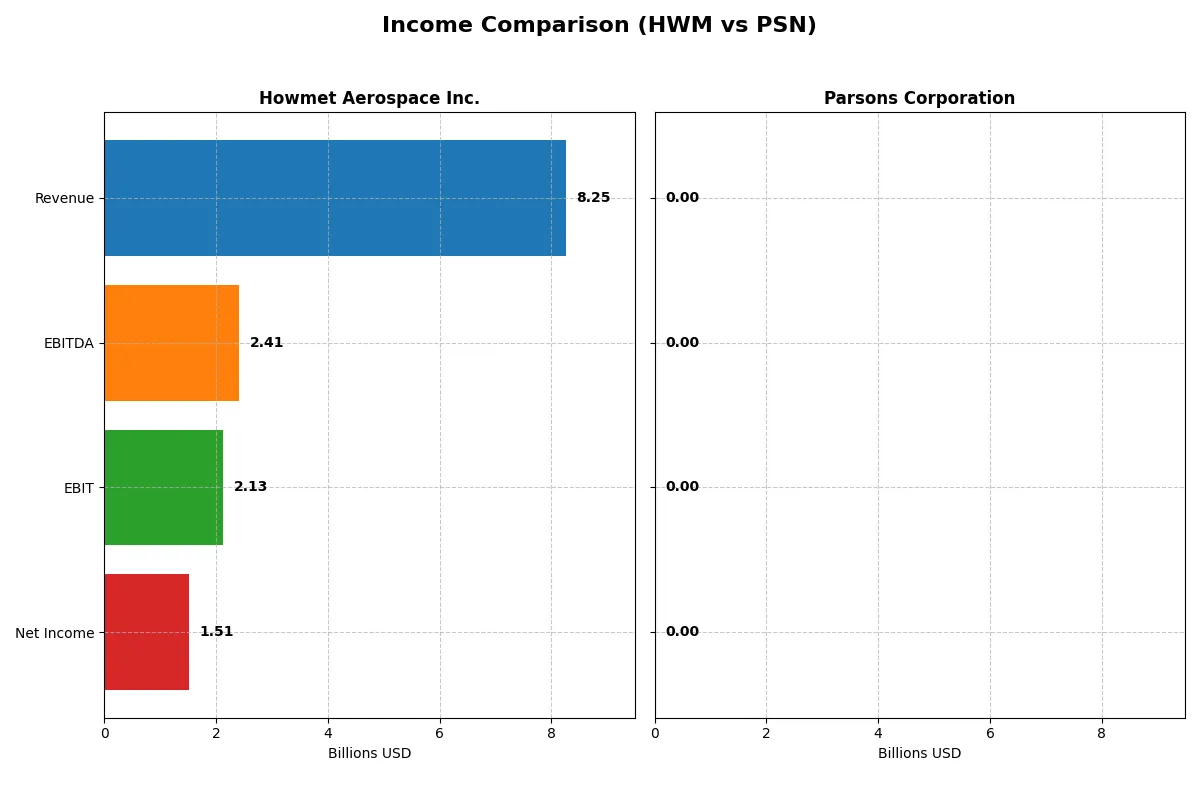
This data dissects the core profitability and scalability of both corporate engines to reveal who dominates the bottom line:
| Metric | Howmet Aerospace Inc. (HWM) | Parsons Corporation (PSN) |
|---|---|---|
| Revenue | 8.25B | 100K |
| Cost of Revenue | 5.72B | 0 |
| Operating Expenses | 407M | 16K |
| Gross Profit | 2.54B | 0 |
| EBITDA | 2.41B | 6.6K |
| EBIT | 2.13B | 0 |
| Interest Expense | 151M | -800 |
| Net Income | 1.51B | 3.8K |
| EPS | 3.73 | 0 |
| Fiscal Year | 2025 | 2025 |
Income Statement Analysis: The Bottom-Line Duel
This comparison reveals which company converts revenue into profit most efficiently and sustains margin growth over time.
Howmet Aerospace Inc. Analysis
Howmet Aerospace’s revenue climbed steadily from 5.0B in 2021 to 8.3B in 2025, with net income surging from 256M to 1.5B. Gross and net margins remain robust at 30.7% and 18.3%, respectively. The 2025 fiscal year shows strong operating leverage, with EBIT margin rising to 25.8%, signaling improved cost control and momentum.
Parsons Corporation Analysis
Parsons posted 6.8B revenue in 2024 but collapsed to near zero in 2025, reflecting a severe revenue decline. Margins suffered accordingly; gross and EBIT margins were effectively zero in 2025. Net margin stayed thin at 3.8%, with net income tumbling from 237M in 2024 to negligible figures in 2025, highlighting operational distress and a sharp loss of scale.
Margin Strength vs. Revenue Collapse
Howmet Aerospace clearly outperforms Parsons, showing consistent revenue growth and expanding margins over five years. Parsons’ sudden revenue plunge and margin erosion mark a fundamental weakness. Investors seeking stability and profit expansion will find Howmet’s profile far more compelling than Parsons’ volatile trajectory.
Financial Ratios Comparison
These vital ratios act as a diagnostic tool to expose the underlying fiscal health, valuation premiums, and capital efficiency of the companies compared below:
| Ratios | Howmet Aerospace Inc. (HWM) | Parsons Corporation (PSN) |
|---|---|---|
| ROE | 28.17% | 0.00014% |
| ROIC | 18.19% | 0.00015% |
| P/E | 54.93 | 0 |
| P/B | 15.47 | 0 |
| Current Ratio | 2.13 | 1.75 |
| Quick Ratio | 1.09 | 1.75 |
| D/E (Debt-to-Equity) | 0.57 | 0.52 |
| Debt-to-Assets | 27.28% | 23.87% |
| Interest Coverage | 14.11 | -8.25 |
| Asset Turnover | 0.74 | 0.00002 |
| Fixed Asset Turnover | 3.18 | 0.00036 |
| Payout Ratio | 12.00% | 0 |
| Dividend Yield | 0.22% | 0 |
| Fiscal Year | 2025 | 2025 |
Efficiency & Valuation Duel: The Vital Signs
Financial ratios serve as a company’s DNA, uncovering hidden risks and operational strengths that numbers alone might obscure.
Howmet Aerospace Inc.
Howmet Aerospace exhibits strong profitability, with a 28.17% ROE and an 18.27% net margin, signaling robust operational efficiency. However, its valuation appears stretched, with a P/E of 54.93 and a P/B of 15.47, both unfavorable. The company maintains a modest 0.22% dividend yield, suggesting limited shareholder cash returns but potential reinvestment.
Parsons Corporation
Parsons shows weak profitability metrics, with near-zero ROE and ROIC, reflecting operational struggles. Its valuation, with a P/E and P/B of zero, is favorable but likely due to reporting anomalies or losses. The company pays no dividend, indicating reinvestment or cash retention amid challenging earnings and negative interest coverage.
Premium Valuation vs. Operational Struggles
Howmet Aerospace balances strong returns with a premium valuation, while Parsons faces operational weakness despite attractive multiples. Risk-averse investors may prefer Howmet’s proven efficiency; those seeking turnaround potential might consider Parsons’ undervalued profile.
Which one offers the Superior Shareholder Reward?
Howmet Aerospace Inc. (HWM) pays a modest dividend yield near 0.22% with a sustainable 12% payout ratio, supported by strong free cash flow coverage. Its consistent buybacks amplify shareholder returns. Parsons Corporation (PSN) pays no dividend but reinvests heavily in growth, showing robust free cash flow and minimal debt. I see HWM’s balanced dividend plus buybacks as a more reliable total return in 2026, while PSN’s zero yield and volatile margins raise sustainability concerns. Hence, I favor Howmet Aerospace for superior shareholder reward this year.
Comparative Score Analysis: The Strategic Profile
The radar chart reveals the fundamental DNA and trade-offs of Howmet Aerospace and Parsons Corporation, highlighting their strategic strengths and weaknesses:
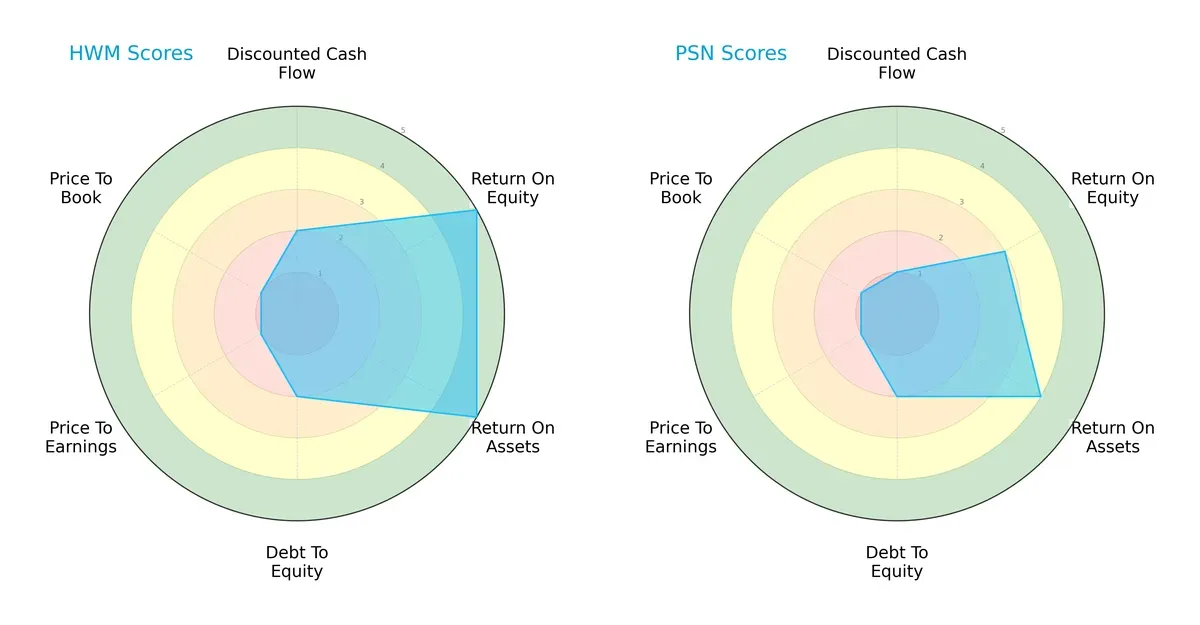
Howmet Aerospace (HWM) shows superior efficiency with top ROE (5) and ROA (5) scores, while Parsons (PSN) trails with moderate ROE (3) and favorable ROA (4). Both companies share weak valuation metrics (P/E and P/B at 1), indicating potential overvaluation risks. Debt-to-equity scores are equally unfavorable (2), signaling balance sheet leverage concerns. HWM’s profile is more balanced, driven by operational strength, whereas PSN relies more on asset utilization.
Bankruptcy Risk: Solvency Showdown
Howmet Aerospace’s Altman Z-Score of 12.4 vastly exceeds Parsons’ 3.05, positioning both in the safe zone but with very different risk buffers:
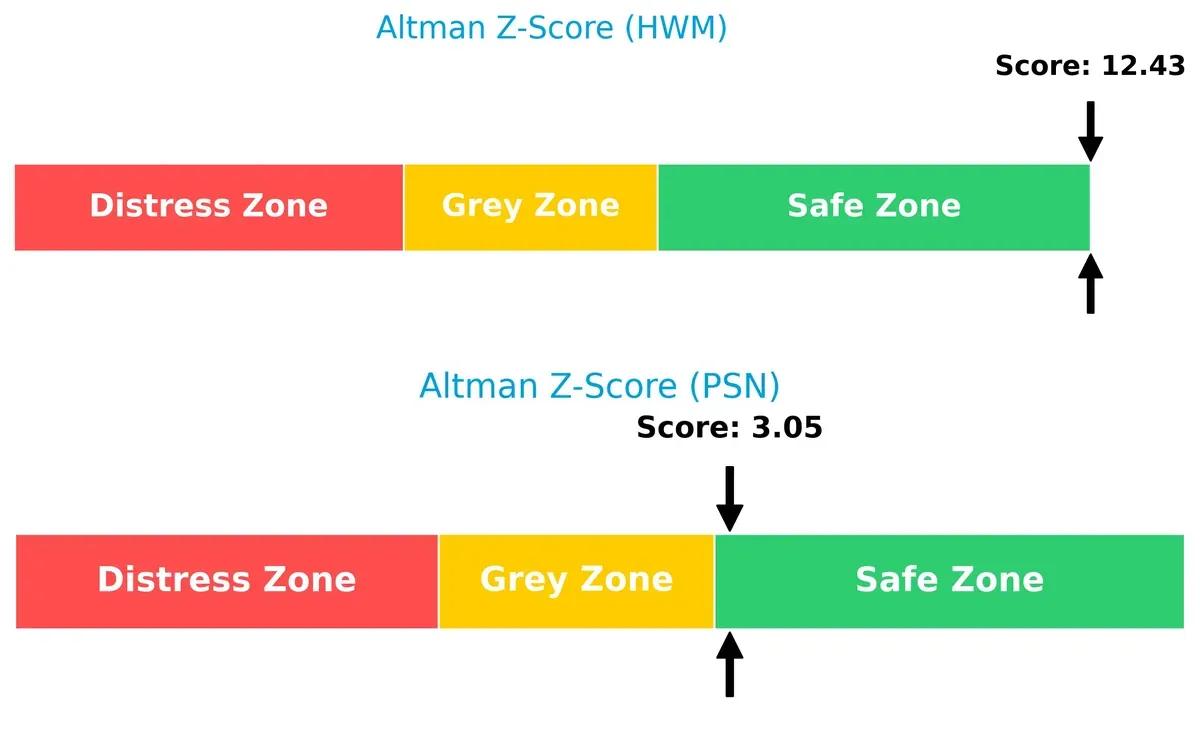
This wide gap signals HWM’s rock-solid solvency, virtually immune to bankruptcy risks this cycle. PSN, while safe, sits closer to the caution threshold, implying a need for vigilant monitoring of liquidity and leverage trends.
Financial Health: Quality of Operations
Howmet Aerospace’s Piotroski F-Score of 8 reflects very strong financial health, outperforming Parsons’ average score of 6, which signals some operational weaknesses:
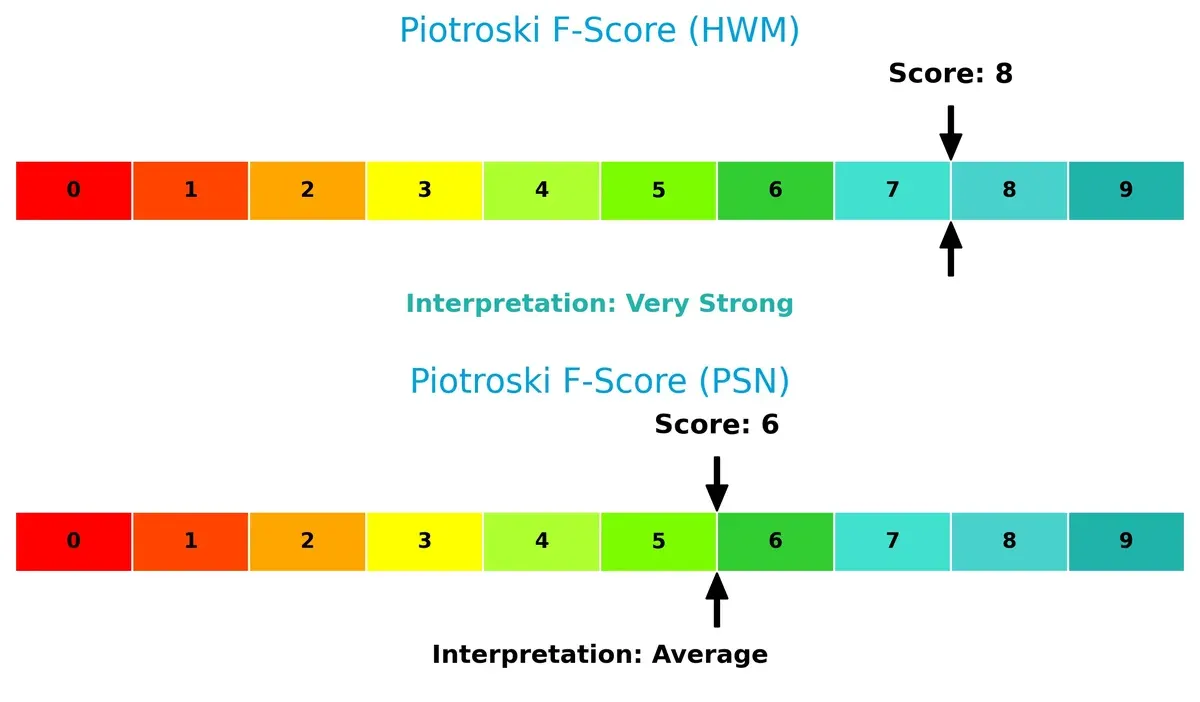
HWM demonstrates robust profitability, liquidity, and operational efficiency, with no red flags. PSN’s middling score suggests areas for improvement in internal metrics, cautioning investors about potential vulnerabilities in financial quality.
How are the two companies positioned?
This section dissects the operational DNA of HWM and PSN by comparing their revenue distribution and internal dynamics. The goal is to confront their economic moats to identify the most resilient and sustainable competitive advantage today.
Revenue Segmentation: The Strategic Mix
The following visual comparison dissects how Howmet Aerospace Inc. and Parsons Corporation diversify their income streams and where their primary sector bets lie:
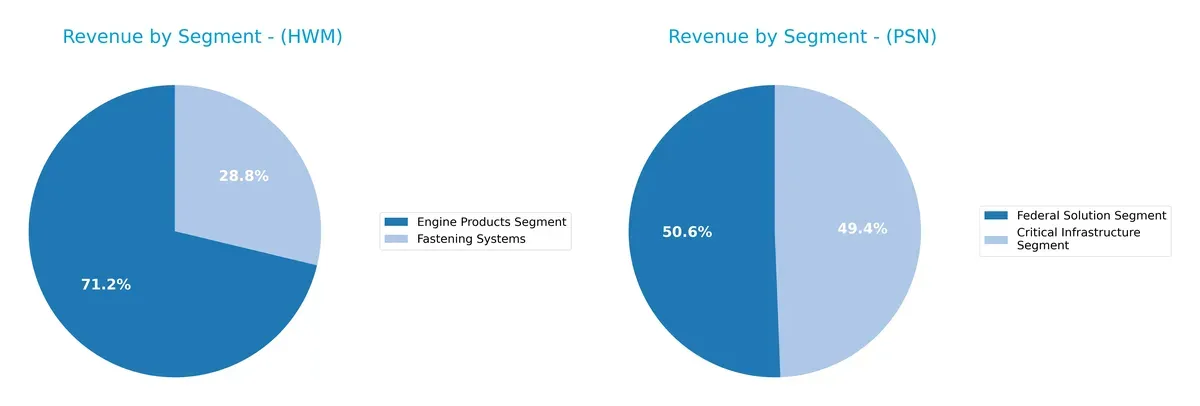
Howmet Aerospace anchors revenue in its Engine Products Segment with $4.33B, supported by $1.75B from Fastening Systems, showing moderate diversification. Parsons Corporation presents a more balanced split between its Federal Solution ($3.22B) and Critical Infrastructure ($3.14B) segments, signaling strategic dual-sector exposure. Howmet’s concentration risks contrast with Parsons’ ecosystem lock-in across federal and infrastructure projects, reflecting divergent growth and risk profiles.
Strengths and Weaknesses Comparison
This table compares the Strengths and Weaknesses of Howmet Aerospace Inc. (HWM) and Parsons Corporation (PSN):
HWM Strengths
- Strong profitability with net margin 18.27%
- High ROE 28.17% and ROIC 18.19% above WACC
- Favorable liquidity ratios current 2.13 and quick 1.09
- Diverse product segments including Engine Products and Fastening Systems
- Broad global presence including US, Europe, and Asia
- Solid debt management with debt-to-assets 27.28%
PSN Strengths
- Favorable WACC 2.19% indicating lower capital costs
- Positive valuation metrics with P/E and P/B at 0 (favorable)
- Healthy liquidity with current and quick ratios at 1.75
- Balanced revenue from Federal Solutions and Critical Infrastructure segments
- Geographic focus on North America and Middle East markets
- Lower debt-to-assets ratio at 23.87%
HWM Weaknesses
- Elevated valuation ratios P/E 54.93 and P/B 15.47 signal overvaluation risk
- Modest dividend yield 0.22% may deter income investors
- Neutral asset turnover 0.74 limits operational efficiency insight
- Moderate leverage with debt-to-equity 0.57 neutral but watchful
- Exposure concentrated in US revenue around 4.4B limits diversification
PSN Weaknesses
- Weak profitability with net margin 3.8%, ROE and ROIC near zero
- Negative interest coverage indicating financial stress
- Zero asset and fixed asset turnover imply operational inefficiencies
- Unfavorable dividend yield at 0% reduces shareholder returns
- Slightly unfavorable global ratios with half metrics negative
- Limited geographic diversification focused on North America and Middle East
Howmet’s strengths lie in strong profitability, liquidity, and global reach, but high valuation ratios raise caution. Parsons shows solid capital cost advantages and liquidity but suffers from weak profitability and operational challenges. Both companies face geographic concentration risks that could affect future resilience.
The Moat Duel: Analyzing Competitive Defensibility
A structural moat is the sole barrier shielding long-term profits from relentless competition erosion. Let’s dissect the competitive moats of two industrial machinery firms:
Howmet Aerospace Inc. (HWM): Cost Advantage & Engineering Expertise
I see HWM’s moat rooted in its advanced engineered solutions and cost advantage in aerospace components. This shows in its high and growing ROIC, reaching nearly 9% above WACC, signaling strong value creation. In 2026, expanding aerospace demand and new product lines could deepen this moat further.
Parsons Corporation (PSN): Niche Defense & Government Contracts
PSN relies on specialized defense and intelligence contracts, a distinct moat compared to HWM’s industrial scale. However, its declining ROIC and negative growth warn of a weakening competitive edge. Opportunities lie in cybersecurity and infrastructure tech, but the firm faces significant margin pressure.
Aerospace Cost Efficiency vs. Defense Contract Specialization
HWM boasts a wider and deeper moat, with sustained ROIC growth and strong profitability metrics over five years. PSN’s shrinking returns and financial struggles reveal a fragile moat. I believe Howmet Aerospace is better positioned to defend and expand its market share in 2026.
Which stock offers better returns?
Over the past 12 months, Howmet Aerospace Inc. surged sharply, while Parsons Corporation’s stock declined with a clear bearish momentum.
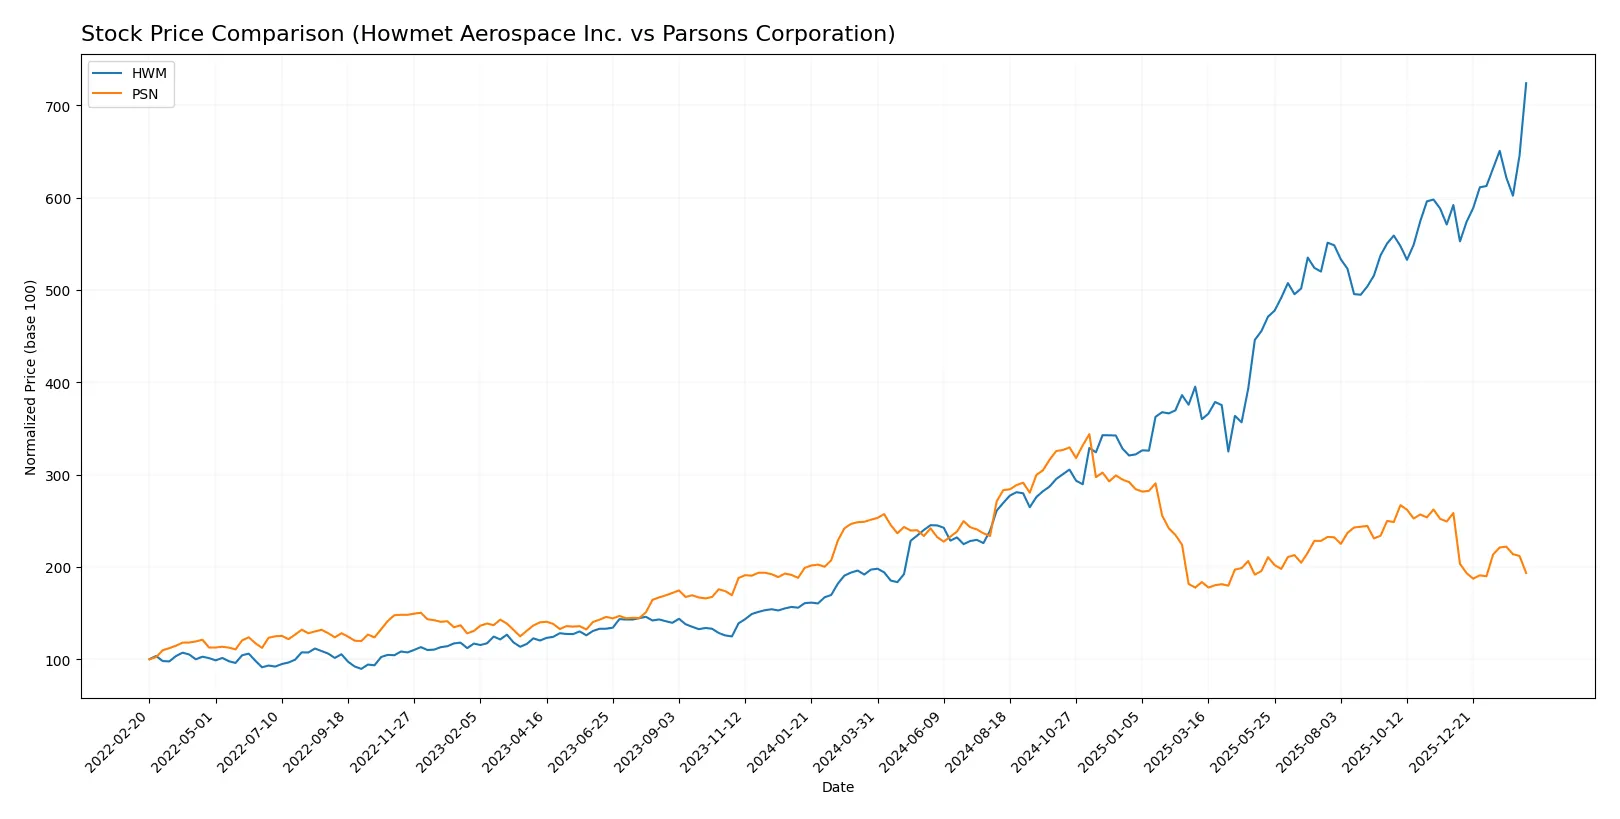
Trend Comparison
Howmet Aerospace Inc. shows a strong bullish trend with a 267.42% price increase over the past year, marked by accelerating gains and high volatility. It peaked at 250.21 and bottomed at 63.41.
Parsons Corporation exhibits a bearish trend with a 23.0% price decline over the same period. The downtrend decelerates slightly, with lower volatility and a high of 112.69 and a low of 58.22.
Howmet Aerospace’s stock outperformed Parsons significantly, delivering the highest market returns with sustained acceleration versus Parsons’ steady decline.
Target Prices
Analysts present a bullish consensus for Howmet Aerospace Inc. and Parsons Corporation, reflecting optimism in industrial machinery.
| Company | Target Low | Target High | Consensus |
|---|---|---|---|
| Howmet Aerospace Inc. | 209 | 290 | 259.63 |
| Parsons Corporation | 78 | 104 | 86.8 |
Howmet’s target consensus of 259.63 exceeds its current price of 250.21, signaling upside potential. Parsons shows a wider gap, with a consensus at 86.8 well above the 63.38 stock price, indicating strong growth expectations.

Don’t Let Luck Decide Your Entry Point
Optimize your entry points with our advanced ProRealTime indicators. You’ll get efficient buy signals with precise price targets for maximum performance. Start outperforming now!
How do institutions grade them?
Howmet Aerospace Inc. Grades
The table below summarizes recent institutional grades for Howmet Aerospace Inc.:
| Grading Company | Action | New Grade | Date |
|---|---|---|---|
| Susquehanna | Maintain | Positive | 2026-02-13 |
| Citigroup | Maintain | Buy | 2026-01-13 |
| B of A Securities | Maintain | Buy | 2025-11-14 |
| JP Morgan | Maintain | Overweight | 2025-11-10 |
| BTIG | Maintain | Buy | 2025-11-03 |
| Goldman Sachs | Maintain | Buy | 2025-11-03 |
| TD Cowen | Maintain | Buy | 2025-10-31 |
| RBC Capital | Maintain | Outperform | 2025-10-31 |
| UBS | Maintain | Neutral | 2025-10-31 |
| Truist Securities | Maintain | Buy | 2025-10-15 |
Parsons Corporation Grades
Below is a summary of recent institutional grades for Parsons Corporation:
| Grading Company | Action | New Grade | Date |
|---|---|---|---|
| UBS | Maintain | Buy | 2026-02-12 |
| Truist Securities | Maintain | Buy | 2026-02-12 |
| Keybanc | Maintain | Overweight | 2026-02-12 |
| Barclays | Maintain | Overweight | 2026-01-23 |
| Keybanc | Maintain | Overweight | 2026-01-20 |
| UBS | Maintain | Buy | 2026-01-15 |
| Citigroup | Maintain | Buy | 2026-01-13 |
| B of A Securities | Maintain | Buy | 2025-12-30 |
| Stifel | Maintain | Buy | 2025-12-23 |
| Jefferies | Maintain | Hold | 2025-12-11 |
Which company has the best grades?
Parsons Corporation holds a stronger consensus with multiple “Buy” and “Overweight” ratings and fewer neutral or lower grades. Howmet Aerospace also receives mostly positive grades but includes one “Neutral.” This difference could influence investors favoring Parsons as having broader institutional confidence.
Risks specific to each company
The following categories pinpoint critical pressure points and systemic threats facing Howmet Aerospace Inc. and Parsons Corporation in the 2026 market environment:
1. Market & Competition
Howmet Aerospace Inc.
- Faces intense aerospace machinery competition globally, relying on advanced engineered solutions to maintain leadership.
Parsons Corporation
- Competes mainly in defense and critical infrastructure sectors with specialized technology services, facing niche but fierce competition.
2. Capital Structure & Debt
Howmet Aerospace Inc.
- Maintains a moderate debt-to-equity ratio (0.57) with strong interest coverage (14.11), signaling solid debt management.
Parsons Corporation
- Similar debt-to-equity level (0.52) but weak interest coverage (negative), raising concerns about debt servicing ability.
3. Stock Volatility
Howmet Aerospace Inc.
- Exhibits higher beta (1.25), indicating greater stock price volatility tied to market swings.
Parsons Corporation
- Lower beta (0.67) suggests more stability but possibly slower upside in bullish cycles.
4. Regulatory & Legal
Howmet Aerospace Inc.
- Operates globally in aerospace, exposed to complex export controls and aviation safety regulations.
Parsons Corporation
- Engages heavily with U.S. defense contracts, facing strict government compliance and cybersecurity regulations.
5. Supply Chain & Operations
Howmet Aerospace Inc.
- Relies on global manufacturing and raw materials for aerospace components, vulnerable to geopolitical disruptions.
Parsons Corporation
- Dependent on program management and technology services, with risks in project execution and supplier reliability.
6. ESG & Climate Transition
Howmet Aerospace Inc.
- Pressure to innovate in sustainable aerospace solutions amid rising environmental standards worldwide.
Parsons Corporation
- Increasing demand for green infrastructure projects, but also scrutiny on defense-related environmental impact.
7. Geopolitical Exposure
Howmet Aerospace Inc.
- Operates internationally, including China and Europe, exposing it to trade tensions and tariffs.
Parsons Corporation
- Primarily U.S.-centric but with Middle East exposure, vulnerable to geopolitical instability and defense budget shifts.
Which company shows a better risk-adjusted profile?
Howmet Aerospace confronts significant market competition and geopolitical risks but benefits from strong financial health and robust interest coverage. Parsons faces critical challenges in profitability, debt servicing, and operational execution, despite lower stock volatility. Howmet’s Altman Z-score (12.43) and Piotroski (8) confirm superior financial resilience, while Parsons’ weaker scores highlight elevated risk. I view Howmet Aerospace as the safer, better risk-adjusted investment given its stable liquidity and strong profitability metrics in this demanding industrial machinery sector.
Final Verdict: Which stock to choose?
Howmet Aerospace (HWM) shines as a powerhouse of operational efficiency and value creation. Its superpower lies in a consistently growing return on invested capital well above its cost of capital, signaling a sustainable competitive advantage. The main point of vigilance is its premium valuation, which could temper near-term upside. HWM suits portfolios aiming for aggressive growth backed by strong fundamentals.
Parsons Corporation (PSN) boasts a strategic moat through its steady cash flow generation and solid balance sheet, providing a safety cushion absent in its peer. However, its declining profitability and value destruction raise caution flags. PSN fits investors seeking growth at a reasonable price with a preference for stability, but its challenges suggest a higher risk profile than Howmet Aerospace.
If you prioritize sustained value creation and can tolerate premium pricing, Howmet Aerospace outshines Parsons with superior profitability and momentum. However, if you seek relative stability with a focus on cash flow safety, Parsons offers a more conservative profile despite its operational headwinds. Each stock aligns with distinct investor avatars and risk tolerances, underscoring the importance of matching choice to strategy.
Disclaimer: Investment carries a risk of loss of initial capital. The past performance is not a reliable indicator of future results. Be sure to understand risks before making an investment decision.
Go Further
I encourage you to read the complete analyses of Howmet Aerospace Inc. and Parsons Corporation to enhance your investment decisions: