Home > Comparison > Industrials > PH vs HWM
The strategic rivalry between Parker-Hannifin Corporation and Howmet Aerospace Inc. shapes the Industrials sector’s competitive landscape. Parker-Hannifin operates as a diversified industrial machinery leader with broad aerospace and mobile markets exposure. Howmet Aerospace focuses on advanced engineered solutions, emphasizing aerospace components and forged products. This analysis contrasts their operational models to identify which company offers superior risk-adjusted returns for a diversified portfolio in a capital-intensive industry.
Table of contents
Companies Overview
Parker-Hannifin and Howmet Aerospace are key industrial players shaping aerospace and machinery markets globally.
Parker-Hannifin Corporation: Global Motion & Control Leader
Parker-Hannifin dominates the motion and control technologies sector with a broad product range across industrial, mobile, and aerospace markets. Its revenue primarily stems from diversified industrial and aerospace systems, including hydraulic components and thermal management products. In 2026, the company emphasizes expanding its sealing, filtration, and control solutions to OEMs and aftermarket distributors worldwide.
Howmet Aerospace Inc.: Advanced Aerospace Materials Specialist
Howmet Aerospace excels in engineered solutions for aerospace and transportation industries. It drives revenue through airfoils, fastening systems, and forged wheels segments, serving aircraft engines and commercial transport markets. The company’s 2026 strategy focuses on innovation in titanium and aluminum forgings and expanding its global footprint across multiple aerospace hubs.
Strategic Collision: Similarities & Divergences
Both firms serve aerospace and industrial markets but differ in approach: Parker-Hannifin offers a diversified product ecosystem, while Howmet focuses on specialized engineered materials. Their primary battleground is aerospace components, competing on innovation and quality. Parker-Hannifin’s broad industrial reach contrasts with Howmet’s niche material expertise, creating distinct profiles for investors prioritizing scale versus specialization.
Income Statement Comparison
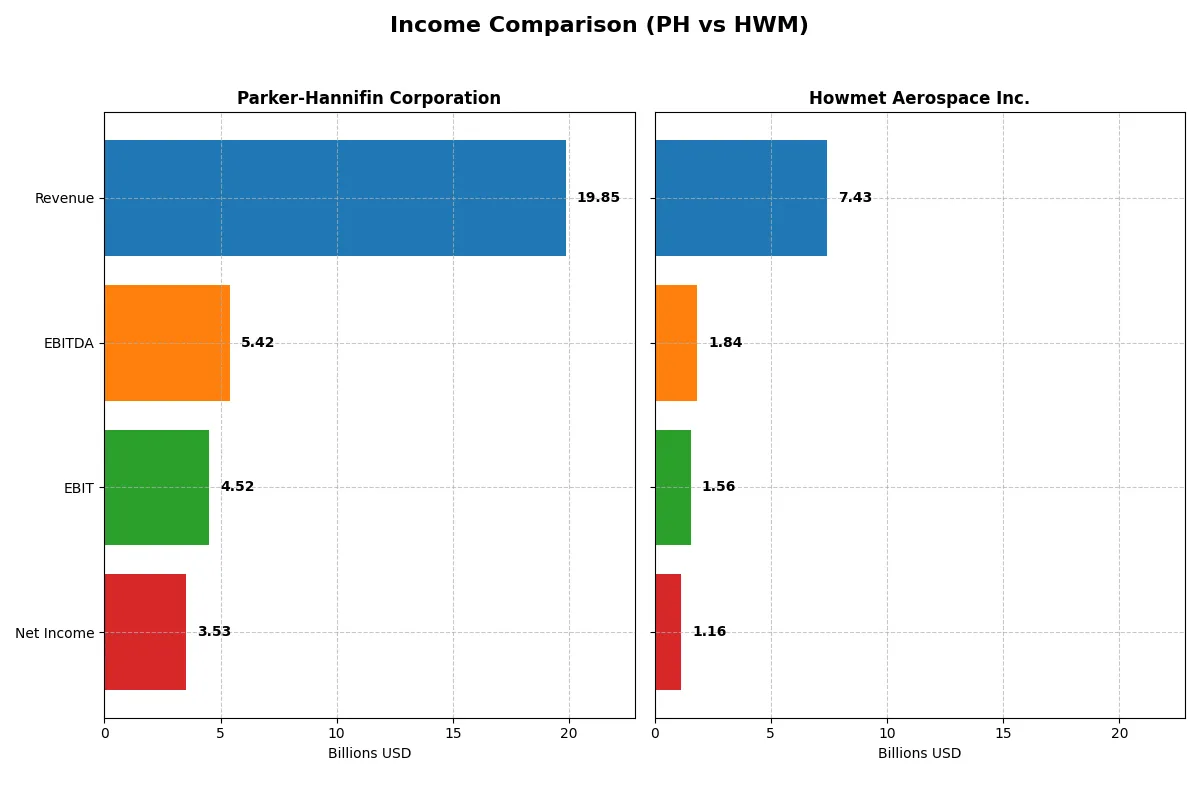
This data dissects the core profitability and scalability of both corporate engines to reveal who dominates the bottom line:
| Metric | Parker-Hannifin Corporation (PH) | Howmet Aerospace Inc. (HWM) |
|---|---|---|
| Revenue | 19.85B | 7.43B |
| Cost of Revenue | 12.54B | 5.38B |
| Operating Expenses | 3.26B | 380M |
| Gross Profit | 7.32B | 2.05B |
| EBITDA | 5.42B | 1.84B |
| EBIT | 4.52B | 1.57B |
| Interest Expense | 409M | 182M |
| Net Income | 3.53B | 1.16B |
| EPS | 27.52 | 2.83 |
| Fiscal Year | 2025 | 2024 |
Income Statement Analysis: The Bottom-Line Duel
This income statement comparison exposes the true operational efficiency and growth momentum of two industrial powerhouses.
Parker-Hannifin Corporation Analysis
Parker-Hannifin’s revenue shows steady growth over five years, reaching $19.85B in 2025, though slightly dipping -0.4% from 2024. Net income surged 24.6% last year to $3.53B, lifting net margins to a healthy 17.8%. Strong gross (36.9%) and EBIT (22.8%) margins confirm robust cost control and operational efficiency, with EPS up 24.2%.
Howmet Aerospace Inc. Analysis
Howmet Aerospace accelerated revenue growth to 11.9% in 2024, hitting $7.43B. Net income expanded 34.9% year-on-year to $1.16B, pushing net margins to 15.6%. Howmet’s gross margin at 27.6% and EBIT margin at 21.1% reflect improving profitability amid rising scale. EPS growth of 53.6% signals strong earnings momentum and operational leverage.
Margin Leadership vs. High Growth Momentum
Parker-Hannifin commands superior margin profiles and larger absolute profits, showcasing mature operational strength. Howmet delivers faster revenue, net income, and EPS growth, reflecting dynamic expansion from a smaller base. Investors seeking steady, high-margin cash flow may prefer Parker-Hannifin, while those favoring rapid earnings acceleration might lean toward Howmet.
Financial Ratios Comparison
These vital ratios act as a diagnostic tool to expose the underlying fiscal health, valuation premiums, and capital efficiency of the companies included below:
| Ratios | Parker-Hannifin (PH) | Howmet Aerospace (HWM) |
|---|---|---|
| ROE | 25.8% | 25.4% |
| ROIC | 13.7% | 15.5% |
| P/E | 25.4 | 38.6 |
| P/B | 6.5 | 9.8 |
| Current Ratio | 1.19 | 2.17 |
| Quick Ratio | 0.71 | 0.98 |
| D/E (Debt-to-Equity Ratio) | 0.69 | 0.76 |
| Debt-to-Assets | 32.2% | 33.0% |
| Interest Coverage | 9.93 | 9.19 |
| Asset Turnover | 0.67 | 0.71 |
| Fixed Asset Turnover | 6.76 | 2.92 |
| Payout Ratio | 24.4% | 9.4% |
| Dividend Yield | 0.96% | 0.24% |
| Fiscal Year | 2025 | 2024 |
Efficiency & Valuation Duel: The Vital Signs
Financial ratios act as the company’s DNA, revealing hidden risks and operational excellence through clear numerical signals.
Parker-Hannifin Corporation
Parker-Hannifin boasts a strong 25.8% ROE and a healthy 17.8% net margin, signaling robust profitability. However, its P/E of 25.4 and P/B of 6.55 suggest the stock trades at a stretched valuation. The modest 0.96% dividend yield indicates limited shareholder returns, with reinvestment focused on operational efficiency and growth.
Howmet Aerospace Inc.
Howmet Aerospace delivers a comparable 25.4% ROE with a slightly lower 15.6% net margin, showing efficient core operations. The company’s valuation appears more stretched, with a P/E of 38.6 and P/B near 9.8. A low 0.24% dividend yield points to reinvestment prioritizing growth, supported by a strong current ratio of 2.17 for financial flexibility.
Balanced Profitability vs. Valuation Stretch
Both companies show slightly favorable financial metrics, but Parker-Hannifin offers higher margins at a more moderate valuation. Howmet’s higher P/E and P/B ratios imply greater risk for stretched pricing. Investors seeking balanced risk and reward might prefer Parker-Hannifin’s stable profitability, while growth-focused investors may tolerate Howmet’s premium valuation.
Which one offers the Superior Shareholder Reward?
I observe that Parker-Hannifin (PH) offers a more balanced and sustainable shareholder reward than Howmet Aerospace (HWM). PH pays a higher dividend yield near 1.0%, supported by a payout ratio of 24%, backed by strong free cash flow coverage (~88%). It also executes meaningful share buybacks, enhancing total returns. Conversely, HWM’s dividend yield is minimal at 0.24%, with a low payout ratio (~9%) and weaker free cash flow conversion (~75%), signaling reliance on retained earnings for growth. HWM’s buybacks are modest compared to PH’s aggressive capital return. Historically in industrial sectors, a robust dividend plus buyback strategy like PH’s signals disciplined capital allocation and appeals to income-focused investors. I conclude PH delivers a superior total return profile for 2026 investors seeking both income and capital appreciation.
Comparative Score Analysis: The Strategic Profile
The radar chart reveals the fundamental DNA and strategic trade-offs of Parker-Hannifin and Howmet Aerospace:
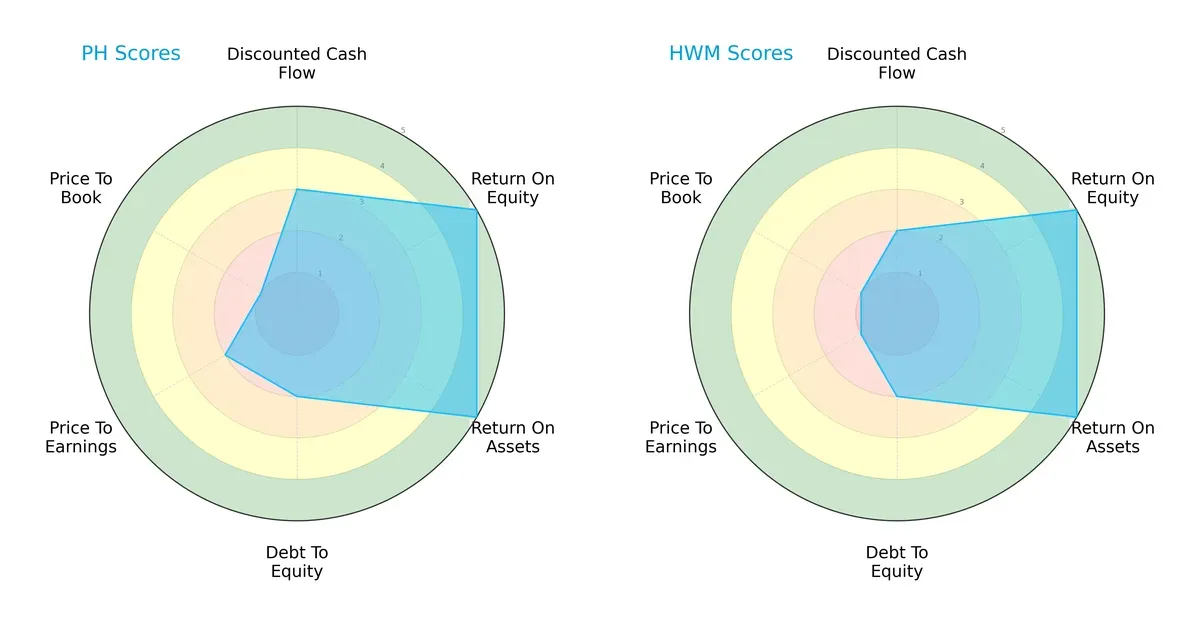
Both companies score equally strong on ROE and ROA, demonstrating efficient profit generation and asset utilization. Parker-Hannifin holds a slight edge in Discounted Cash Flow (DCF) valuation, suggesting better future cash flow prospects. Both firms share moderate debt-to-equity scores, signaling balanced leverage but elevated financial risk. Howmet Aerospace’s valuation scores (P/E and P/B) are weaker, indicating higher market skepticism or possible overvaluation. Overall, Parker-Hannifin presents a more balanced profile, while Howmet leans on operational efficiency but struggles with valuation metrics.
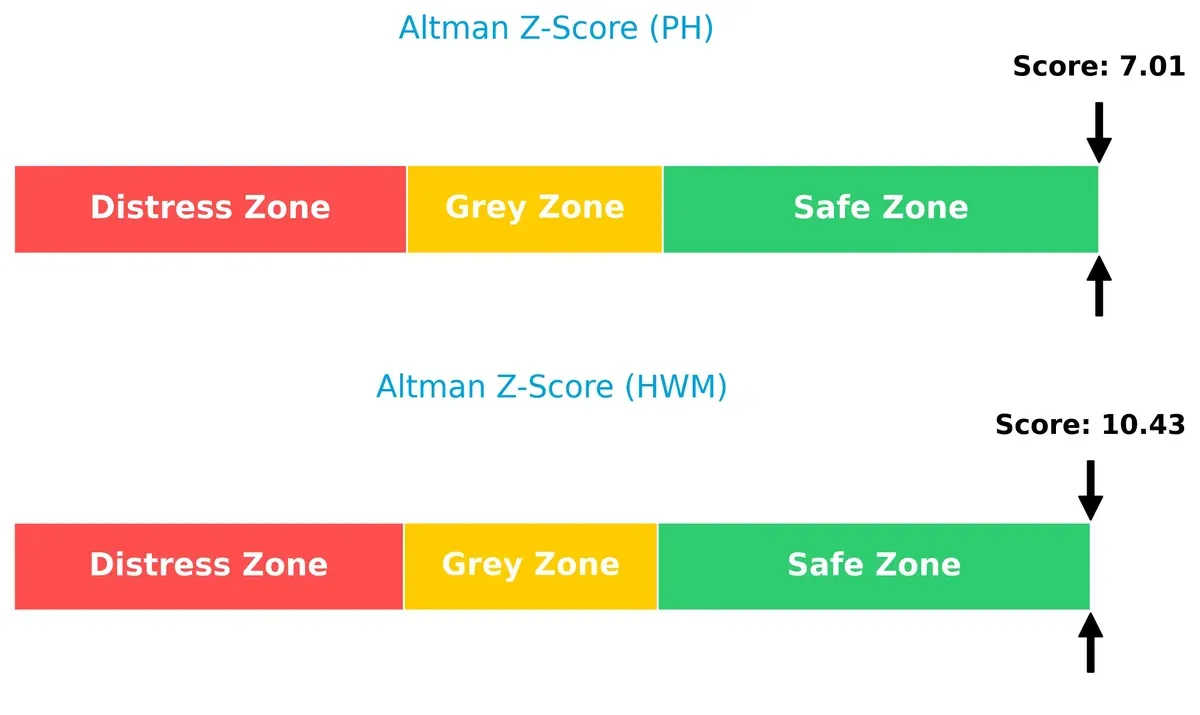
Bankruptcy Risk: Solvency Showdown
The Altman Z-Score gap favors Howmet Aerospace’s stronger solvency position, implying superior long-term survival prospects in this cycle:
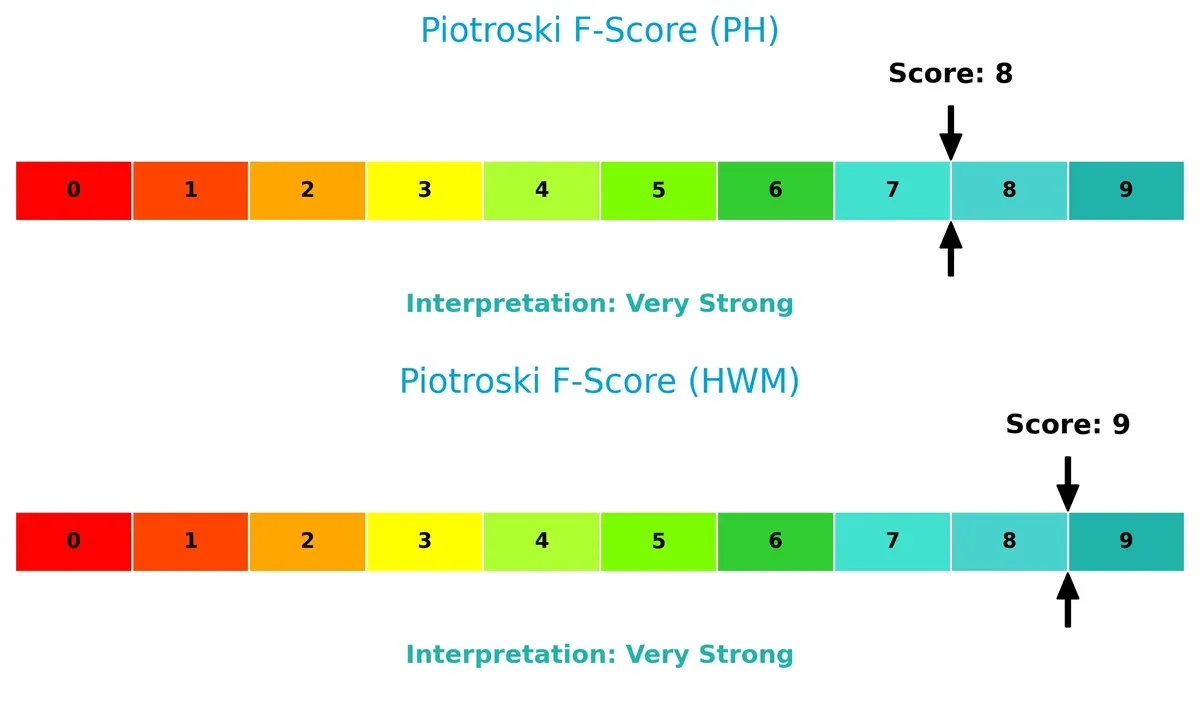
Financial Health: Quality of Operations
Howmet Aerospace edges Parker-Hannifin with a Piotroski F-Score of 9 versus 8, signaling marginally stronger internal financial health and fewer red flags:
How are the two companies positioned?
This section dissects the operational DNA of PH and HWM by comparing their revenue distribution by segment and analyzing their strengths and weaknesses. The final objective is to confront their economic moats to identify which offers the most resilient and sustainable competitive advantage in today’s market.
Revenue Segmentation: The Strategic Mix
This visual comparison dissects how Parker-Hannifin and Howmet Aerospace diversify their income streams and where their primary sector bets lie:
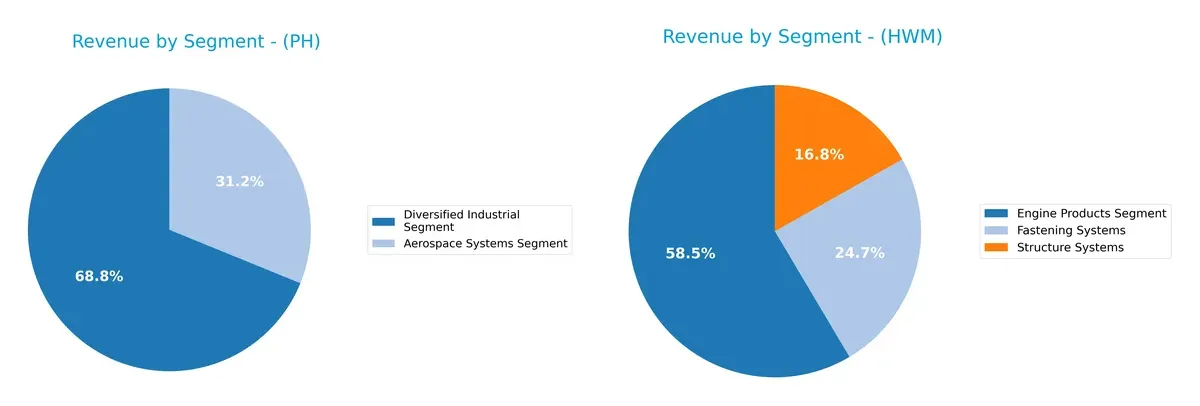
Parker-Hannifin anchors its revenue with a dominant Diversified Industrial Segment at $13.7B in 2025, complemented by $6.2B from Aerospace Systems. This mix suggests resilience through industrial breadth. Howmet Aerospace pivots on Engine Products, generating $3.7B, but balances with Fastening Systems and Structure Systems, totaling about $2.6B. Howmet shows a more diversified aerospace focus, while Parker-Hannifin’s heavy industrial tilt signals strong infrastructure dominance but also concentration risk.
Strengths and Weaknesses Comparison
This table compares the Strengths and Weaknesses of Parker-Hannifin Corporation and Howmet Aerospace Inc.:
PH Strengths
- Strong profitability with 17.79% net margin
- High ROE at 25.81%
- Favorable interest coverage at 11.04
- Diversified revenue from Aerospace and Industrial segments
- Significant North America and Europe presence
- Efficient fixed asset turnover at 6.76
HWM Strengths
- Solid profitability with 15.55% net margin
- High ROE at 25.36%
- Favorable current ratio at 2.17
- Diverse aerospace product segments
- Broad global footprint including key countries
- Slightly better ROIC than PH at 15.49%
PH Weaknesses
- Unfavorable PE and PB ratios indicate high valuation
- Low quick ratio at 0.71 signals liquidity risk
- Dividend yield below 1%
- Moderate debt level with 0.69 D/E ratio
- Neutral asset turnover at 0.67
HWM Weaknesses
- Elevated PE and PB ratios show stretched valuation
- Low dividend yield at 0.24%
- Neutral quick ratio near 1.0
- Moderate leverage with 0.76 D/E ratio
- Fixed asset turnover at 2.92 lags PH
Both companies show strong profitability and global reach but face valuation concerns. PH’s liquidity and asset efficiency contrast with HWM’s better current ratio and higher ROIC. These factors shape each firm’s financial strategy and risk profile.
The Moat Duel: Analyzing Competitive Defensibility
A structural moat alone shields long-term profits from relentless competition and market pressures. Let’s dissect the moats protecting Parker-Hannifin and Howmet Aerospace:
Parker-Hannifin Corporation: Engineering Precision with Cost Advantage
Parker-Hannifin’s moat lies in cost advantage through highly efficient motion control systems. Its 4.4% ROIC premium over WACC signals durable value creation. Expanding aerospace segments in 2026 could deepen this moat, yet margin pressure from industrial markets poses risks.
Howmet Aerospace Inc.: Advanced Materials and Innovation Network
Howmet boasts a technology moat rooted in advanced engineered aerospace materials. Its 5.8% ROIC spread and 86% ROIC growth reflect robust capital efficiency. Strong revenue growth and innovation in forged wheels enhance market disruption potential in 2026.
Engineering Efficiency vs. Material Innovation: Who Holds the Stronger Moat?
Howmet Aerospace exhibits a wider and faster-growing moat, driven by innovation and expanding aerospace demand. Parker-Hannifin’s cost advantage remains solid but more vulnerable to industrial cycle downturns. Howmet appears better positioned to defend and grow market share amid evolving aerospace trends.
Which stock offers better returns?
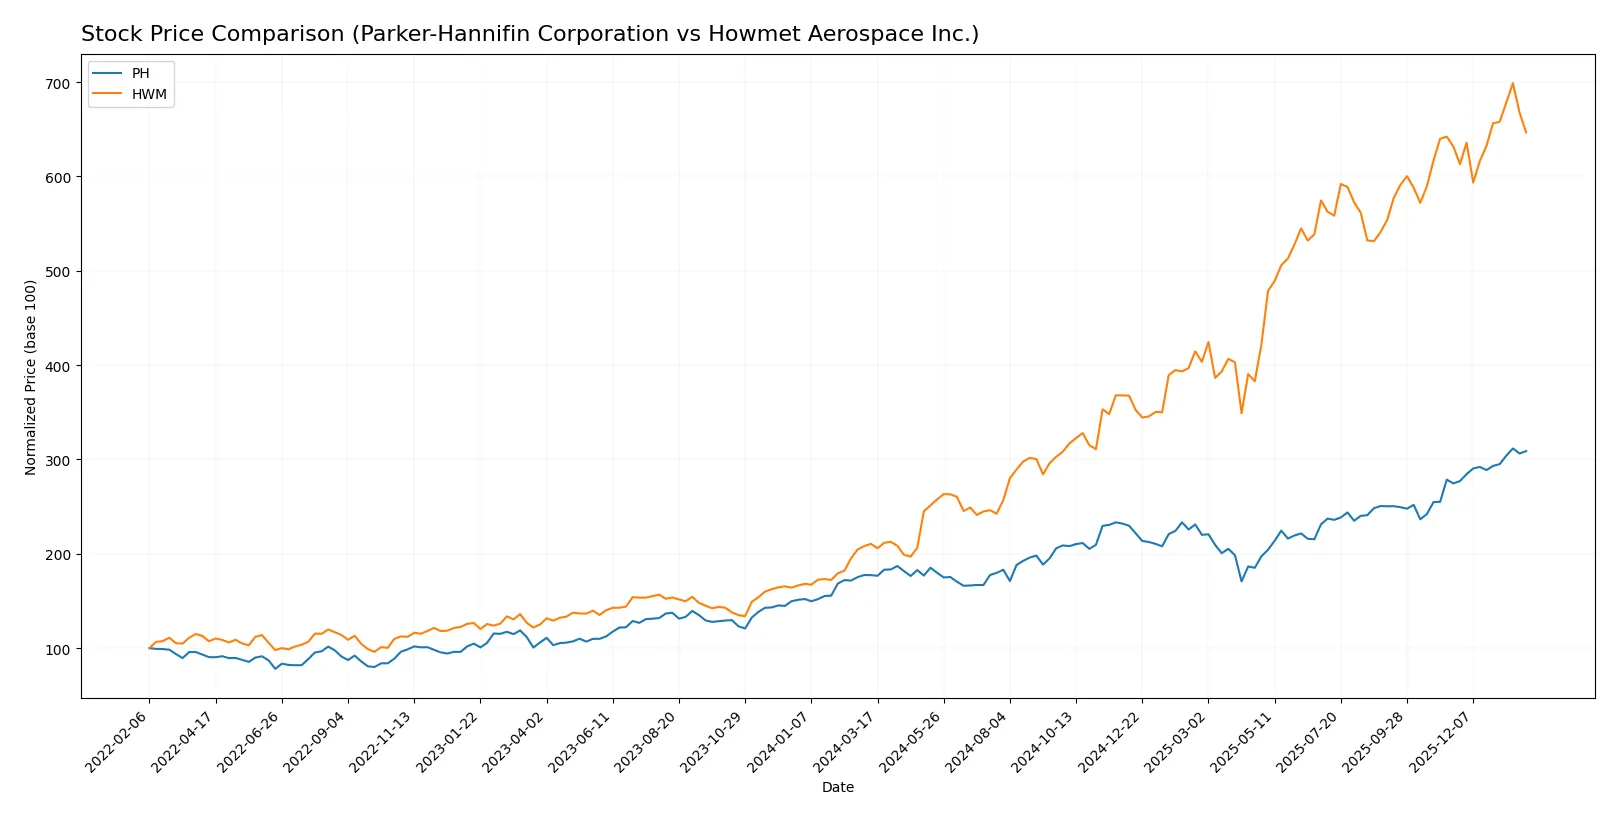
Over the past year, both Parker-Hannifin Corporation and Howmet Aerospace Inc. showed strong price appreciation with accelerating momentum, reflecting robust investor interest and significant upward trading dynamics.
Trend Comparison
Parker-Hannifin’s stock gained 74.16% over the past year, marking a bullish trend with accelerating price momentum and a high volatility of 112.58. The price ranged between 503.3 and 944.27.
Howmet Aerospace’s stock surged 207.17% in the same period, also bullish with acceleration but lower volatility at 47.72. The price moved from 63.41 to a peak of 224.89.
Howmet Aerospace outperformed Parker-Hannifin, delivering the highest market returns with a more than doubling of its stock price over the last year.
Target Prices
Analysts present a cautiously optimistic consensus for Parker-Hannifin Corporation and Howmet Aerospace Inc.
| Company | Target Low | Target High | Consensus |
|---|---|---|---|
| Parker-Hannifin Corporation | 825 | 1,139 | 995.46 |
| Howmet Aerospace Inc. | 205 | 258 | 234.25 |
The consensus target prices suggest upside potential of about 6% for Parker-Hannifin versus its current 936 price. Howmet Aerospace shows a roughly 12% expected gain from 208. Both stocks attract moderate analyst confidence amid industrial sector dynamics.

Don’t Let Luck Decide Your Entry Point
Optimize your entry points with our advanced ProRealTime indicators. You’ll get efficient buy signals with precise price targets for maximum performance. Start outperforming now!
How do institutions grade them?
The following tables summarize the latest institutional grades for Parker-Hannifin Corporation and Howmet Aerospace Inc.:
Parker-Hannifin Corporation Grades
This table lists recent grades assigned by major financial institutions to Parker-Hannifin Corporation.
| Grading Company | Action | New Grade | Date |
|---|---|---|---|
| Wells Fargo | Maintain | Overweight | 2026-01-30 |
| Citigroup | Maintain | Buy | 2026-01-30 |
| JP Morgan | Maintain | Overweight | 2026-01-30 |
| Jefferies | Maintain | Buy | 2026-01-30 |
| Barclays | Maintain | Overweight | 2026-01-30 |
| Stifel | Maintain | Hold | 2026-01-30 |
| Stifel | Maintain | Hold | 2026-01-23 |
| JP Morgan | Maintain | Overweight | 2026-01-16 |
| Morgan Stanley | Maintain | Equal Weight | 2026-01-14 |
| Barclays | Maintain | Overweight | 2026-01-07 |
Howmet Aerospace Inc. Grades
This table presents recent institutional grades assigned to Howmet Aerospace Inc.
| Grading Company | Action | New Grade | Date |
|---|---|---|---|
| Citigroup | Maintain | Buy | 2026-01-13 |
| B of A Securities | Maintain | Buy | 2025-11-14 |
| JP Morgan | Maintain | Overweight | 2025-11-10 |
| Goldman Sachs | Maintain | Buy | 2025-11-03 |
| BTIG | Maintain | Buy | 2025-11-03 |
| RBC Capital | Maintain | Outperform | 2025-10-31 |
| TD Cowen | Maintain | Buy | 2025-10-31 |
| UBS | Maintain | Neutral | 2025-10-31 |
| Truist Securities | Maintain | Buy | 2025-10-15 |
| Susquehanna | Maintain | Positive | 2025-10-09 |
Which company has the best grades?
Parker-Hannifin mostly receives Overweight and Buy ratings, with a few Hold and Equal Weight grades. Howmet Aerospace enjoys predominantly Buy and Outperform grades, with one Neutral. Howmet’s broader buy-side enthusiasm suggests stronger institutional confidence, potentially influencing investor sentiment more favorably toward it.
Risks specific to each company
In 2026, these categories highlight the critical pressure points and systemic threats facing Parker-Hannifin Corporation and Howmet Aerospace Inc.:
1. Market & Competition
Parker-Hannifin Corporation
- Faces intense competition in diversified industrial and aerospace sectors; market leadership depends on innovation and OEM relationships.
Howmet Aerospace Inc.
- Competes globally in aerospace and transportation with exposure to cyclical aerospace demand and reliance on advanced materials.
2. Capital Structure & Debt
Parker-Hannifin Corporation
- Maintains moderate leverage (D/E 0.69), with strong interest coverage (11.04x), signaling controlled financial risk.
Howmet Aerospace Inc.
- Slightly higher leverage (D/E 0.76) and lower interest coverage (8.6x), indicating marginally higher financial risk.
3. Stock Volatility
Parker-Hannifin Corporation
- Beta at 1.25 suggests moderate sensitivity to market swings, aligned with industrial sector averages.
Howmet Aerospace Inc.
- Beta at 1.29 indicates slightly higher volatility, reflecting sensitivity to aerospace sector cyclicality.
4. Regulatory & Legal
Parker-Hannifin Corporation
- Subject to aerospace and industrial compliance standards; potential risks from evolving environmental and trade regulations.
Howmet Aerospace Inc.
- Faces complex aerospace regulatory frameworks globally, with increased scrutiny on defense and export controls.
5. Supply Chain & Operations
Parker-Hannifin Corporation
- Diverse supply chain risks including raw material costs and global manufacturing disruptions; operational scale helps mitigate some risks.
Howmet Aerospace Inc.
- Heavily reliant on specialty materials and precision manufacturing; supply chain disruptions could severely impact production schedules.
6. ESG & Climate Transition
Parker-Hannifin Corporation
- Increasing pressure to reduce emissions and improve sustainability in products and operations; moderate progress reported.
Howmet Aerospace Inc.
- Strong focus on lightweight materials to reduce emissions; ESG initiatives critical to customer retention and regulatory compliance.
7. Geopolitical Exposure
Parker-Hannifin Corporation
- Global footprint exposes it to trade tensions, tariffs, and geopolitical instability, especially in aerospace markets.
Howmet Aerospace Inc.
- Greater exposure to international aerospace markets, including sensitive defense contracts, increasing geopolitical risk.
Which company shows a better risk-adjusted profile?
Parker-Hannifin’s most impactful risk is its exposure to diversified industrial competition and moderate financial leverage. Howmet’s largest risk lies in supply chain sensitivity and geopolitical exposure tied to aerospace and defense. Parker-Hannifin’s stronger interest coverage and broader operations suggest a marginally better risk-adjusted profile. Notably, Howmet’s higher beta and reliance on specialty materials amplify market and operational risks, justifying caution.
Final Verdict: Which stock to choose?
Parker-Hannifin’s superpower lies in its durable economic moat, driven by a strong and growing ROIC well above its cost of capital. Its efficient capital allocation and robust profitability support sustainable value creation. A point of vigilance remains its moderate liquidity ratios, which could pressure short-term resilience. It suits portfolios targeting steady, aggressive growth backed by operational excellence.
Howmet Aerospace commands a strategic moat rooted in its specialized aerospace manufacturing niche and recurring revenue streams. Its balance sheet shows stronger liquidity, offering better short-term safety compared to Parker-Hannifin. This makes it appealing for investors seeking Growth at a Reasonable Price (GARP) with exposure to cyclical aerospace demand recovery.
If you prioritize durable competitive advantage and operational efficiency, Parker-Hannifin is the compelling choice due to its proven value creation and accelerating earnings growth. However, if you seek higher stability and exposure to aerospace growth cycles with a solid liquidity cushion, Howmet Aerospace offers better safety and robust margin expansion. Both present slightly favorable financial profiles but cater to distinct investor risk appetites.
Disclaimer: Investment carries a risk of loss of initial capital. The past performance is not a reliable indicator of future results. Be sure to understand risks before making an investment decision.
Go Further
I encourage you to read the complete analyses of Parker-Hannifin Corporation and Howmet Aerospace Inc. to enhance your investment decisions: