Home > Comparison > Industrials > HWM vs OTIS
The strategic rivalry between Howmet Aerospace Inc. and Otis Worldwide Corporation shapes the industrial machinery landscape. Howmet Aerospace operates as a capital-intensive manufacturer of aerospace components, while Otis focuses on high-margin elevator and escalator services. This analysis contrasts their growth dynamics and operational resilience, aiming to identify which company offers a superior risk-adjusted return for a diversified portfolio amid evolving industrial demands.
Table of contents
Companies Overview
Howmet Aerospace and Otis Worldwide are pivotal players shaping the industrial machinery landscape globally.
Howmet Aerospace Inc.: Advanced Engineered Solutions Leader
Howmet Aerospace dominates aerospace and transportation industries by delivering engine products, fastening systems, and engineered structures. It earns primarily from aircraft engine components and forged wheels for heavy trucks. In 2026, the company emphasizes innovation across its four segments to sustain leadership in high-performance aerospace materials and components.
Otis Worldwide Corporation: Elevator and Escalator Innovator
Otis Worldwide excels in manufacturing and servicing elevators, escalators, and moving walkways worldwide. Its revenue stems from new equipment sales and extensive service contracts with a vast network of 34,000 mechanics. The firm’s 2026 strategy focuses on expanding service offerings and modernization to maintain infrastructure dominance.
Strategic Collision: Similarities & Divergences
Both firms operate in industrial machinery but diverge sharply: Howmet pursues high-precision aerospace components, whereas Otis targets vertical transportation systems. Their primary battleground lies in engineering excellence and customer service scope. Howmet offers a capital-intensive, innovation-driven profile; Otis provides stable recurring revenue through service, reflecting distinct investment appeals.
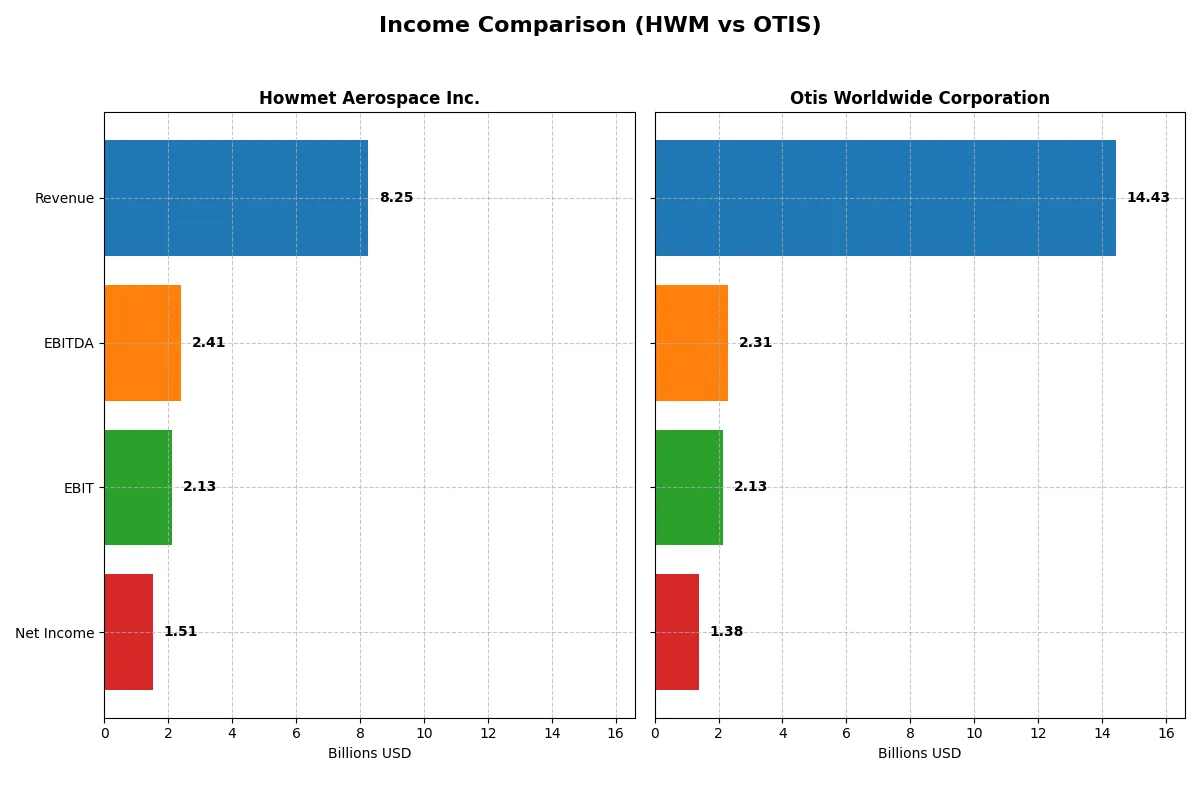
Income Statement Comparison
This data dissects the core profitability and scalability of both corporate engines to reveal who dominates the bottom line:
| Metric | Howmet Aerospace Inc. (HWM) | Otis Worldwide Corporation (OTIS) |
|---|---|---|
| Revenue | 8.25B | 14.43B |
| Cost of Revenue | 5.72B | 10.06B |
| Operating Expenses | 407M | 2.24B |
| Gross Profit | 2.54B | 4.37B |
| EBITDA | 2.41B | 2.31B |
| EBIT | 2.13B | 2.13B |
| Interest Expense | 151M | 196M |
| Net Income | 1.51B | 1.38B |
| EPS | 3.73 | 3.53 |
| Fiscal Year | 2025 | 2025 |
Income Statement Analysis: The Bottom-Line Duel
This income statement comparison reveals which company runs a more efficient and profitable corporate engine over recent years.
Howmet Aerospace Inc. Analysis
Howmet Aerospace grew revenue from 5.0B in 2021 to 8.3B in 2025, with net income surging from 256M to 1.5B. Gross and net margins expanded to 30.7% and 18.3%, respectively. In 2025, Howmet’s strong 25.8% EBIT margin and 32% EPS growth highlight accelerating operational efficiency and robust momentum.
Otis Worldwide Corporation Analysis
Otis posted revenue growth from 14.3B in 2021 to 14.4B in 2025, with net income rising from 1.2B to 1.4B. Gross margin held steady near 30%, but net margin remained modest at 9.6%. In 2025, Otis’s EBIT margin of 14.8% and slight revenue growth reflect stable but slower operational progression compared to Howmet.
Margin Excellence vs. Scale Stability
Howmet Aerospace delivers superior margin expansion and rapid bottom-line growth, outpacing Otis in profitability and efficiency gains. Otis maintains larger top-line scale with consistent gross margins but lags in net margin and EPS momentum. Investors seeking strong margin improvement and earnings leverage may find Howmet’s profile more compelling.
Financial Ratios Comparison
These vital ratios act as a diagnostic tool to expose the underlying fiscal health, valuation premiums, and capital efficiency of these companies:
| Ratios | Howmet Aerospace Inc. (HWM) | Otis Worldwide Corporation (OTIS) |
|---|---|---|
| ROE | 28.17% | -25.67% |
| ROIC | 18.19% | 39.59% |
| P/E | 54.93 | 24.85 |
| P/B | 15.47 | -6.38 |
| Current Ratio | 2.13 | 0.85 |
| Quick Ratio | 1.09 | 0.77 |
| D/E (Debt-to-Equity) | 0.57 | -1.62 |
| Debt-to-Assets | 27.28% | 82.14% |
| Interest Coverage | 14.11 | 10.88 |
| Asset Turnover | 0.74 | 1.35 |
| Fixed Asset Turnover | 3.18 | 11.13 |
| Payout Ratio | 12.00% | 46.75% |
| Dividend Yield | 0.22% | 1.88% |
| Fiscal Year | 2025 | 2025 |
Efficiency & Valuation Duel: The Vital Signs
Ratios act as a company’s DNA, exposing hidden risks and operational strengths that raw numbers often obscure.
Howmet Aerospace Inc.
Howmet Aerospace posts a strong 28.17% ROE and an 18.27% net margin, signaling robust profitability. Its elevated P/E of 54.93 and P/B of 15.47 mark the stock as expensive and stretched. Dividend yield is low at 0.22%, suggesting a focus on reinvestment over payouts, likely funding growth and innovation.
Otis Worldwide Corporation
Otis shows a negative ROE at -25.67%, reflecting profitability challenges despite a healthy 39.59% ROIC. Its P/E of 24.85 is moderate, implying reasonable valuation. The company yields 1.88% in dividends but suffers from liquidity issues, with current and quick ratios below 1, indicating operational strain.
Premium Valuation vs. Operational Safety
Howmet Aerospace offers superior profitability and financial stability but at a premium valuation, increasing risk. Otis presents a mixed profile, with strong capital returns but weaker profitability and liquidity. Investors seeking stability may lean toward Howmet; those targeting value with growth risks might consider Otis.
Which one offers the Superior Shareholder Reward?
I compare Howmet Aerospace Inc. (HWM) and Otis Worldwide Corporation (OTIS) on dividends and buybacks. HWM yields a modest 0.22% with a low 12% payout ratio, signaling ample free cash flow reinvestment. OTIS offers a stronger 1.88% yield but pays nearly 47% of earnings as dividends. Both maintain robust buyback programs, yet HWM’s buybacks align better with sustainable capital allocation given its healthier free cash flow coverage and lower leverage. Historically, I’ve observed that moderate payouts with disciplined buybacks, like HWM’s, tend to deliver superior long-term total returns. Therefore, I favor HWM’s shareholder reward model over OTIS in 2026.
Comparative Score Analysis: The Strategic Profile
The radar chart reveals the fundamental DNA and trade-offs of Howmet Aerospace Inc. and Otis Worldwide Corporation:
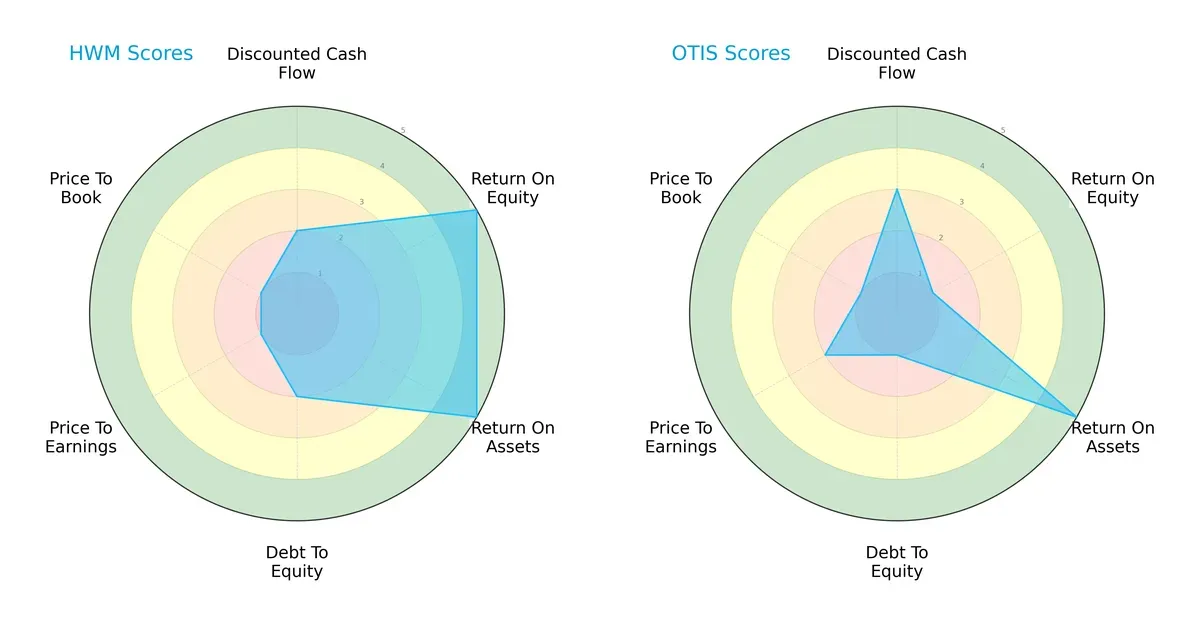
Howmet Aerospace shows strength in profitability metrics with top ROE and ROA scores (5 each), but struggles with valuation and leverage, scoring very low on P/E and P/B (1) and debt-to-equity (2). Otis Worldwide has a more balanced, albeit weaker, profile with moderate DCF (3) and P/E (2) scores but suffers from poor ROE (1) and debt-to-equity (1). I see Howmet relying heavily on operational efficiency, while Otis presents a more cautious financial risk stance, though with less profitability.
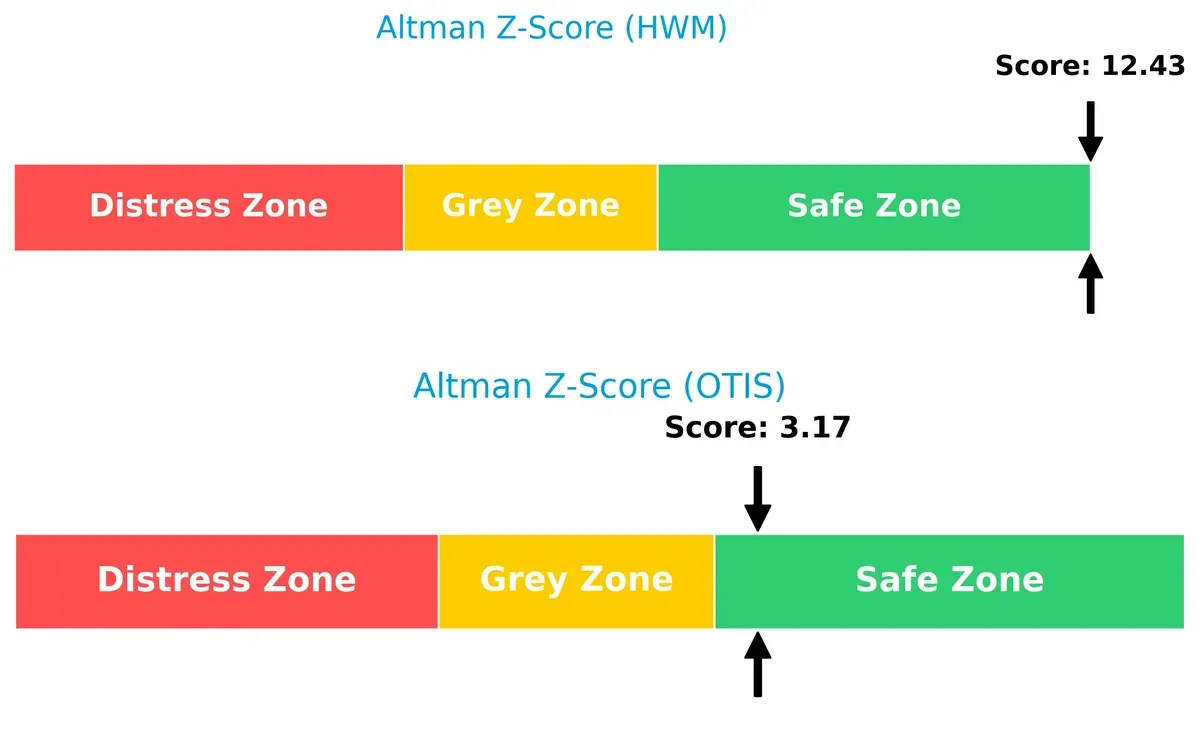
Bankruptcy Risk: Solvency Showdown
Howmet Aerospace’s Altman Z-Score of 12.4 far exceeds Otis Worldwide’s 3.17, indicating a significantly stronger solvency position. Both firms reside in the safe zone, but Howmet’s superior score suggests it is far better insulated against long-term bankruptcy risks in this cycle:
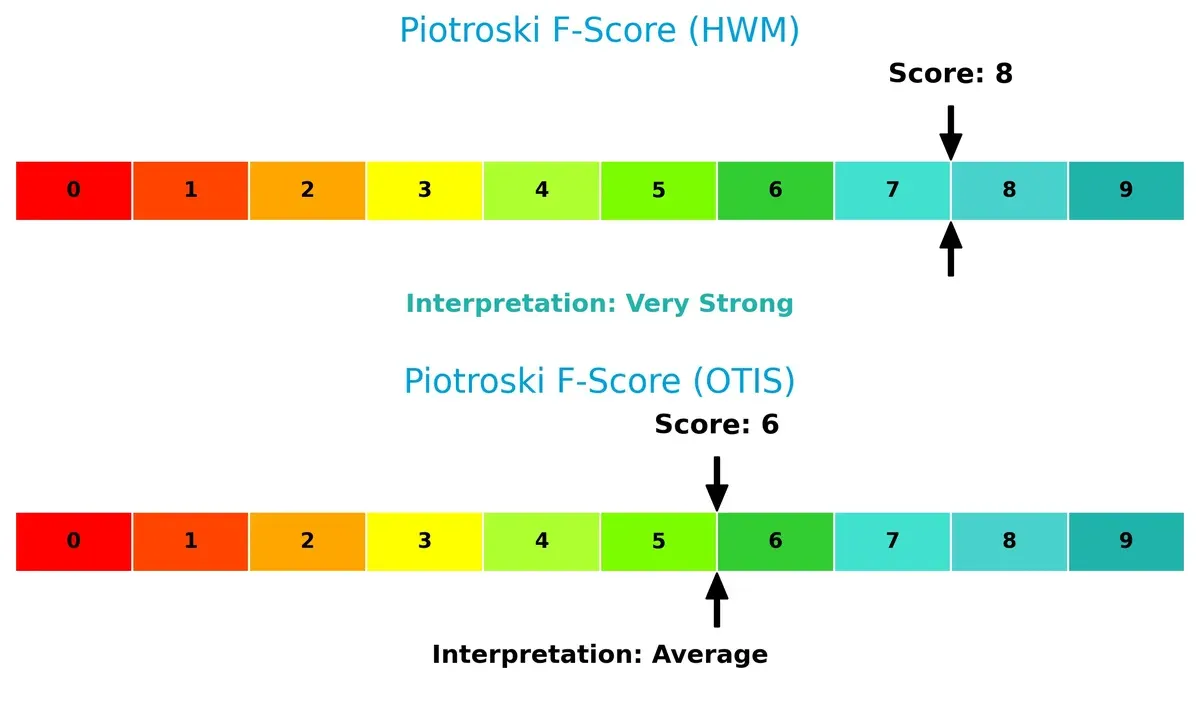
Financial Health: Quality of Operations
Howmet Aerospace’s Piotroski F-Score of 8 signals very strong financial health, outperforming Otis Worldwide’s 6, which is average. This gap reflects Howmet’s superior operational quality and internal metrics, while Otis shows potential red flags that warrant caution:
How are the two companies positioned?
This section dissects Howmet Aerospace and Otis Worldwide’s operational DNA by comparing revenue distribution and internal strengths and weaknesses. The goal is to confront their economic moats and identify which model offers the most resilient, sustainable competitive advantage today.
Revenue Segmentation: The Strategic Mix
The following visual comparison dissects how both firms diversify their income streams and where their primary sector bets lie:
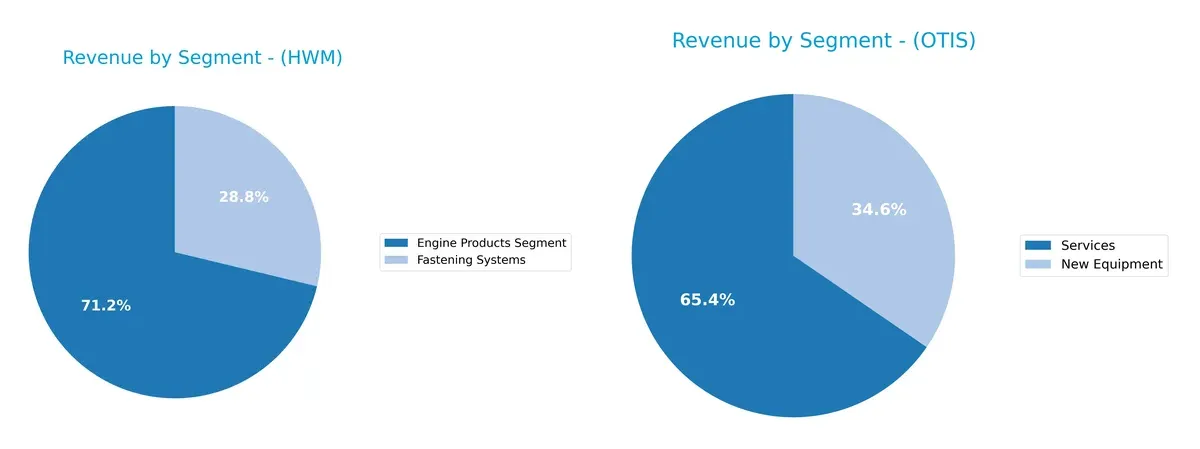
Howmet Aerospace Inc. (HWM) splits revenue between Engine Products ($4.33B) and Fastening Systems ($1.75B), showing moderate diversification with a clear anchor in engine components. Otis Worldwide Corporation (OTIS) leans heavily on Services ($9.44B) over New Equipment ($4.99B), signaling a stable, recurring revenue model. HWM’s focus on aerospace components risks cyclicality, while OTIS exploits ecosystem lock-in through steady maintenance contracts.
Strengths and Weaknesses Comparison
This table compares the Strengths and Weaknesses of Howmet Aerospace Inc. (HWM) and Otis Worldwide Corporation (OTIS):
HWM Strengths
- High net margin at 18.27%
- Strong ROE of 28.17%
- Favorable ROIC at 18.19%
- Solid current and quick ratios above 1.0
- Diverse product segments including Engine and Fastening Systems
- Significant revenue from the United States and Europe
OTIS Strengths
- Exceptional ROIC at 39.59% surpassing WACC
- Favorable WACC at 7.23%
- Strong fixed asset turnover of 11.13
- High asset turnover at 1.35
- Large Services segment revenue of 9.4B
- Substantial presence in China and diversified global footprint
HWM Weaknesses
- Elevated PE ratio at 54.93 signals overvaluation risk
- High PB ratio at 15.47
- Dividend yield low at 0.22%
- Neutral debt-to-equity at 0.57 and asset turnover at 0.74
- Heavy reliance on US market with limited diversification outside North America and Europe
OTIS Weaknesses
- Negative ROE at -25.67% indicates profitability challenges
- Low current ratio 0.85 and quick ratio 0.77 raise liquidity concerns
- High debt to assets at 82.14% signals leverage risk
- Negative debt-to-equity ratio is unusual and requires scrutiny
- PE ratio moderate but no clear pricing advantage
Both companies show strengths in profitability metrics, but HWM excels in profitability and liquidity, while OTIS leads in capital efficiency and service revenue. HWM’s valuation and geographic concentration pose risks. OTIS faces challenges in profitability and liquidity despite strong operational efficiency. These contrasts highlight differing strategic priorities and financial profiles.
The Moat Duel: Analyzing Competitive Defensibility
A structural moat protects long-term profits from relentless competition erosion. Only durable moats withstand market pressures and preserve value:
Howmet Aerospace Inc.: Engineering Precision and Cost Advantage
Howmet’s moat stems from advanced engineered solutions and cost leadership in aerospace components. It shows in a robust 25.8% EBIT margin and 18.3% net margin. Expanding into new aerospace markets in 2026 could deepen its competitive edge.
Otis Worldwide Corporation: Service Network and Customer Lock-in
Otis relies on an extensive service network and recurring maintenance contracts, creating strong switching costs. Its moat delivers consistent returns with a 14.8% EBIT margin. Growth opportunities lie in modernization services and emerging markets expansion.
Cost Leadership vs. Service Lock-in: The Moat Showdown
Both firms sustain very favorable moats with growing ROIC well above WACC. Howmet’s broader margin advantage signals a wider moat. Otis’s dependable service network ensures a deep, sticky competitive position. Howmet is better positioned to defend and grow profits amid rising competitive pressures.
Which stock offers better returns?
The past year reveals stark contrasts: Howmet Aerospace Inc. surged sharply, showing strong buyer dominance, while Otis Worldwide Corporation faced a modest decline with neutral trading dynamics.
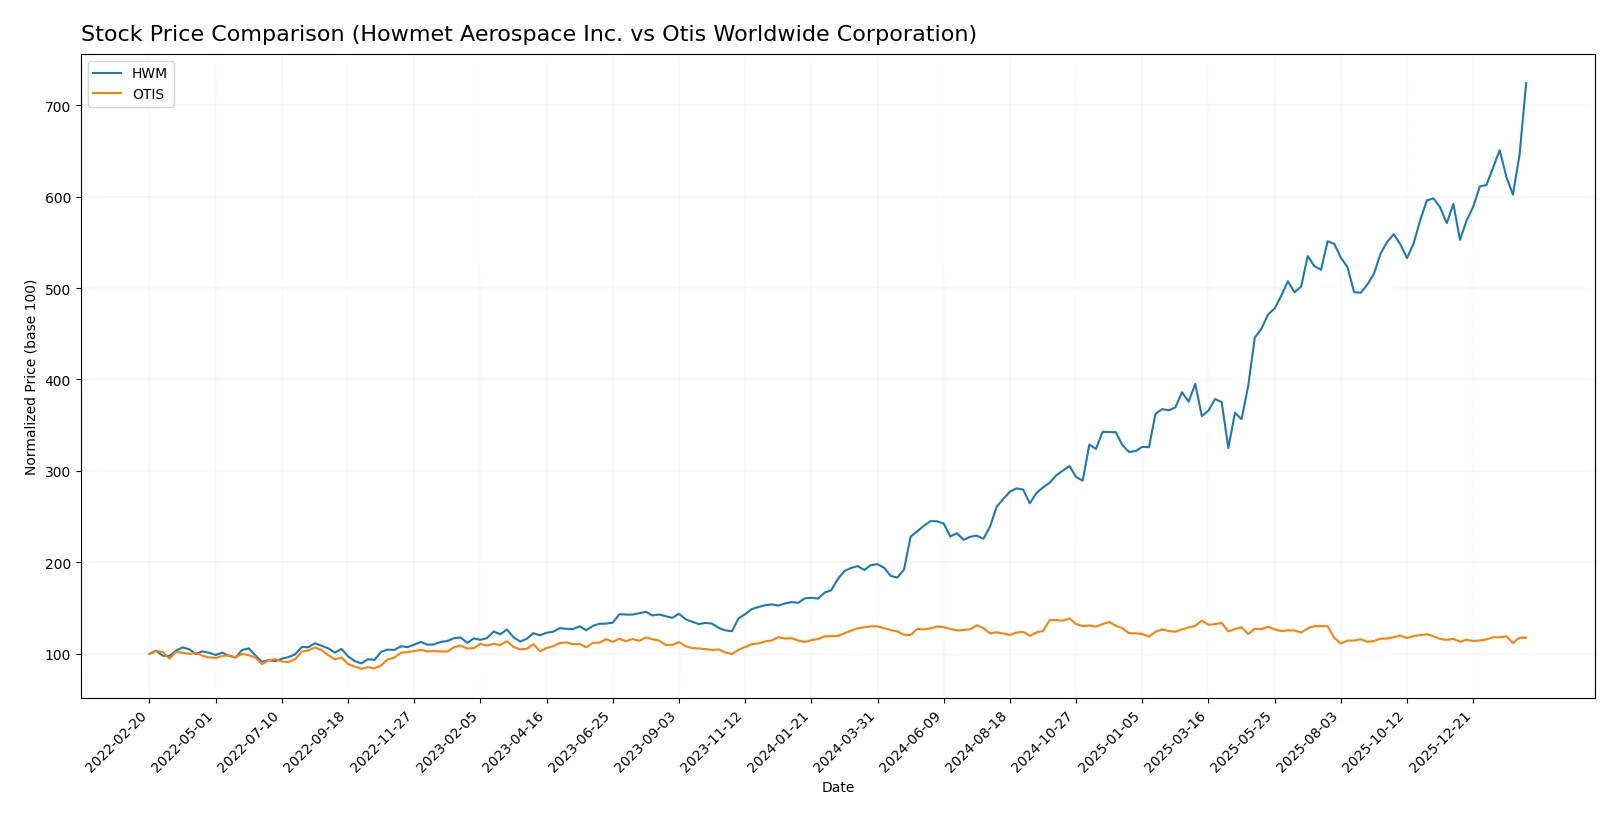
Trend Comparison
Howmet Aerospace’s stock rose 267.42% over 12 months, signaling a strong bullish trend with accelerating momentum and high volatility, peaking at 250.21.
Otis Worldwide’s shares declined 9.57%, reflecting a bearish trend with accelerating losses and low volatility, hitting a high of 106.01 and a low near 84.93.
Howmet Aerospace outperformed Otis Worldwide, delivering the highest market return by a wide margin over the past year.
Target Prices
Analysts present a moderately bullish consensus on Howmet Aerospace Inc. and Otis Worldwide Corporation, reflecting confidence in their industrial machinery prospects.
| Company | Target Low | Target High | Consensus |
|---|---|---|---|
| Howmet Aerospace Inc. | 209 | 290 | 260 |
| Otis Worldwide Corporation | 92 | 109 | 98 |
Howmet Aerospace’s consensus target of 260 slightly exceeds its current price of 250, suggesting modest upside. Otis’s target consensus at 98 also indicates potential appreciation from the current 89.83 price level.

Don’t Let Luck Decide Your Entry Point
Optimize your entry points with our advanced ProRealTime indicators. You’ll get efficient buy signals with precise price targets for maximum performance. Start outperforming now!
How do institutions grade them?
Howmet Aerospace Inc. Grades
The following table summarizes institutional grades and recommendations for Howmet Aerospace Inc.:
| Grading Company | Action | New Grade | Date |
|---|---|---|---|
| Susquehanna | maintain | Positive | 2026-02-13 |
| Citigroup | maintain | Buy | 2026-01-13 |
| B of A Securities | maintain | Buy | 2025-11-14 |
| JP Morgan | maintain | Overweight | 2025-11-10 |
| BTIG | maintain | Buy | 2025-11-03 |
| Goldman Sachs | maintain | Buy | 2025-11-03 |
| TD Cowen | maintain | Buy | 2025-10-31 |
| RBC Capital | maintain | Outperform | 2025-10-31 |
| UBS | maintain | Neutral | 2025-10-31 |
| Truist Securities | maintain | Buy | 2025-10-15 |
Otis Worldwide Corporation Grades
The following table summarizes institutional grades and recommendations for Otis Worldwide Corporation:
| Grading Company | Action | New Grade | Date |
|---|---|---|---|
| JP Morgan | maintain | Overweight | 2026-01-16 |
| Wells Fargo | maintain | Equal Weight | 2025-12-15 |
| Barclays | maintain | Underweight | 2025-10-30 |
| JP Morgan | maintain | Overweight | 2025-10-15 |
| Wolfe Research | upgrade | Outperform | 2025-10-08 |
| Wells Fargo | maintain | Equal Weight | 2025-10-06 |
| JP Morgan | maintain | Overweight | 2025-09-18 |
| RBC Capital | maintain | Outperform | 2025-07-28 |
| Wolfe Research | upgrade | Peer Perform | 2025-07-25 |
| JP Morgan | maintain | Overweight | 2025-07-24 |
Which company has the best grades?
Howmet Aerospace displays consistently strong buy and outperform ratings from top-tier firms, signaling robust institutional confidence. Otis Worldwide’s grades show mixed sentiment, including underweight and equal weight ratings, reflecting more cautious views. Investors may interpret Howmet’s higher consensus grades as a stronger endorsement of its near-term prospects.
Risks specific to each company
The following categories identify the critical pressure points and systemic threats facing both firms in the 2026 market environment:
1. Market & Competition
Howmet Aerospace Inc.
- Faces intense competition in aerospace materials and engineered solutions, exposed to cyclical industrial demand.
Otis Worldwide Corporation
- Operates in the elevator/escalator market with steady service demand but faces competitive pressure in modernization projects.
2. Capital Structure & Debt
Howmet Aerospace Inc.
- Maintains moderate leverage (D/E 0.57), with strong interest coverage (14.11x) supporting financial flexibility.
Otis Worldwide Corporation
- Exhibits high leverage (D/A 82%), weaker liquidity (current ratio 0.85), raising solvency concerns.
3. Stock Volatility
Howmet Aerospace Inc.
- Displays above-market beta (1.25), indicating higher sensitivity to market swings.
Otis Worldwide Corporation
- Shows near-market beta (1.01), implying more stable stock price movements.
4. Regulatory & Legal
Howmet Aerospace Inc.
- Aerospace sector exposed to strict safety and export regulations globally, increasing compliance costs.
Otis Worldwide Corporation
- Subject to building codes and safety regulations, with regulatory risk tied to infrastructure spending cycles.
5. Supply Chain & Operations
Howmet Aerospace Inc.
- Complex global supply chain for aerospace materials vulnerable to geopolitical tensions and raw material costs.
Otis Worldwide Corporation
- Extensive service network with operational risks in maintenance logistics and parts availability.
6. ESG & Climate Transition
Howmet Aerospace Inc.
- High exposure to environmental regulations on emissions and sustainable materials in aerospace manufacturing.
Otis Worldwide Corporation
- Faces pressure to improve energy efficiency in products and operations amid tightening ESG standards.
7. Geopolitical Exposure
Howmet Aerospace Inc.
- Operates internationally, exposed to trade tensions and export controls affecting aerospace sector.
Otis Worldwide Corporation
- Global footprint with moderate geopolitical risk, mainly through infrastructure project dependencies.
Which company shows a better risk-adjusted profile?
Howmet Aerospace’s key risk is market cyclicality combined with regulatory complexity, balanced by robust financial strength and liquidity. Otis struggles with high leverage and weak liquidity, elevating financial distress risk despite stable market positioning. Howmet’s Altman Z-Score (12.4) and strong Piotroski Score (8) highlight resilience, unlike Otis’s borderline safe Z-Score (3.17) and average Piotroski (6). Given these factors, Howmet Aerospace presents a superior risk-adjusted profile in 2026.
Final Verdict: Which stock to choose?
Howmet Aerospace Inc. (HWM) impresses with its unmatched efficiency in capital allocation, delivering rising returns well above its cost of capital. Its strength lies in consistent profitability and robust cash flow generation. A point of vigilance remains its stretched valuation multiples, which could expose investors to re-rating risks. HWM suits investors seeking aggressive growth fueled by operational excellence.
Otis Worldwide Corporation (OTIS) boasts a strategic moat centered on capital-light operations and high returns on invested capital. Its recurring cash flow profile offers a safety cushion relative to HWM’s more volatile aerospace exposure. However, OTIS carries risks from elevated leverage and a weaker liquidity position. It fits portfolios targeting growth at a reasonable price with a bias toward stability.
If you prioritize high-growth potential backed by strong capital efficiency and can tolerate valuation risk, Howmet Aerospace outshines as the compelling choice. However, if you seek better stability with a durable moat and moderate valuation, Otis offers superior defensive qualities despite some financial leverage concerns. Each presents an analytical scenario aligned to distinct investor risk appetites and return horizons.
Disclaimer: Investment carries a risk of loss of initial capital. The past performance is not a reliable indicator of future results. Be sure to understand risks before making an investment decision.
Go Further
I encourage you to read the complete analyses of Howmet Aerospace Inc. and Otis Worldwide Corporation to enhance your investment decisions: