Howmet Aerospace Inc. (HWM) and Kadant Inc. (KAI) are two prominent players in the industrial machinery sector, each driving innovation in engineered solutions and systems. Howmet focuses on aerospace components and transportation, while Kadant specializes in fluid-handling and material processing technologies. This comparison explores their market positioning and growth strategies to help you identify which company offers the most compelling investment opportunity today.
Table of contents
Companies Overview
I will begin the comparison between Howmet Aerospace Inc. and Kadant Inc. by providing an overview of these two companies and their main differences.
Howmet Aerospace Inc. Overview
Howmet Aerospace Inc. specializes in advanced engineered solutions for the aerospace and transportation industries, operating globally across multiple countries. The company serves through four segments: Engine Products, Fastening Systems, Engineered Structures, and Forged Wheels, focusing on components such as airfoils, fastening systems, and forged aluminum wheels. Headquartered in Pittsburgh, it is a key player in industrial machinery with a market cap of 87.6B USD.
Kadant Inc. Overview
Kadant Inc. provides technologies and engineered systems worldwide, operating through Flow Control, Industrial Processing, and Material Handling segments. Its products include fluid-handling systems, industrial automation, and conveying equipment primarily for packaging, tissue, wood products, and alternative fuel industries. Based in Westford, Massachusetts, Kadant has a market cap of 3.73B USD and focuses on diverse industrial machinery solutions.
Key similarities and differences
Both Howmet Aerospace and Kadant operate within the industrial machinery sector and supply engineered components globally. Howmet Aerospace has a broader aerospace and transportation focus with higher market capitalization and global reach, while Kadant specializes in fluid handling, industrial processing, and material handling with a smaller workforce and market cap. Their business models differ in product segmentation and industry applications, reflecting distinct market niches.
Income Statement Comparison
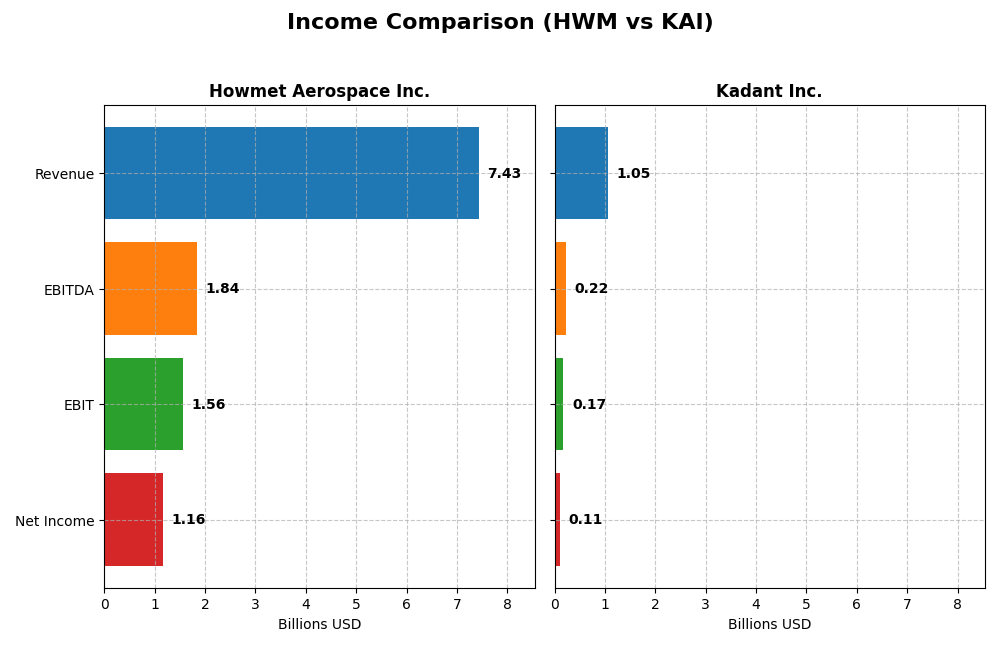
The table below presents a side-by-side comparison of key income statement figures for Howmet Aerospace Inc. and Kadant Inc. for the fiscal year 2024.
| Metric | Howmet Aerospace Inc. (HWM) | Kadant Inc. (KAI) |
|---|---|---|
| Market Cap | 87.6B | 3.7B |
| Revenue | 7.43B | 1.05B |
| EBITDA | 1.84B | 223M |
| EBIT | 1.57B | 173M |
| Net Income | 1.16B | 112M |
| EPS | 2.83 | 9.51 |
| Fiscal Year | 2024 | 2024 |
Income Statement Interpretations
Howmet Aerospace Inc.
Howmet Aerospace’s revenue and net income have shown consistent growth from 2020 to 2024, with revenue rising from $5.26B to $7.43B and net income increasing markedly from $209M to $1.16B. Margins have improved significantly, with a gross margin of 27.62% and net margin of 15.55% in 2024. The latest year saw strong growth momentum, including a 11.9% revenue rise and a 34.93% increase in net margin.
Kadant Inc.
Kadant demonstrated solid revenue growth from $635M in 2020 to $1.05B in 2024, with net income also increasing from $55M to $112M over the same period. Margins remain stable, highlighted by a gross margin of 44.25% and a net margin of 10.59% in 2024. However, the most recent year showed mixed signals, with a 9.99% revenue increase but a 12.59% decline in net margin and a slight drop in EPS by 4.24%.
Which one has the stronger fundamentals?
Howmet Aerospace exhibits stronger fundamentals with robust margin improvements, higher absolute net income, and faster growth rates in earnings and margins over the period. Kadant, while showing favorable revenue growth and strong gross margins, faces recent margin compression and slower earnings growth. Overall, Howmet’s consistent margin expansion and superior net income growth suggest a more favorable income statement profile.
Financial Ratios Comparison
The table below presents key financial ratios for Howmet Aerospace Inc. (HWM) and Kadant Inc. (KAI) based on their most recent fiscal year, 2024, providing a snapshot of profitability, liquidity, leverage, efficiency, and dividend metrics.
| Ratios | Howmet Aerospace Inc. (HWM) | Kadant Inc. (KAI) |
|---|---|---|
| ROE | 25.36% | 13.17% |
| ROIC | 15.49% | 10.08% |
| P/E | 38.63 | 36.90 |
| P/B | 9.80 | 4.86 |
| Current Ratio | 2.17 | 2.31 |
| Quick Ratio | 0.98 | 1.55 |
| D/E (Debt-to-Equity) | 0.76 | 0.38 |
| Debt-to-Assets | 33.00% | 22.57% |
| Interest Coverage | 9.19 | 8.55 |
| Asset Turnover | 0.71 | 0.74 |
| Fixed Asset Turnover | 2.92 | 6.18 |
| Payout Ratio | 9.44% | 13.15% |
| Dividend Yield | 0.24% | 0.36% |
Interpretation of the Ratios
Howmet Aerospace Inc.
Howmet Aerospace shows mostly favorable profitability ratios with a strong 25.36% ROE and 15.55% net margin, but its valuation metrics like PE (38.63) and PB (9.8) are less attractive. Liquidity and coverage ratios are adequate, though quick ratio and debt levels are neutral. The company pays a modest dividend with a low 0.24% yield, indicating cautious shareholder returns.
Kadant Inc.
Kadant presents a solid liquidity position with a current ratio of 2.31 and a low debt-to-equity ratio of 0.38, both favorable. Profitability ratios such as ROE (13.17%) and net margin (10.59%) are positive but less robust than Howmet’s. The PE ratio remains high at 36.9. Kadant pays dividends with a slightly higher 0.36% yield, demonstrating some shareholder return despite some valuation concerns.
Which one has the best ratios?
Kadant holds an edge with a higher proportion of favorable ratios (57.14%) compared to Howmet’s 35.71%, especially in liquidity and leverage metrics. However, Howmet outperforms in profitability measures. Both companies exhibit some unfavorable valuation indicators and low dividend yields, suggesting room for cautious assessment in investment decisions.
Strategic Positioning
This section compares the strategic positioning of Howmet Aerospace Inc. and Kadant Inc., including market position, key segments, and exposure to technological disruption:
Howmet Aerospace Inc.
- Leading global aerospace and transportation machinery player with strong competitive pressure
- Diverse segments: Engine Products, Fastening Systems, Engineered Structures, Forged Wheels driving revenue
- Operates in traditional aerospace and transportation sectors, limited explicit disruption exposure
Kadant Inc.
- Smaller industrial machinery supplier with moderate competition and niche focus
- Focus on Flow Control, Industrial Processing, and Material Handling segments
- Exposure to evolving industrial processing technologies but no direct disruption noted
Howmet Aerospace Inc. vs Kadant Inc. Positioning
Howmet has a diversified industrial portfolio across aerospace and transportation, providing broad business drivers and global reach. Kadant’s positioning is more concentrated on specialized industrial machinery segments, which may limit scale but focus on niche markets.
Which has the best competitive advantage?
Howmet Aerospace demonstrates a very favorable moat with a durable competitive advantage and growing profitability. Kadant holds a slightly favorable moat with increasing profitability but lacks a strong competitive advantage at present.
Stock Comparison
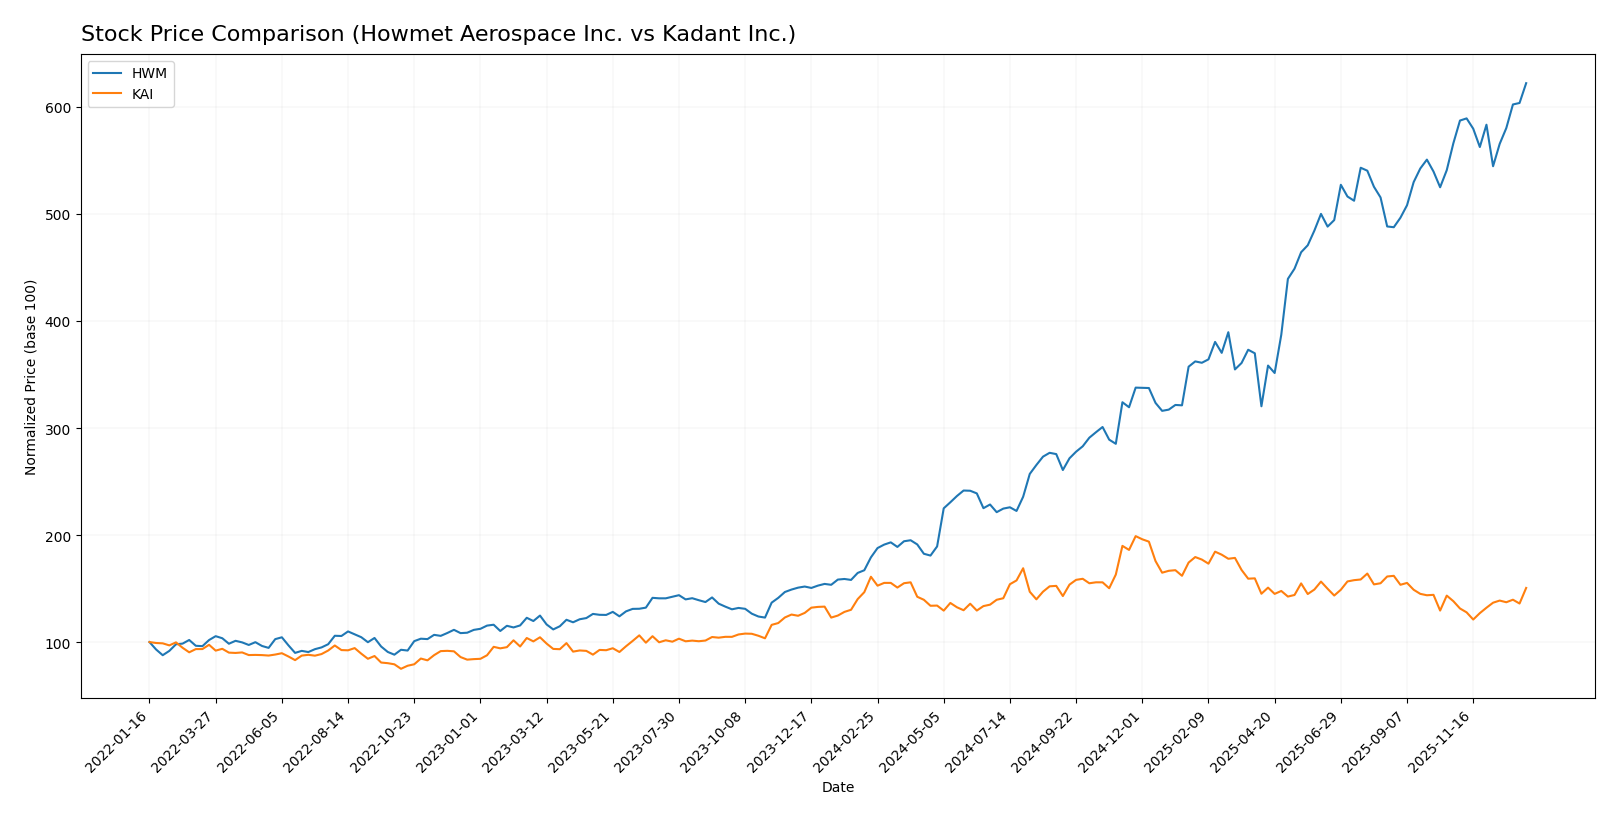
The stock price movements over the past year reveal contrasting dynamics, with Howmet Aerospace Inc. exhibiting a strong bullish trend despite decelerating growth, while Kadant Inc. shows a bearish trend with accelerating decline, both displaying notable price volatility.
Trend Analysis
Howmet Aerospace Inc. (HWM) recorded a 247.34% price increase over the past 12 months, indicating a bullish trend with decelerating momentum and a high price volatility (std deviation 47.0). The stock reached a low of 62.82 and peaked at 218.2.
Kadant Inc. (KAI) experienced a 6.49% price decline over the same period, characterizing a bearish trend with accelerating downward movement and moderate volatility (std deviation 34.44). Its price fluctuated between 254.91 and 419.01.
Comparing the two, Howmet Aerospace delivered significantly higher market performance with its strong bullish trend, while Kadant’s bearish trajectory resulted in a negative return over the last year.
Target Prices
The target consensus for Howmet Aerospace Inc. and Kadant Inc. reflects positive analyst expectations.
| Company | Target High | Target Low | Consensus |
|---|---|---|---|
| Howmet Aerospace Inc. | 258 | 205 | 231.75 |
| Kadant Inc. | 410 | 275 | 342.5 |
Analysts expect Howmet Aerospace’s stock to appreciate moderately above its current price of 217.7 USD, while Kadant’s consensus target suggests a notable upside from its 317.1 USD level.
Analyst Opinions Comparison
This section compares analysts’ ratings and grades for Howmet Aerospace Inc. and Kadant Inc.:
Rating Comparison
HWM Rating
- Rating: Both companies have a “B” rating, indicating very favorable analyst views.
- Discounted Cash Flow Score: HWM scores 2, signaling moderate valuation based on cash flow projections.
- ROE Score: HWM scores a high 5, showing very favorable efficiency in generating profit from equity.
- ROA Score: HWM has a top score of 5, reflecting very favorable asset utilization.
- Debt To Equity Score: HWM scores 2, suggesting moderate financial risk with some reliance on debt.
- Overall Score: Both HWM and KAI share an overall score of 3, a moderate rating of financial standing.
KAI Rating
- Rating: Both companies have a “B” rating, indicating very favorable analyst views.
- Discounted Cash Flow Score: KAI scores 3, slightly better at moderate valuation assessment.
- ROE Score: KAI scores 3, indicating moderate efficiency in profit generation.
- ROA Score: KAI scores 4, indicating favorable use of assets to generate earnings.
- Debt To Equity Score: KAI scores 3, showing moderate financial risk, slightly stronger balance sheet.
- Overall Score: Both HWM and KAI share an overall score of 3, a moderate rating of financial standing.
Which one is the best rated?
HWM and KAI both hold a “B” rating with overall scores of 3, indicating moderate financial standing. HWM excels in ROE and ROA, while KAI has a stronger discounted cash flow and debt-to-equity profile, balancing their respective strengths.
Scores Comparison
Here is a comparison of the financial health scores for Howmet Aerospace Inc. (HWM) and Kadant Inc. (KAI):
HWM Scores
- Altman Z-Score of 10.43 indicates a safe zone, signaling very low bankruptcy risk.
- Piotroski Score of 9 reflects very strong financial health and solid investment value.
KAI Scores
- Altman Z-Score of 5.59 places the company in a safe zone, indicating low bankruptcy risk.
- Piotroski Score of 7 indicates strong financial health and good investment potential.
Which company has the best scores?
Based on the provided data, HWM has higher scores in both Altman Z-Score and Piotroski Score compared to KAI. HWM’s scores indicate a safer financial position and stronger financial health than KAI.
Grades Comparison
Here is a comparison of the latest reliable grades for Howmet Aerospace Inc. and Kadant Inc.:
Howmet Aerospace Inc. Grades
The table below summarizes recent grades from reputable grading firms for Howmet Aerospace Inc.
| Grading Company | Action | New Grade | Date |
|---|---|---|---|
| B of A Securities | Maintain | Buy | 2025-11-14 |
| JP Morgan | Maintain | Overweight | 2025-11-10 |
| Goldman Sachs | Maintain | Buy | 2025-11-03 |
| BTIG | Maintain | Buy | 2025-11-03 |
| UBS | Maintain | Neutral | 2025-10-31 |
| RBC Capital | Maintain | Outperform | 2025-10-31 |
| TD Cowen | Maintain | Buy | 2025-10-31 |
| Truist Securities | Maintain | Buy | 2025-10-15 |
| Susquehanna | Maintain | Positive | 2025-10-09 |
| B of A Securities | Maintain | Buy | 2025-08-05 |
The overall trend for Howmet Aerospace Inc. grades is predominantly positive, with most firms maintaining Buy or Outperform ratings, reflecting confidence in the stock.
Kadant Inc. Grades
The table below shows recent grades from Barrington Research and DA Davidson for Kadant Inc.
| Grading Company | Action | New Grade | Date |
|---|---|---|---|
| Barrington Research | Maintain | Outperform | 2025-10-30 |
| Barrington Research | Maintain | Outperform | 2025-10-29 |
| Barrington Research | Maintain | Outperform | 2025-10-27 |
| Barrington Research | Maintain | Outperform | 2025-10-10 |
| Barrington Research | Maintain | Outperform | 2025-09-23 |
| DA Davidson | Maintain | Neutral | 2025-08-04 |
| Barrington Research | Maintain | Outperform | 2025-07-30 |
| Barrington Research | Maintain | Outperform | 2025-07-29 |
| DA Davidson | Maintain | Neutral | 2025-05-01 |
| Barrington Research | Maintain | Outperform | 2025-05-01 |
Kadant Inc.’s grades mainly reflect an Outperform consensus from Barrington Research, with a few Neutral ratings from DA Davidson, indicating a moderately favorable outlook.
Which company has the best grades?
Howmet Aerospace Inc. holds a stronger consensus with a majority of Buy and Outperform ratings, compared to Kadant Inc.’s mix of Outperform and Neutral grades. This suggests Howmet Aerospace has garnered broader analyst confidence, which may influence investor sentiment toward higher conviction.
Strengths and Weaknesses
Below is a comparative analysis of Howmet Aerospace Inc. (HWM) and Kadant Inc. (KAI) based on key criteria reflecting their current business and financial positions.
| Criterion | Howmet Aerospace Inc. (HWM) | Kadant Inc. (KAI) |
|---|---|---|
| Diversification | Broad aerospace portfolio: Engine Products $3.74B, Fastening Systems $1.58B, Structure Systems $1.08B (2024) | Focused on Capital equipment $360M and Parts & Consumables $694M (2024) |
| Profitability | High net margin 15.55%, ROIC 15.49%, ROE 25.36% (favorable) | Moderate net margin 10.59%, ROIC 10.08% (favorable), ROE 13.17% (neutral) |
| Innovation | Demonstrates durable competitive advantage with growing ROIC (+86%), strong value creation | Slightly favorable moat with growing ROIC (+31%), improving profitability but no strong moat yet |
| Global presence | Large global aerospace supplier with diverse product lines | More niche industrial segments with less global scale |
| Market Share | Leading in aerospace engineered products and fastening systems | Solid presence in papermaking and fiber-based products but smaller scale |
Key takeaways: Howmet Aerospace exhibits stronger overall financial health, diversification, and a very favorable competitive moat, making it a robust value creator in aerospace. Kadant shows favorable profitability and improving returns but remains more specialized with a slightly favorable moat, suggesting moderate risk and growth potential.
Risk Analysis
Below is a comparative overview of key risks for Howmet Aerospace Inc. (HWM) and Kadant Inc. (KAI) based on the most recent available data from 2024.
| Metric | Howmet Aerospace Inc. (HWM) | Kadant Inc. (KAI) |
|---|---|---|
| Market Risk | Beta 1.29 indicates moderate sensitivity to market swings. | Beta 1.25 shows similar moderate market volatility exposure. |
| Debt level | Debt-to-Equity 0.76, Debt-to-Assets 33% — moderate leverage with neutral risk. | Debt-to-Equity 0.38, Debt-to-Assets 22.6% — lower leverage, favorable risk profile. |
| Regulatory Risk | Exposure to aerospace and defense regulations in multiple countries. | Industrial machinery sector with moderate regulatory oversight. |
| Operational Risk | Complex global supply chains for aerospace components. | Diversified product segments reduce operational dependency risks. |
| Environmental Risk | Operations in metal forging and aerospace manufacturing may face environmental compliance challenges. | Involved in material handling and fluid systems, with potential environmental impacts in waste and emissions. |
| Geopolitical Risk | Significant international exposure including China and Europe, increasing geopolitical sensitivity. | Primarily US-based with less direct geopolitical exposure. |
The most impactful risks for Howmet Aerospace are geopolitical and regulatory due to its global aerospace footprint, while for Kadant, debt level and operational concerns are lower risks thanks to conservative leverage and segment diversification. Both companies maintain strong financial health, but investors should watch Howmet’s exposure to international market fluctuations and potential regulatory changes closely.
Which Stock to Choose?
Howmet Aerospace Inc. (HWM) shows a favorable income evolution with 41.3% revenue growth over 2020-2024 and strong profitability metrics, including a 15.55% net margin and 25.36% ROE. Its debt levels are moderate, with a net debt to EBITDA of 1.58, and its financial ratios are slightly favorable overall. The company holds a very favorable rating and demonstrates a very favorable moat with a durable competitive advantage.
Kadant Inc. (KAI) presents a favorable income evolution with 65.9% revenue growth over the period but mixed recent profitability trends, including a 10.59% net margin and a neutral 13.17% ROE. Its debt metrics are comparatively lower, reflected in a favorable debt to equity ratio of 0.38, and its financial ratios are favorable overall. The rating is very favorable, though with a slightly favorable moat indicating improving but yet limited competitive advantage.
Investors focused on growth might find Kadant’s higher revenue expansion appealing despite some recent profitability softness, while those prioritizing quality and durability of returns could view Howmet’s robust profitability, strong competitive moat, and very favorable rating as favorable indicators. Risk-averse investors may particularly note Howmet’s stable financial health and higher Altman Z-score.
Disclaimer: Investment carries a risk of loss of initial capital. The past performance is not a reliable indicator of future results. Be sure to understand risks before making an investment decision.
Go Further
I encourage you to read the complete analyses of Howmet Aerospace Inc. and Kadant Inc. to enhance your investment decisions: