Investors seeking stability and growth often turn to the packaged foods sector, where Hormel Foods Corporation (HRL) and The J. M. Smucker Company (SJM) stand out as industry leaders. Both firms share a strong market presence and a focus on innovation in consumer staples, making them natural competitors. This article will analyze their strengths and weaknesses to help you decide which company deserves a spot in your investment portfolio.
Table of contents
Companies Overview
I will begin the comparison between Hormel Foods Corporation and The J. M. Smucker Company by providing an overview of these two companies and their main differences.
Hormel Foods Corporation Overview
Hormel Foods Corporation is a leading player in the packaged foods industry, focusing on developing, processing, and distributing meat, nuts, and various food products. The company serves retail, foodservice, deli, and commercial customers primarily in the US and internationally. It operates through segments including Grocery Products and Refrigerated Foods, offering a broad portfolio under brands such as SKIPPY, SPAM, and Jennie-O.
The J. M. Smucker Company Overview
The J. M. Smucker Company manufactures and markets branded food and beverage products globally, operating in segments like U.S. Retail Pet Foods, Coffee, and Consumer Foods. It offers products ranging from coffee and peanut butter to pet foods under well-known brands including Folgers, Meow Mix, and Smucker’s. The company distributes through various retail and specialty channels worldwide.
Key similarities and differences
Both companies operate in the consumer defensive sector within the packaged foods industry and offer branded food products to retail customers. Hormel has a stronger emphasis on meat and perishable foods, while Smucker focuses more on coffee, spreads, and pet foods. Hormel’s workforce is larger at 20K employees versus Smucker’s 9K, and Hormel’s market cap is slightly higher at approximately 12.6B compared to Smucker’s 10.7B.
Income Statement Comparison
The table below presents a side-by-side comparison of the most recent fiscal year income statement metrics for Hormel Foods Corporation and The J. M. Smucker Company.

| Metric | Hormel Foods Corporation | The J. M. Smucker Company |
|---|---|---|
| Market Cap | 12.6B | 10.7B |
| Revenue | 12.11B | 8.73B |
| EBITDA | 1.01B | -156M |
| EBIT | 742M | -658M |
| Net Income | 478M | -1.23B |
| EPS | 0.87 | -11.57 |
| Fiscal Year | 2025 | 2025 |
Income Statement Interpretations
Hormel Foods Corporation
Hormel Foods showed modest revenue growth of 1.55% in 2025, reaching $12.1B, but net income declined significantly by 40.8% to $478M. Margins remained generally stable with a gross margin of 15.45% and net margin of 3.95%, both rated neutral. The latest year reflects a slowdown in profitability alongside lower gross profit and EBIT, signaling operational challenges.
The J. M. Smucker Company
Smucker’s revenue increased by 6.7% to $8.7B in 2025, with gross profit rising 8.6%, both viewed positively. However, net income plunged to a loss of $1.23B, sharply deteriorating margins to a negative 14.1% net margin and -7.5% EBIT margin. Despite revenue resilience, escalating expenses drove a deep net loss and negative earnings per share in 2025.
Which one has the stronger fundamentals?
Both companies faced unfavorable income statement trends overall, but Hormel’s profitability, though weakened, remained positive with stable margins. Smucker exhibited stronger revenue growth but suffered a severe net loss and negative margins, reflecting more acute financial distress. Hormel’s lower interest expense and positive net income suggest relatively stronger fundamentals compared to Smucker’s recent performance.
Financial Ratios Comparison
The table below compares key financial ratios for Hormel Foods Corporation (HRL) and The J. M. Smucker Company (SJM) based on their most recent fiscal year data.
| Ratios | Hormel Foods Corporation (HRL) | The J. M. Smucker Company (SJM) |
|---|---|---|
| ROE | 6.04% | -20.23% |
| ROIC | 4.31% | -5.09% |
| P/E | 24.84 | -10.05 |
| P/B | 1.50 | 2.03 |
| Current Ratio | 2.47 | 0.81 |
| Quick Ratio | 1.20 | 0.35 |
| D/E (Debt to Equity) | 0.36 | 1.28 |
| Debt-to-Assets | 21.3% | 44.2% |
| Interest Coverage | 9.21 | -1.88 |
| Asset Turnover | 0.90 | 0.50 |
| Fixed Asset Turnover | 5.41 | 2.73 |
| Payout Ratio | 132.41% | -37.00% |
| Dividend Yield | 5.33% | 3.68% |
Interpretation of the Ratios
Hormel Foods Corporation
Hormel Foods shows a balanced ratio profile with 50% favorable and 21% unfavorable metrics. While return on equity (6.04%) and net margin (3.95%) are weak, liquidity ratios like current ratio (2.47) and interest coverage (9.51) are strong. Dividend yield stands neutral at 5.33%, supported by consistent payouts and manageable leverage, indicating moderate risk in distributions and buybacks.
The J. M. Smucker Company
Smucker exhibits predominantly unfavorable ratios, with negative returns on equity (-20.23%) and net margin (-14.1%). Liquidity ratios are weak, including a current ratio of 0.81 and quick ratio of 0.35, while debt to equity is high at 1.28. Despite a favorable dividend yield of 3.68%, the company’s negative profitability suggests dividends may be pressured by operational challenges.
Which one has the best ratios?
Hormel Foods Corporation presents a more favorable financial ratio set overall, with stronger liquidity, leverage, and moderate profitability compared to The J. M. Smucker Company. Smucker’s negative returns and liquidity concerns weigh heavily against it, despite a decent dividend yield, making Hormel’s ratios comparatively more robust in this evaluation.
Strategic Positioning
This section compares the strategic positioning of Hormel Foods Corporation and The J. M. Smucker Company in terms of market position, key segments, and exposure to technological disruption:
Hormel Foods Corporation
- Established packaged foods firm with a substantial $12.6B market cap facing moderate competition.
- Diverse product portfolio including meat, nuts, refrigerated, and shelf-stable foods across multiple segments.
- Limited explicit exposure to technological disruption detailed in available data.
The J. M. Smucker Company
- Packaged foods company with a $10.7B market cap and lower beta indicating less volatility.
- Focused on pet foods, coffee, sweet baked snacks, and consumer foods with clear segment delineation.
- No direct mention of technological disruption exposure in provided information.
Hormel Foods Corporation vs The J. M. Smucker Company Positioning
Hormel Foods shows a diversified approach across meat and grocery products, leveraging multiple segments and international presence. Smucker concentrates on pet foods, coffee, and consumer snacks, benefiting from focused segments but less diversification. Each strategy presents distinct scope and risk profiles based strictly on given data.
Which has the best competitive advantage?
Both companies exhibit very unfavorable MOAT evaluations with declining ROIC trends and are shedding value, indicating weak competitive advantages based on return on invested capital relative to cost of capital.
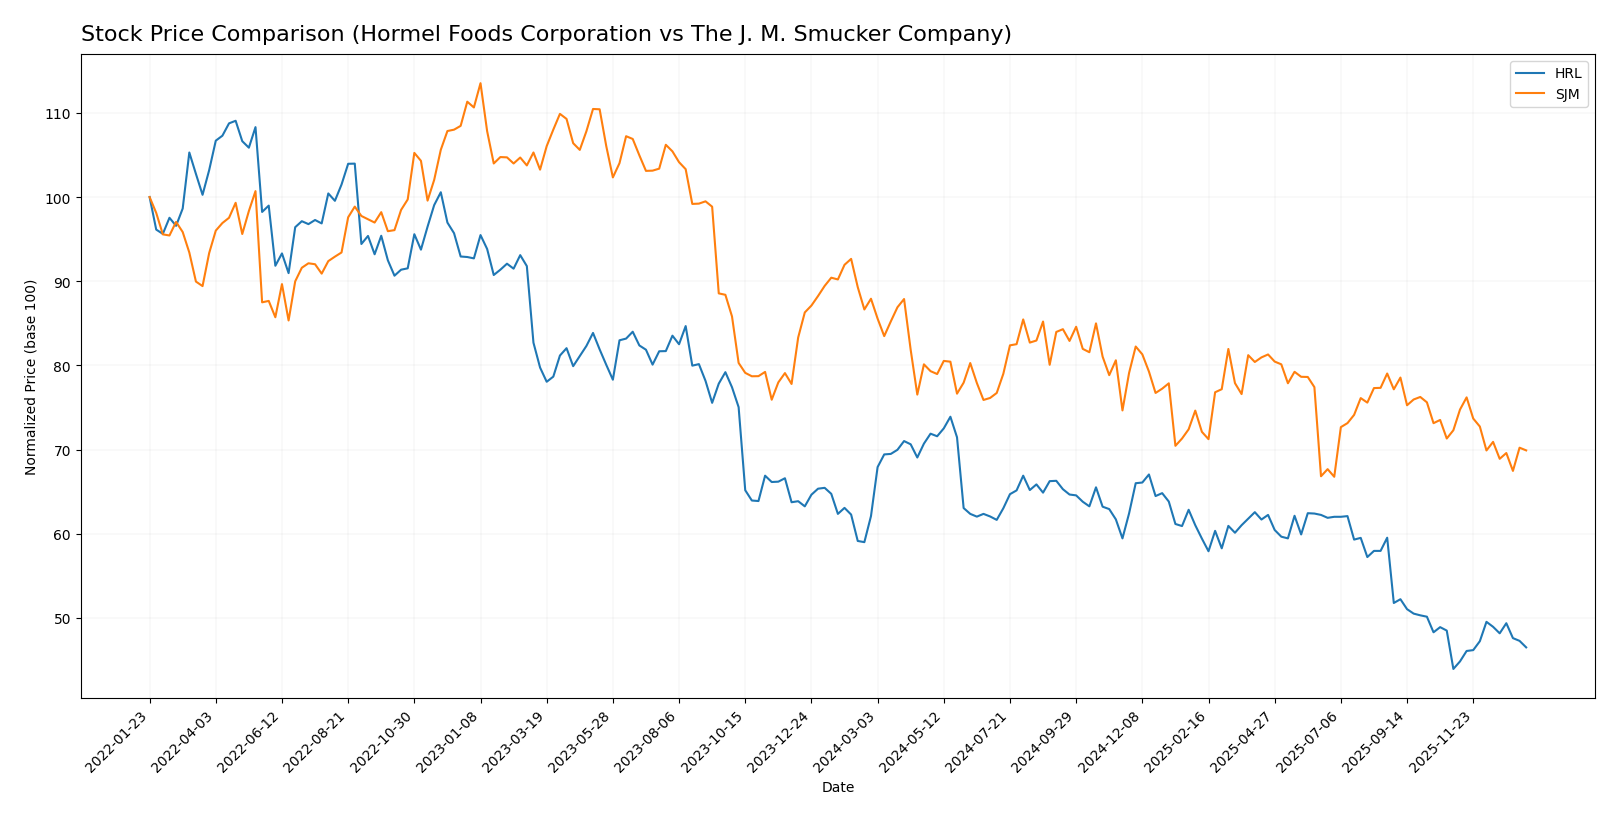
Stock Comparison
The stock price movements of Hormel Foods Corporation (HRL) and The J. M. Smucker Company (SJM) over the past 12 months reveal distinct bearish trends with varying degrees of volatility and recent trading dynamics.
Trend Analysis
Hormel Foods Corporation’s stock experienced a bearish trend over the past year, declining by 25.11% with accelerating downward momentum and a standard deviation of 3.52. The stock hit a high of 36.31 and a low of 21.59, but showed a recent positive shift, rising 5.84% from November 2025 to January 2026.
The J. M. Smucker Company’s stock also displayed a bearish trend for the year, falling 20.49% with decelerating negative momentum and higher volatility at a 6.98 standard deviation. Its price ranged between 125.92 and 95.63, yet recently declined by 3.31% with a negative slope from November 2025 to January 2026.
Comparing the two, Hormel Foods had the larger overall price decline but showed recent recovery, while Smucker’s stock had a smaller loss but continued recent weakness. Hormel Foods delivered the lower market performance over the full year.
Target Prices
Analysts present a confident consensus on target prices for Hormel Foods Corporation and The J. M. Smucker Company.
| Company | Target High | Target Low | Consensus |
|---|---|---|---|
| Hormel Foods Corporation | 30 | 26 | 27.75 |
| The J. M. Smucker Company | 117 | 110 | 113.4 |
The consensus targets are significantly above current prices, indicating positive analyst expectations and potential upside for both stocks compared to their present market values.
Analyst Opinions Comparison
This section compares analysts’ ratings and grades for Hormel Foods Corporation (HRL) and The J. M. Smucker Company (SJM):
Rating Comparison
HRL Rating
- Rating: B, considered very favorable by analysts.
- Discounted Cash Flow Score: 4, favorable indication of valuation based on future cash flows.
- ROE Score: 2, moderate efficiency in generating profit from equity.
- ROA Score: 3, moderate effectiveness in asset utilization.
- Debt To Equity Score: 3, moderate financial risk with balanced leverage.
- Overall Score: 3, moderate overall financial standing.
SJM Rating
- Rating: C+, also considered very favorable by analysts.
- Discounted Cash Flow Score: 5, very favorable, suggesting strong undervaluation.
- ROE Score: 1, very unfavorable, indicating low profitability from equity.
- ROA Score: 1, very unfavorable, showing weak asset utilization.
- Debt To Equity Score: 1, very unfavorable, indicating high financial risk.
- Overall Score: 2, moderate but lower than HRL’s overall score.
Which one is the best rated?
Based strictly on the provided data, HRL holds a higher overall rating and better scores in ROE, ROA, and debt-to-equity metrics. Although SJM has a superior discounted cash flow score, HRL’s balanced financial metrics result in a better overall rating.
Scores Comparison
The following table compares the Altman Z-Score and Piotroski Score for Hormel Foods Corporation and The J. M. Smucker Company:
HRL Scores
- Altman Z-Score: 5.17, indicating a safe zone with low bankruptcy risk.
- Piotroski Score: 7, categorized as strong financial health.
SJM Scores
- Altman Z-Score: 0.90, indicating financial distress and high bankruptcy risk.
- Piotroski Score: 4, considered average financial strength.
Which company has the best scores?
Based on the provided data, Hormel Foods (HRL) shows stronger financial health with a safe-zone Altman Z-Score and a strong Piotroski Score, compared to Smucker (SJM) which is in distress with average Piotroski results.
Grades Comparison
The following presents a detailed comparison of the recent grades assigned to Hormel Foods Corporation and The J. M. Smucker Company:
Hormel Foods Corporation Grades
This table summarizes recent grades assigned by reputable grading companies to Hormel Foods Corporation.
| Grading Company | Action | New Grade | Date |
|---|---|---|---|
| Barclays | Maintain | Overweight | 2025-12-09 |
| JP Morgan | Maintain | Overweight | 2025-12-05 |
| B of A Securities | Maintain | Neutral | 2025-12-05 |
| Piper Sandler | Maintain | Neutral | 2025-12-05 |
| JP Morgan | Maintain | Overweight | 2025-11-21 |
| Piper Sandler | Maintain | Neutral | 2025-11-06 |
| Goldman Sachs | Maintain | Buy | 2025-10-30 |
| Goldman Sachs | Maintain | Buy | 2025-08-29 |
| B of A Securities | Maintain | Neutral | 2025-08-29 |
| Barclays | Maintain | Overweight | 2025-08-29 |
Hormel Foods shows a consistent pattern of overweight and neutral grades, with Goldman Sachs maintaining a buy rating, reflecting a generally positive but cautious consensus.
The J. M. Smucker Company Grades
This table summarizes recent grades assigned by reputable grading companies to The J. M. Smucker Company.
| Grading Company | Action | New Grade | Date |
|---|---|---|---|
| TD Cowen | Maintain | Hold | 2026-01-08 |
| Bernstein | Maintain | Market Perform | 2025-11-26 |
| Stifel | Maintain | Hold | 2025-11-26 |
| UBS | Maintain | Buy | 2025-11-26 |
| Morgan Stanley | Maintain | Overweight | 2025-11-26 |
| JP Morgan | Maintain | Overweight | 2025-11-26 |
| Stifel | Maintain | Hold | 2025-10-24 |
| Argus Research | Downgrade | Hold | 2025-09-12 |
| Barclays | Maintain | Equal Weight | 2025-08-29 |
| JP Morgan | Maintain | Overweight | 2025-08-28 |
The J. M. Smucker Company has a mixed set of ratings, ranging from hold and market perform to buy and overweight, indicating moderate confidence with some caution over recent months.
Which company has the best grades?
Both companies have a consensus rating of “Hold,” but Hormel Foods Corporation’s grades trend more towards overweight and buy, while The J. M. Smucker Company shows a broader spread including hold and market perform. This suggests that Hormel may be perceived as having slightly stronger momentum, potentially affecting investor sentiment toward steadier growth expectations.
Strengths and Weaknesses
Below is a comparative overview of Hormel Foods Corporation (HRL) and The J. M. Smucker Company (SJM) based on key investment criteria.
| Criterion | Hormel Foods Corporation (HRL) | The J. M. Smucker Company (SJM) |
|---|---|---|
| Diversification | Diversified across Foodservice, Retail & Intl. segments with strong perishable meat and shelf stable products | Diversified across U.S. Retail Pet Foods, Coffee, Consumer Foods, and International segments |
| Profitability | Moderate profitability with net margin 3.95%, ROIC 4.31%, but ROIC below WACC indicating value destruction | Negative profitability with net margin -14.1%, ROIC -5.09%, and significant value destruction |
| Innovation | Stable but limited recent innovation indications; reliance on traditional food segments | Innovation challenged by declining ROIC and profitability; focus on established product lines |
| Global presence | Moderate international exposure (~709M in Intl. segment) | Moderate international presence (~1.2B in Intl. and Away From Home segment) |
| Market Share | Strong in perishable meat and retail food segments | Leading in U.S. retail coffee and pet foods, but facing profitability headwinds |
Key takeaway: Hormel shows better financial health and slightly favorable ratios despite value destruction, while Smucker struggles with declining profitability and unfavorable financial metrics, suggesting higher risk for investors.
Risk Analysis
Below is a comparative risk overview for Hormel Foods Corporation (HRL) and The J. M. Smucker Company (SJM) based on the most recent 2025 data.
| Metric | Hormel Foods Corporation (HRL) | The J. M. Smucker Company (SJM) |
|---|---|---|
| Market Risk | Low beta (0.32), stable price range (21.03-32.07) | Very low beta (0.22), price range (93.3-121.48) but recent negative margins |
| Debt level | Low debt-to-equity (0.36), debt to assets 21.34% (favorable) | High debt-to-equity (1.28), debt to assets 44.19% (neutral) |
| Regulatory Risk | Moderate, typical for packaged foods sector | Moderate, with food safety and labeling regulations impact |
| Operational Risk | Moderate, diversified product segments reduce risk | Elevated, due to weaker profitability and operational efficiency |
| Environmental Risk | Standard for food processing, no major issues reported | Standard, no major issues reported |
| Geopolitical Risk | Limited, primarily US market with some international exposure | Limited, primarily US market exposure |
Synthesis: Smucker faces higher financial and operational risks, with negative profitability and distress-level Altman Z-score (0.9), indicating financial distress. Hormel shows stronger financial stability, low debt risk, and operates in a safer zone (Altman Z-score 5.17). Market risk is low for both, but Smucker’s weak margins and leverage pose the most impactful risks.
Which Stock to Choose?
Hormel Foods Corporation (HRL) shows a declining income trend with unfavorable profitability metrics and a net margin of 3.95%. Its financial ratios are slightly favorable, supported by a solid current ratio of 2.47 and low debt levels. HRL’s rating is very favorable with a B grade, though its economic moat is very unfavorable, indicating value destruction.
The J. M. Smucker Company (SJM) has a mixed income profile, with a high gross margin of 38.79% but negative net margin at -14.1%. Financial ratios are largely unfavorable, including weak liquidity and high leverage. Despite a very favorable rating of C+, SJM’s economic moat status is very unfavorable, signaling declining profitability and value loss.
Investors with a risk-averse or quality-focused profile might find HRL’s stronger financial ratios and moderate rating more reassuring, while those with tolerance for volatility or seeking potential turnaround opportunities could consider SJM’s favorable rating despite weak fundamentals. Both companies currently exhibit unfavorable income trends and deteriorating economic moats.
Disclaimer: Investment carries a risk of loss of initial capital. The past performance is not a reliable indicator of future results. Be sure to understand risks before making an investment decision.
Go Further
I encourage you to read the complete analyses of Hormel Foods Corporation and The J. M. Smucker Company to enhance your investment decisions: