Hormel Foods Corporation (HRL) and Pilgrim’s Pride Corporation (PPC) are two prominent players in the packaged foods industry, specializing in meat products with strong market presence in the United States and beyond. Both companies emphasize innovation and product diversification to capture evolving consumer preferences. This comparison explores their strategies, financial strengths, and growth prospects to help you identify which stock might be the better addition to your investment portfolio.

Table of contents
Companies Overview
I will begin the comparison between Hormel Foods Corporation and Pilgrim’s Pride Corporation by providing an overview of these two companies and their main differences.
Hormel Foods Corporation Overview
Hormel Foods Corporation develops, processes, and distributes a variety of meat, nuts, and other food products primarily in the US and internationally. Operating through four segments, it offers fresh and shelf-stable foods under brands like SKIPPY, SPAM, and Jennie-O. Founded in 1891 and headquartered in Austin, Minnesota, Hormel focuses on retail, foodservice, deli, and commercial customers with a market cap of about 12.6B USD.
Pilgrim’s Pride Corporation Overview
Pilgrim’s Pride Corporation specializes in producing, processing, marketing, and distributing fresh, frozen, and value-added chicken and pork products across several global markets. Founded in 1946 and based in Greeley, Colorado, it operates as a subsidiary of JBS S.A., serving retail and foodservice clients under brands including Pilgrim’s and Just BARE. The company holds a market cap near 9.5B USD and employs over 62K people.
Key similarities and differences
Both companies operate in the packaged foods sector, focusing on meat products and serving retail and foodservice customers domestically and internationally. Hormel offers a broader product range including nuts and various shelf-stable items, while Pilgrim’s Pride concentrates on poultry and pork with extensive value-added options. Pilgrim’s Pride is larger by workforce and operates as a JBS subsidiary, contrasting with Hormel’s independent status and diversified brand portfolio.
Income Statement Comparison
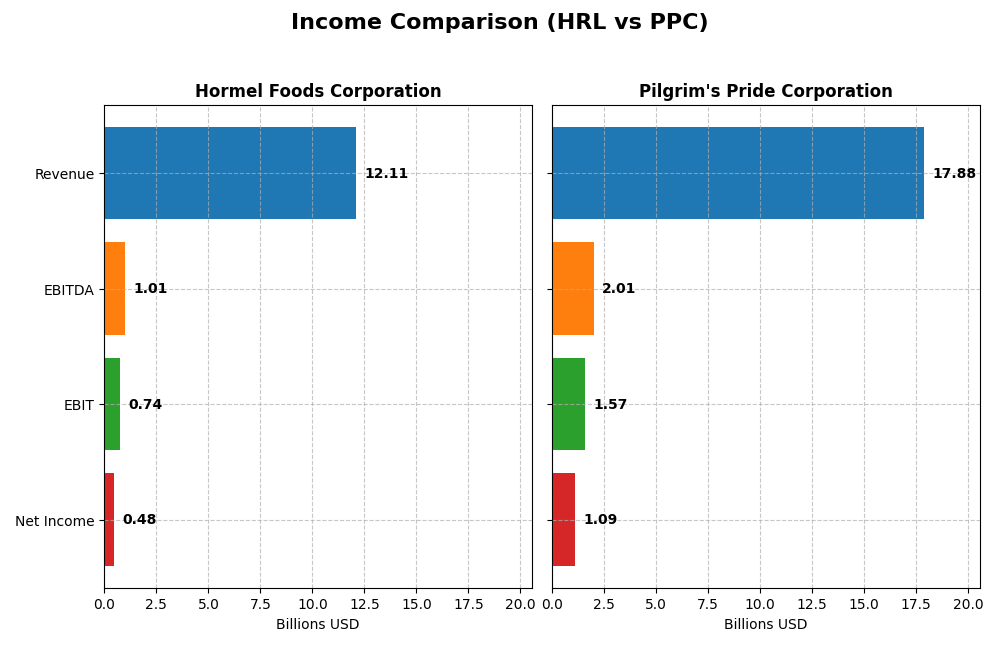
The table below provides a side-by-side comparison of key income statement metrics for Hormel Foods Corporation and Pilgrim’s Pride Corporation for their most recently reported fiscal years.
| Metric | Hormel Foods Corporation (HRL) | Pilgrim’s Pride Corporation (PPC) |
|---|---|---|
| Market Cap | 12.6B USD | 9.5B USD |
| Revenue | 12.11B USD | 17.88B USD |
| EBITDA | 1.01B USD | 2.01B USD |
| EBIT | 742M USD | 1.57B USD |
| Net Income | 478M USD | 1.09B USD |
| EPS | 0.87 USD | 4.58 USD |
| Fiscal Year | 2025 | 2024 |
Income Statement Interpretations
Hormel Foods Corporation
Hormel Foods shows a modest revenue growth of 6.3% over 2021-2025, but net income declined by 47.4%, reflecting pressure on profitability. Margins remained largely stable with a gross margin near 15.5% and a net margin around 4%. The 2025 year saw revenue increase slightly by 1.6%, yet net income fell sharply by 41.5%, indicating margin compression and lower earnings per share.
Pilgrim’s Pride Corporation
Pilgrim’s Pride experienced strong growth in revenue and net income, with revenue up 47.9% and net income surging over 1,000% from 2020 to 2024. Margins improved notably, with a 2024 gross margin near 13%, EBIT margin of 8.8%, and a favorable net margin above 6%. The latest year reflected a 3% revenue increase coupled with significant margin and earnings growth, signaling robust operational performance.
Which one has the stronger fundamentals?
Pilgrim’s Pride demonstrates stronger fundamentals with substantial revenue and net income growth, improved margins, and favorable earnings momentum. Hormel Foods exhibits only moderate revenue growth but a marked decline in net income and profitability margins. Overall, Pilgrim’s Pride’s income statement reflects more favorable trends and financial strength compared to Hormel Foods over the reviewed periods.
Financial Ratios Comparison
Below is a comparison of key financial ratios for Hormel Foods Corporation (HRL) and Pilgrim’s Pride Corporation (PPC) based on their most recent fiscal year data.
| Ratios | Hormel Foods Corporation (HRL) | Pilgrim’s Pride Corporation (PPC) |
|---|---|---|
| ROE | 6.04% | 25.63% |
| ROIC | 4.31% | 14.20% |
| P/E | 24.84 | 9.90 |
| P/B | 1.50 | 2.54 |
| Current Ratio | 2.47 | 2.01 |
| Quick Ratio | 1.20 | 1.31 |
| D/E (Debt-to-Equity) | 0.36 | 0.82 |
| Debt-to-Assets | 21.3% | 32.5% |
| Interest Coverage | 9.21 | 9.34 |
| Asset Turnover | 0.90 | 1.68 |
| Fixed Asset Turnover | 5.41 | 5.27 |
| Payout ratio | 132.4% | 0% |
| Dividend yield | 5.33% | 0% |
Interpretation of the Ratios
Hormel Foods Corporation
Hormel’s ratios show a mixed picture with half being favorable and 21% unfavorable, including weak net margin (3.95%) and return on equity (6.04%). The current ratio (2.47) and interest coverage (9.51) are strong, indicating good liquidity and debt service capacity. Hormel pays dividends with a neutral yield of 5.33%, suggesting stable shareholder returns but caution is advised regarding payout sustainability.
Pilgrim’s Pride Corporation
Pilgrim’s Pride exhibits mostly favorable ratios, with strong return on equity (25.63%) and return on invested capital (14.2%), indicating efficient use of capital. Liquidity ratios are solid, and asset turnover is high, reflecting operational efficiency. However, Pilgrim’s does not pay dividends, likely prioritizing reinvestment and growth, which may appeal to investors focused on capital appreciation rather than immediate income.
Which one has the best ratios?
Pilgrim’s Pride holds a more favorable overall ratio profile with 64% favorable metrics compared to Hormel’s 50%, showcasing stronger profitability and operational efficiency. Hormel demonstrates better dividend yield but faces some profitability challenges. The choice depends on investor preference for dividend income versus growth potential based on ratio strength.
Strategic Positioning
This section compares the strategic positioning of Hormel Foods Corporation and Pilgrim’s Pride Corporation, including market position, key segments, and exposure to technological disruption:
Hormel Foods Corporation
- Established market leader in packaged foods facing moderate competition.
- Diverse segments: Grocery, Refrigerated Foods, Jennie-O Turkey, International.
- Operates in traditional food processing with no specific tech disruption noted.
Pilgrim’s Pride Corporation
- Significant player in fresh and processed meat markets with global reach.
- Focused on fresh, frozen chicken and pork products for retail and foodservice.
- Traditional meat production and processing with limited tech disruption data.
Hormel Foods Corporation vs Pilgrim’s Pride Corporation Positioning
Hormel offers a diversified portfolio across multiple food segments, while Pilgrim’s Pride concentrates on fresh and processed meats. Hormel’s broader segment mix provides varied revenue streams, whereas Pilgrim’s Pride’s focus supports specialization and international distribution.
Which has the best competitive advantage?
Pilgrim’s Pride shows a strong and growing ROIC above WACC, indicating a durable competitive advantage. Hormel Foods, with declining ROIC below WACC, is shedding value and faces challenges sustaining profitability.
Stock Comparison
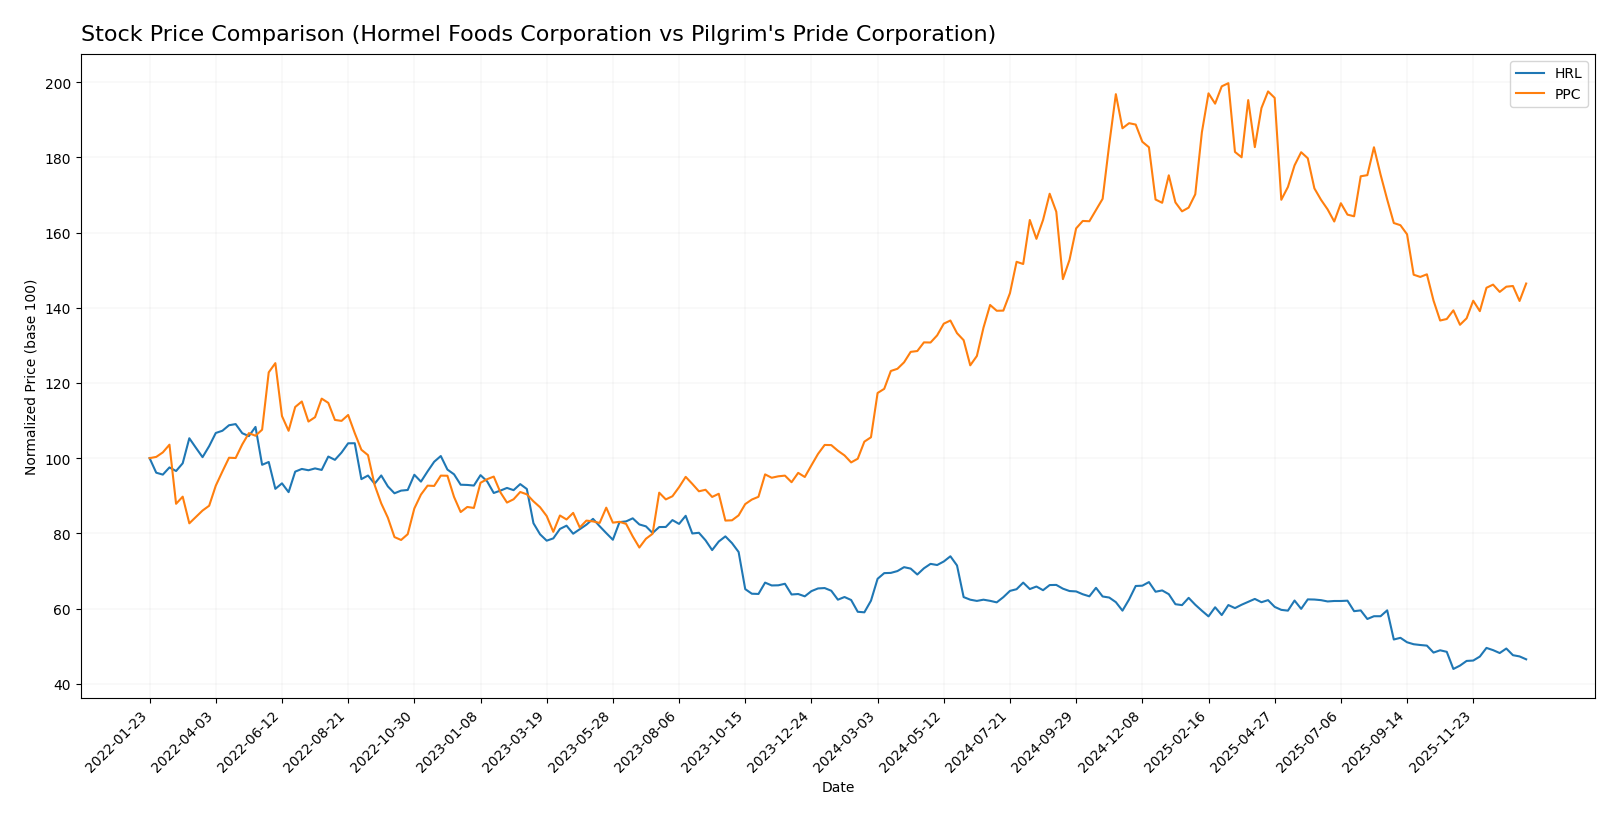
The stock price chart highlights contrasting dynamics between Hormel Foods Corporation (HRL) and Pilgrim’s Pride Corporation (PPC) over the past year, with HRL experiencing a significant decline while PPC shows a strong upward trajectory and accelerating momentum.
Trend Analysis
Hormel Foods Corporation (HRL) experienced a bearish trend over the past 12 months with a price decrease of 25.11%, marked by an acceleration phase and notable volatility indicated by a 3.52 standard deviation. Recent weeks show a slight recovery with a 5.84% gain.
Pilgrim’s Pride Corporation (PPC) recorded a bullish trend over the past year with a 38.73% price increase, accompanied by acceleration and higher volatility (6.11 standard deviation). The recent trend continues upward with a 5.12% gain and a steeper slope.
Comparing both, PPC delivered the highest market performance with a sustained bullish trend and price appreciation significantly exceeding HRL’s bearish decline.
Target Prices
Analysts present a clear consensus on target prices for Hormel Foods Corporation and Pilgrim’s Pride Corporation.
| Company | Target High | Target Low | Consensus |
|---|---|---|---|
| Hormel Foods Corporation | 30 | 26 | 27.75 |
| Pilgrim’s Pride Corporation | 56 | 45 | 50.5 |
Hormel’s consensus target of 27.75 USD is about 21.5% above its current price of 22.85 USD, indicating moderate upside potential. Pilgrim’s Pride shows a stronger bullish outlook, with a target consensus 26% above its 40.05 USD price.
Analyst Opinions Comparison
This section compares analysts’ ratings and grades for Hormel Foods Corporation and Pilgrim’s Pride Corporation:
Rating Comparison
HRL Rating
- Rating: B, classified as Very Favorable by analysts.
- Discounted Cash Flow Score: 4, indicating favorable valuation from cash flows.
- ROE Score: 2, considered moderate efficiency in generating profit from equity.
- ROA Score: 3, moderate effectiveness in asset utilization.
- Debt To Equity Score: 3, moderate financial risk with balanced debt levels.
- Overall Score: 3, moderate overall financial standing.
PPC Rating
- Rating: A+, classified as Very Favorable by analysts.
- Discounted Cash Flow Score: 4, also favorable in valuation assessment.
- ROE Score: 5, very favorable, showing high profit generation efficiency.
- ROA Score: 5, very favorable, demonstrating excellent asset use.
- Debt To Equity Score: 4, favorable with relatively low financial risk.
- Overall Score: 4, favorable overall financial health.
Which one is the best rated?
Based strictly on the provided data, Pilgrim’s Pride Corporation (PPC) holds higher ratings and scores across key financial metrics compared to Hormel Foods Corporation (HRL). PPC’s superior ROE, ROA, and overall scores suggest stronger financial performance.
Scores Comparison
The comparison of scores for Hormel Foods Corporation (HRL) and Pilgrim’s Pride Corporation (PPC) is as follows:
HRL Scores
- Altman Z-Score: 5.17, indicating a safe zone status with low bankruptcy risk.
- Piotroski Score: 7, reflecting strong financial health and investment potential.
PPC Scores
- Altman Z-Score: 3.75, indicating a safe zone status with low bankruptcy risk.
- Piotroski Score: 5, reflecting average financial health and moderate investment potential.
Which company has the best scores?
Based strictly on the data, HRL has higher scores in both the Altman Z-Score and Piotroski Score, indicating stronger financial stability and better overall financial health compared to PPC.
Grades Comparison
Here is a comparison of the most recent grades assigned to Hormel Foods Corporation and Pilgrim’s Pride Corporation by reputable grading firms:
Hormel Foods Corporation Grades
The following table summarizes Hormel Foods Corporation’s recent grades from established financial institutions:
| Grading Company | Action | New Grade | Date |
|---|---|---|---|
| Barclays | Maintain | Overweight | 2025-12-09 |
| JP Morgan | Maintain | Overweight | 2025-12-05 |
| B of A Securities | Maintain | Neutral | 2025-12-05 |
| Piper Sandler | Maintain | Neutral | 2025-12-05 |
| JP Morgan | Maintain | Overweight | 2025-11-21 |
| Piper Sandler | Maintain | Neutral | 2025-11-06 |
| Goldman Sachs | Maintain | Buy | 2025-10-30 |
| Goldman Sachs | Maintain | Buy | 2025-08-29 |
| B of A Securities | Maintain | Neutral | 2025-08-29 |
| Barclays | Maintain | Overweight | 2025-08-29 |
Hormel Foods’ grades predominantly indicate a positive stance with several “Overweight” and “Buy” ratings, balanced by some “Neutral” assessments. The trend reflects a generally favorable outlook.
Pilgrim’s Pride Corporation Grades
Below is a summary of Pilgrim’s Pride Corporation’s recent grades from recognized grading companies:
| Grading Company | Action | New Grade | Date |
|---|---|---|---|
| Barclays | Maintain | Equal Weight | 2025-12-09 |
| Goldman Sachs | Maintain | Neutral | 2025-10-13 |
| BMO Capital | Maintain | Market Perform | 2025-03-17 |
| Barclays | Maintain | Equal Weight | 2024-11-01 |
| BMO Capital | Maintain | Market Perform | 2024-11-01 |
| Barclays | Maintain | Equal Weight | 2024-09-09 |
| Argus Research | Maintain | Buy | 2024-08-28 |
| B of A Securities | Downgrade | Neutral | 2024-08-15 |
| BMO Capital | Downgrade | Market Perform | 2024-08-12 |
| Barclays | Maintain | Equal Weight | 2024-08-02 |
Pilgrim’s Pride shows a mix of “Equal Weight,” “Market Perform,” and a few “Buy” ratings, with some downgrades noted in mid-2024. The overall pattern suggests a cautious to neutral view.
Which company has the best grades?
Hormel Foods Corporation holds somewhat stronger grades, featuring multiple “Overweight” and “Buy” ratings compared to Pilgrim’s Pride’s predominantly “Equal Weight” and “Market Perform” assessments. This difference may suggest a comparatively more optimistic market sentiment for Hormel Foods, which could influence investor confidence and portfolio decisions accordingly.
Strengths and Weaknesses
Below is a comparative overview of key strengths and weaknesses of Hormel Foods Corporation (HRL) and Pilgrim’s Pride Corporation (PPC) based on the most recent financial and operational data.
| Criterion | Hormel Foods Corporation (HRL) | Pilgrim’s Pride Corporation (PPC) |
|---|---|---|
| Diversification | Strong diversification with multiple segments including Retail ($7.46B), Foodservice ($3.94B), and International ($0.71B) revenues in 2025 | Focused primarily on poultry production, less diversified product portfolio |
| Profitability | Low profitability: ROIC 4.31% below WACC 4.86%, net margin 3.95%, overall value destroying | High profitability: ROIC 14.2% well above WACC 5.12%, net margin 6.08%, value creating with strong ROE 25.63% |
| Innovation | Moderate innovation with stable product lines, slight decline in ROIC trend (-46%) indicates challenges | Demonstrates innovation and efficiency gains, reflected in a 455% ROIC growth trend and very favorable moat status |
| Global presence | International segment contributes less than 10% of revenue, mainly US-focused | Mainly North American presence, limited global footprint |
| Market Share | Established brand with strong retail presence but stagnant growth and value erosion | Growing market share with improving margins and operational leverage |
In summary, Pilgrim’s Pride stands out with strong profitability, efficient capital use, and a durable competitive advantage, making it a more attractive investment candidate in 2026. Hormel Foods, despite its diversification, faces profitability challenges and a declining return on invested capital, which warrants caution.
Risk Analysis
Below is a comparative table highlighting key risks for Hormel Foods Corporation (HRL) and Pilgrim’s Pride Corporation (PPC) based on their most recent financial and operational data.
| Metric | Hormel Foods Corporation (HRL) | Pilgrim’s Pride Corporation (PPC) |
|---|---|---|
| Market Risk | Low beta (0.32) suggests lower volatility vs market | Moderate beta (0.45), somewhat more sensitive to market swings |
| Debt level | Low debt-to-equity (0.36), debt-to-assets 21.3% – favorable leverage | Moderate debt-to-equity (0.82), debt-to-assets 32.6% – moderate financial risk |
| Regulatory Risk | Moderate, food safety and labeling regulations impact | Moderate to high, due to larger scale and international exposure |
| Operational Risk | Moderate, diversified product lines reduce dependence | Higher, complex supply chain with poultry and pork production |
| Environmental Risk | Moderate, food packaging and processing impact | Higher, livestock farming has greater environmental footprint |
| Geopolitical Risk | Low, primarily US-focused with some international sales | Moderate, exports and operations in multiple regions increase exposure |
In synthesis, PPC carries more operational and geopolitical risks due to its larger scale, international footprint, and livestock-based production, which also raises environmental concerns. HRL’s lower market volatility and stronger debt position reduce financial risks, but it still faces moderate regulatory and operational challenges. Investors should weigh PPC’s growth potential against its higher risk profile, while HRL offers more stability with moderate growth prospects.
Which Stock to Choose?
Hormel Foods Corporation (HRL) shows a declining income trend with negative growth in net margin and EPS over 2021–2025, an unfavorable global income statement, and moderate financial ratios overall, despite favorable debt metrics and a very favorable rating. Its MOAT evaluation is very unfavorable due to declining ROIC below WACC, indicating value destruction.
Pilgrim’s Pride Corporation (PPC) demonstrates strong income growth, with favorable net margin expansion and EPS gains from 2020 to 2024, supported by a favorable global income statement and financial ratios. Its rating is very favorable, and its MOAT assessment is very favorable, reflecting growing ROIC above WACC and durable competitive advantage.
For risk-averse investors prioritizing stability and value preservation, HRL’s moderate rating and favorable debt profile may appear more suitable despite income challenges. Conversely, growth-oriented investors might find PPC’s robust profitability, strong income growth, and very favorable rating more aligned with their strategy.
Disclaimer: Investment carries a risk of loss of initial capital. The past performance is not a reliable indicator of future results. Be sure to understand risks before making an investment decision.
Go Further
I encourage you to read the complete analyses of Hormel Foods Corporation and Pilgrim’s Pride Corporation to enhance your investment decisions: