Home > Comparison > Consumer Defensive > MKC vs HRL
The strategic rivalry between McCormick & Company and Hormel Foods defines the current trajectory of the packaged foods sector. McCormick operates as a flavor solutions leader, specializing in spices and seasoning blends, while Hormel commands a diversified portfolio across meat and refrigerated products. This head-to-head pits specialized innovation against broadscale consumer staples. This analysis aims to identify which company offers the superior risk-adjusted return for a diversified portfolio in this competitive industry.
Table of contents
Companies Overview
McCormick & Company and Hormel Foods lead the packaged foods sector with distinct market strengths and brand portfolios.
McCormick & Company: Global Flavor Innovator
McCormick dominates the spices and seasoning market, generating revenue through consumer and flavor solutions segments. Its core business blends herbs, condiments, and sauces under iconic brands like French’s and Frank’s RedHot. In 2026, McCormick focuses on expanding flavor innovation and broadening its global footprint, particularly in emerging markets.
Hormel Foods Corporation: Diverse Protein Powerhouse
Hormel excels in meat and refrigerated foods, producing and distributing branded and unbranded products like SPAM and Jennie-O. It drives revenue across grocery, refrigerated, turkey, and international segments. The company’s 2026 strategy prioritizes product diversification and growth in high-margin, value-added proteins alongside expanding its international presence.
Strategic Collision: Similarities & Divergences
Both firms operate in packaged foods but approach market share differently: McCormick invests in a flavor-centric, ingredient-driven model while Hormel pursues a protein-focused, product-diverse strategy. Their primary battleground is consumer loyalty in branded grocery aisles. Investors will find McCormick’s profile driven by innovation and premiumization, contrasting with Hormel’s emphasis on scale and portfolio breadth.
Income Statement Comparison
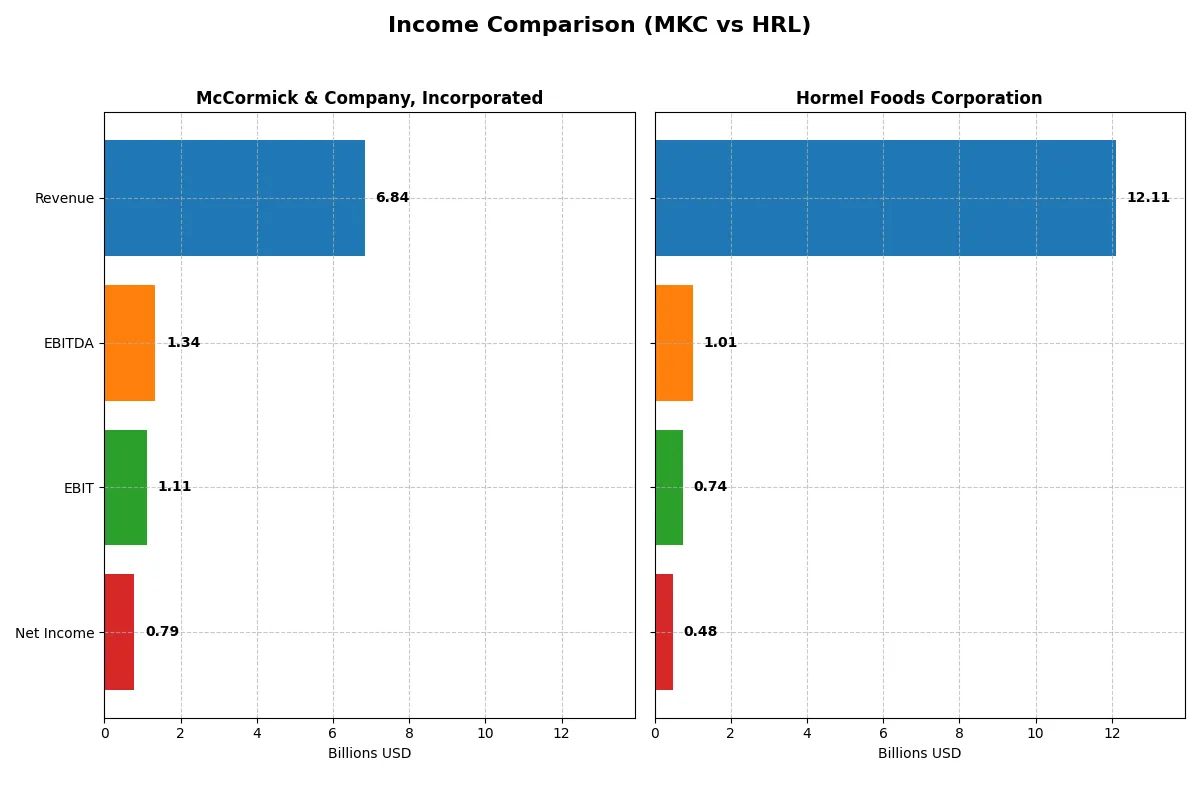
This data dissects the core profitability and scalability of both corporate engines to reveal who dominates the bottom line:
| Metric | McCormick & Company, Incorporated (MKC) | Hormel Foods Corporation (HRL) |
|---|---|---|
| Revenue | 6.84B | 12.11B |
| Cost of Revenue | 4.25B | 10.21B |
| Operating Expenses | 1.50B | 1.17B |
| Gross Profit | 2.59B | 1.89B |
| EBITDA | 1.34B | 1.01B |
| EBIT | 1.11B | 741M |
| Interest Expense | 196M | 78M |
| Net Income | 789M | 478M |
| EPS | 2.94 | 0.87 |
| Fiscal Year | 2025 | 2025 |
Income Statement Analysis: The Bottom-Line Duel
This income statement comparison reveals which company operates with superior efficiency and profit conversion in a competitive market.
McCormick & Company, Incorporated Analysis
McCormick’s revenue rose steadily from 6.3B in 2021 to 6.8B in 2025, with net income growing from 755M to 789M. Its gross margin remains robust near 38%, and net margin holds at a healthy 11.5%. Despite modest revenue growth last year, McCormick sustains strong operating efficiency and stable profitability momentum.
Hormel Foods Corporation Analysis
Hormel’s revenue climbed from 11.4B in 2021 to 12.1B in 2025, but net income plunged from 909M to 478M. Gross margin compressed to 15.6%, and net margin declined sharply to under 4%. Recent years show weakening profitability and significant margin erosion, signaling challenges in cost control and operational leverage.
Efficiency and Margin Resilience vs. Scale with Profit Pressure
McCormick outperforms Hormel on margins and net income growth despite a smaller scale. Hormel’s revenue scale is larger, but margin compression and falling net income weaken its fundamental profile. For investors, McCormick’s consistent profitability and margin resilience offer a more attractive and reliable income statement performance.
Financial Ratios Comparison
These vital ratios act as a diagnostic tool to expose the underlying fiscal health, valuation premiums, and capital efficiency of the companies compared below:
| Ratios | McCormick & Company, Incorporated (MKC) | Hormel Foods Corporation (HRL) |
|---|---|---|
| ROE | 13.8% | 6.1% |
| ROIC | 7.9% | 5.2% |
| P/E | 22.6x | 27.3x |
| P/B | 3.1x | 1.7x |
| Current Ratio | 0.70 | 2.47 |
| Quick Ratio | 0.28 | 1.20 |
| D/E (Debt-to-Equity) | 0.70 | 0.36 |
| Debt-to-Assets | 30.3% | 21.3% |
| Interest Coverage | 5.6x | 11.2x |
| Asset Turnover | 0.52 | 0.90 |
| Fixed Asset Turnover | 4.72 | 5.41 |
| Payout Ratio | 61.2% | 132.4% |
| Dividend Yield | 2.7% | 4.8% |
| Fiscal Year | 2025 | 2025 |
Efficiency & Valuation Duel: The Vital Signs
Financial ratios serve as a company’s DNA, unveiling hidden risks and signaling operational excellence that raw numbers alone cannot reveal.
McCormick & Company, Incorporated
McCormick posts a solid net margin of 11.54% with a neutral ROE at 13.76%, indicating moderate profitability. The P/E of 22.59 suggests a fairly valued stock, though a high P/B ratio of 3.11 signals some valuation stretch. A 2.71% dividend yield rewards shareholders, balancing reinvestment and returns.
Hormel Foods Corporation
Hormel shows weaker profitability with a net margin of 3.95% and an unfavorable ROE of 6.05%. Its P/E at 27.31 marks the stock as expensive relative to earnings. Strong liquidity and debt metrics support financial stability. A healthy 4.85% dividend yield reflects a shareholder-friendly payout despite operational challenges.
Valuation Discipline vs. Financial Stability
Hormel’s favorable liquidity and dividends contrast with McCormick’s stronger profitability and fair valuation. McCormick offers a balanced risk-reward profile, while Hormel suits investors prioritizing financial safety and income. The choice hinges on whether one values operational efficiency or robust financial health more.
Which one offers the Superior Shareholder Reward?
I compare McCormick & Company (MKC) and Hormel Foods Corporation (HRL) on dividend yield, payout, and buybacks. MKC yields 2.7% with a payout ratio near 61%, supported by strong free cash flow coverage (~77%). HRL offers a higher 4.8% yield but pays out 132% of earnings, signaling unsustainable dividends without buybacks. MKC’s moderate payout and consistent buybacks balance income and capital return better. HRL’s yield is attractive but relies heavily on debt and buybacks, risking long-term value. I favor MKC for a sustainable total return profile in 2026.
Comparative Score Analysis: The Strategic Profile
The radar chart reveals the fundamental DNA and trade-offs of McCormick & Company and Hormel Foods Corporation:
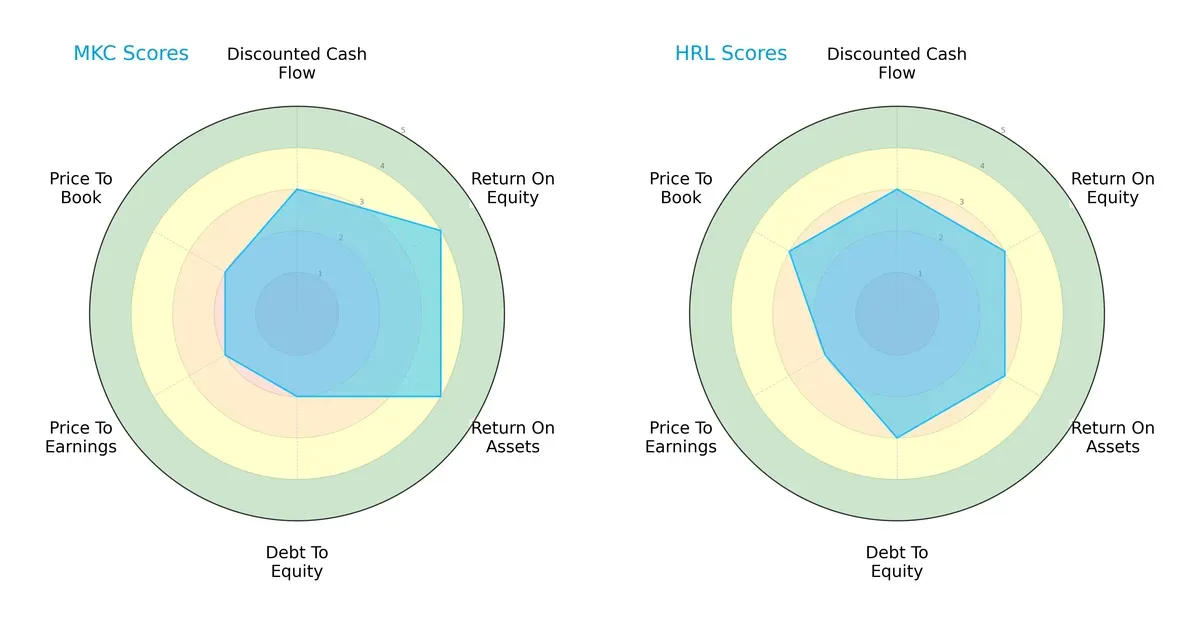
McCormick excels in profitability metrics, scoring higher in ROE (4 vs. 3) and ROA (4 vs. 3). Hormel maintains a stronger balance sheet with better debt-to-equity (3 vs. 2) and a slight edge in price-to-book valuation (3 vs. 2). Both firms show moderate discounted cash flow and price-to-earnings scores. McCormick leans on operational efficiency, while Hormel presents a more balanced financial profile.
Bankruptcy Risk: Solvency Showdown
The Altman Z-Score difference indicates Hormel’s safer financial standing, scoring 3.55 in the safe zone versus McCormick’s 2.49 in the grey zone:
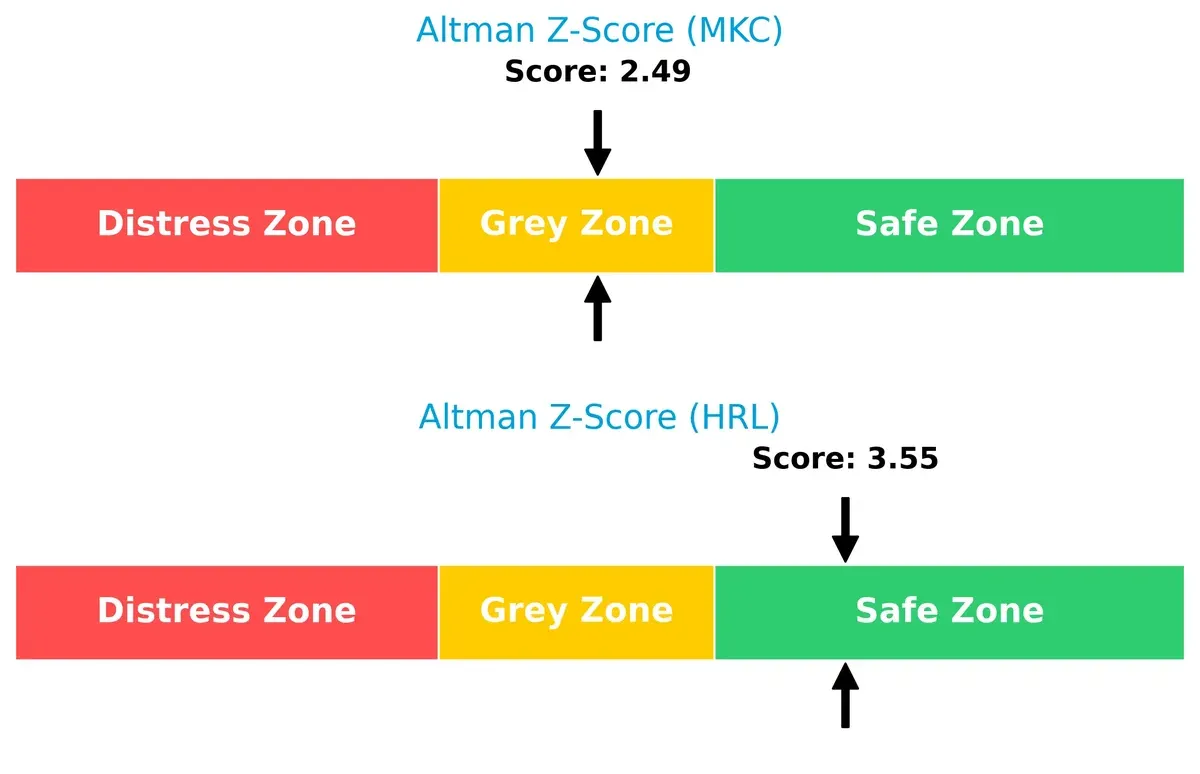
Hormel’s higher Z-Score signals stronger resilience against bankruptcy risk in this cycle. McCormick’s position in the grey zone warrants caution, suggesting moderate vulnerability to financial stress.
Financial Health: Quality of Operations
Hormel outperforms McCormick with a Piotroski F-Score of 7 (strong) compared to 6 (average):
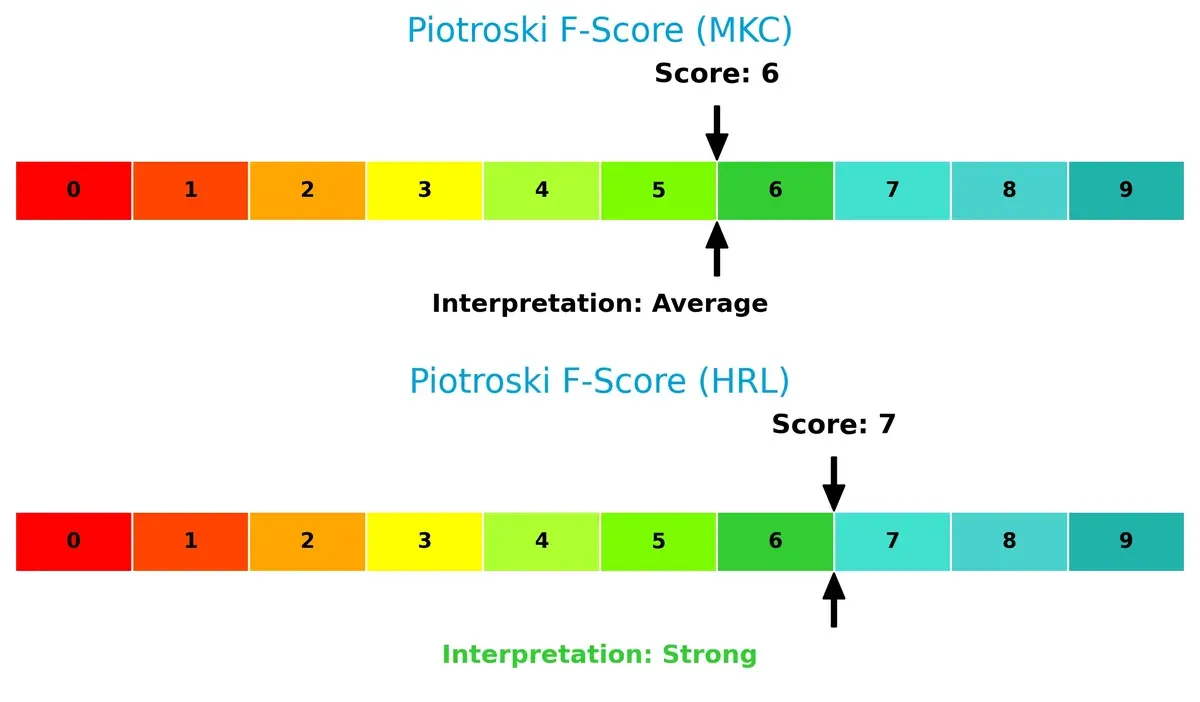
Hormel demonstrates superior internal financial health and operational quality. McCormick’s average score suggests some internal metrics may need improvement, raising mild red flags for risk-averse investors.
How are the two companies positioned?
This section dissects the operational DNA of MKC and HRL by comparing their revenue distribution by segment and internal dynamics. The goal is to confront their economic moats to reveal which model offers the most resilient competitive advantage today.
Revenue Segmentation: The Strategic Mix
The following visual comparison dissects how McCormick & Company and Hormel Foods diversify their income streams and where their primary sector bets lie:
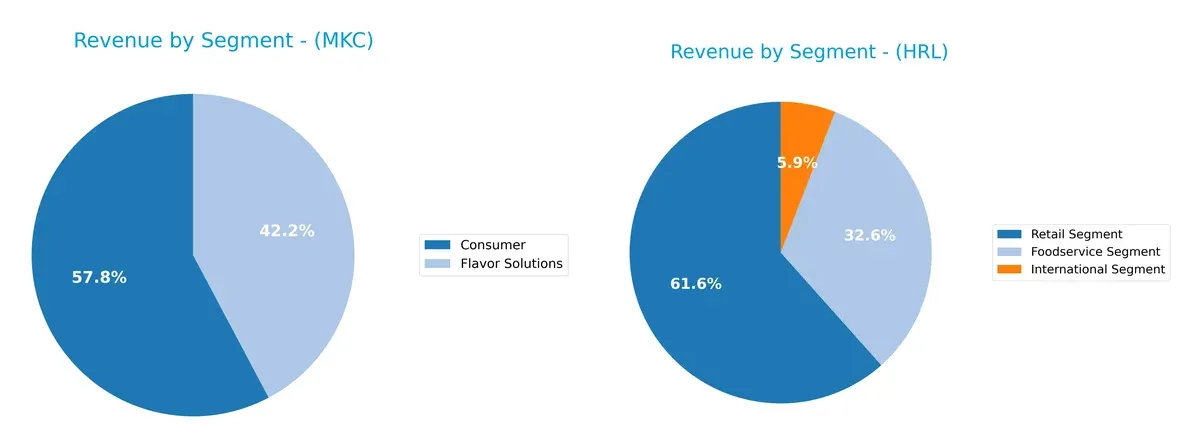
McCormick anchors its revenue in two main segments: Consumer at $3.95B and Flavor Solutions at $2.89B, showing a focused but balanced mix. Hormel Foods dwarfs with a broader footprint, led by Retail at $7.46B, Foodservice at $3.94B, and International at $709M. Hormel’s diversified portfolio reduces concentration risk, while McCormick’s dual-segment reliance suggests strength in niche flavor and consumer products but exposes it to sector-specific shifts.
Strengths and Weaknesses Comparison
This table compares the strengths and weaknesses of McCormick & Company and Hormel Foods Corporation:
McCormick Strengths
- Balanced product segments with strong Consumer and Flavor Solutions revenues
- Slightly favorable profitability ratios including net margin and interest coverage
- Favorable fixed asset turnover and dividend yield
- Global presence across Americas, Europe, and Asia Pacific
Hormel Strengths
- Diverse product portfolio covering Foodservice, Retail, and International segments
- Favorable liquidity and leverage ratios with strong current and quick ratios
- Higher dividend yield and interest coverage than McCormick
- Large US market presence with significant revenue concentration
McCormick Weaknesses
- Low liquidity ratios indicating potential short-term solvency risks
- Unfavorable price-to-book ratio suggesting valuation concerns
- Neutral returns on equity and invested capital
- Moderate asset turnover may limit efficiency
Hormel Weaknesses
- Unfavorable profitability metrics including low net margin and ROE
- Higher P/E ratio indicating possible overvaluation
- Less geographic diversification with heavy US revenue concentration
- Some neutral return on invested capital ratios
McCormick shows strengths in profitability and global diversification but faces liquidity constraints. Hormel excels in liquidity and dividend yield but struggles with profitability and geographic concentration. Each company’s profile reflects distinct strategic priorities and operational trade-offs.
The Moat Duel: Analyzing Competitive Defensibility
A structural moat is the sole barrier protecting long-term profits from relentless competition erosion. Here’s how McCormick and Hormel defend their turf:
McCormick & Company, Incorporated: Brand Power and Innovation Moat
McCormick leverages strong intangible assets and brand loyalty, reflected in stable 16% EBIT margins and steady ROIC growth. Its global flavor portfolio and new product innovation deepen its moat in 2026.
Hormel Foods Corporation: Scale and Diversification Moat
Hormel’s moat centers on diversified product lines and scale, though weaker than McCormick’s. Declining ROIC and margin contraction signal competitive pressure, yet expansion into nutrition and international markets may offer turnaround potential.
Margin Resilience vs. Scale Efficiency: The Moat Showdown
McCormick’s growing profitability and brand-driven moat appear wider and more durable than Hormel’s scale-based but weakening moat. McCormick is better positioned to defend market share amid rising competition.
Which stock offers better returns?
Over the past year, both McCormick & Company and Hormel Foods experienced bearish trends with marked price declines, though recent trading shows diverging momentum and buyer dominance shifts.
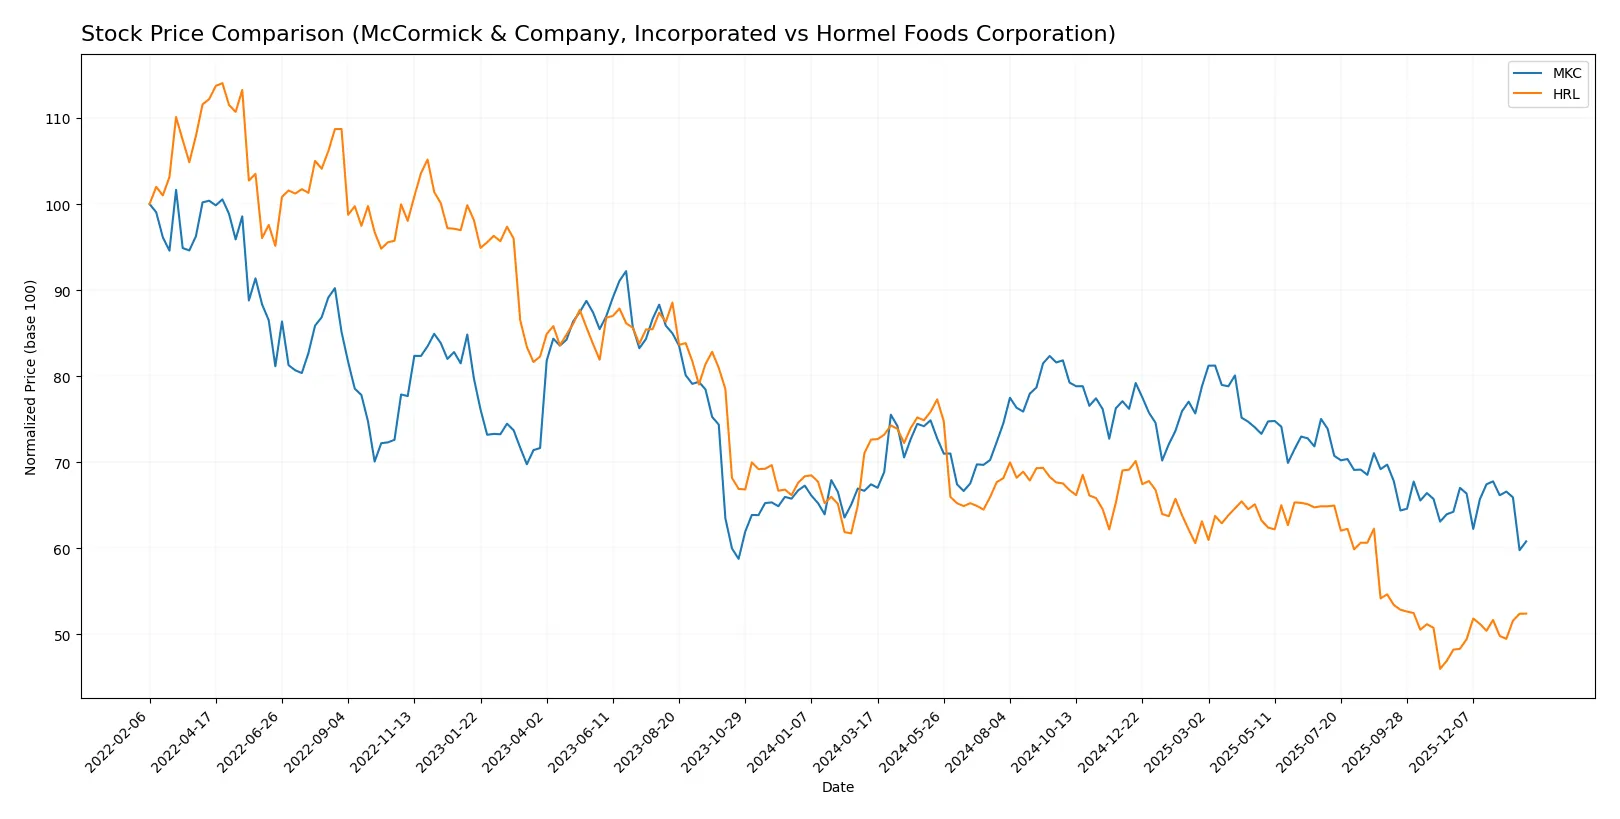
Trend Comparison
McCormick & Company’s stock fell 9.84% over the past year, signaling a bearish trend with decelerating losses. The price fluctuated between $60.79 and $83.76, reflecting moderate volatility (5.29 std dev).
Hormel Foods declined 27.85% over the same period, a more pronounced bearish trend with accelerating losses. Prices ranged from $21.59 to $36.31, showing lower volatility (3.55 std dev) but sharper negative momentum.
Comparing recent trends, Hormel Foods reversed to an 8.7% gain, while McCormick continued a milder 5.36% decline. Hormel’s stronger recent performance suggests it currently leads in market returns.
Target Prices
Analysts provide a cautiously optimistic consensus for these packaged foods leaders.
| Company | Target Low | Target High | Consensus |
|---|---|---|---|
| McCormick & Company, Incorporated | 67 | 85 | 73.57 |
| Hormel Foods Corporation | 26 | 30 | 27.75 |
The consensus target prices for McCormick and Hormel suggest 19% and 13% upside, respectively, versus current prices. Analysts expect moderate appreciation reflecting steady industry fundamentals.

Don’t Let Luck Decide Your Entry Point
Optimize your entry points with our advanced ProRealTime indicators. You’ll get efficient buy signals with precise price targets for maximum performance. Start outperforming now!
How do institutions grade them?
McCormick & Company, Incorporated Grades
The table below summarizes recent institutional grades for McCormick & Company:
| Grading Company | Action | New Grade | Date |
|---|---|---|---|
| Barclays | Maintain | Equal Weight | 2026-01-26 |
| UBS | Maintain | Neutral | 2026-01-23 |
| Stifel | Maintain | Hold | 2026-01-23 |
| Barclays | Maintain | Equal Weight | 2025-10-08 |
| Jefferies | Maintain | Buy | 2025-10-08 |
| Deutsche Bank | Maintain | Hold | 2025-10-08 |
| Stifel | Maintain | Hold | 2025-10-08 |
| UBS | Maintain | Neutral | 2025-10-08 |
| Bernstein | Maintain | Outperform | 2025-10-08 |
| UBS | Maintain | Neutral | 2025-10-01 |
Hormel Foods Corporation Grades
The table below summarizes recent institutional grades for Hormel Foods Corporation:
| Grading Company | Action | New Grade | Date |
|---|---|---|---|
| Barclays | Maintain | Overweight | 2025-12-09 |
| JP Morgan | Maintain | Overweight | 2025-12-05 |
| B of A Securities | Maintain | Neutral | 2025-12-05 |
| Piper Sandler | Maintain | Neutral | 2025-12-05 |
| JP Morgan | Maintain | Overweight | 2025-11-21 |
| Piper Sandler | Maintain | Neutral | 2025-11-06 |
| Goldman Sachs | Maintain | Buy | 2025-10-30 |
| Goldman Sachs | Maintain | Buy | 2025-08-29 |
| B of A Securities | Maintain | Neutral | 2025-08-29 |
| Barclays | Maintain | Overweight | 2025-08-29 |
Which company has the best grades?
Hormel Foods Corporation consistently receives stronger ratings, including multiple Overweight and Buy grades. McCormick’s grades cluster around Neutral and Hold, with some Buy and Outperform. Investors might view Hormel as favored by analysts, potentially reflecting higher confidence in its prospects.
Risks specific to each company
The following categories identify critical pressure points and systemic threats facing McCormick & Company, Incorporated and Hormel Foods Corporation in the 2026 market environment:
1. Market & Competition
McCormick & Company, Incorporated
- Faces stiff competition in packaged foods, needing innovation to maintain market share.
Hormel Foods Corporation
- Competes in diverse perishable and shelf-stable foods, leveraging strong brand portfolio for resilience.
2. Capital Structure & Debt
McCormick & Company, Incorporated
- Moderate leverage with debt/equity at 0.7; interest coverage favorable at 5.65x.
Hormel Foods Corporation
- Lower leverage with debt/equity at 0.36; strong interest coverage at 9.5x, signaling robust financial stability.
3. Stock Volatility
McCormick & Company, Incorporated
- Beta of 0.617 indicates moderate market sensitivity and moderate volatility.
Hormel Foods Corporation
- Beta of 0.324 shows low market sensitivity, suggesting defensive stock characteristics.
4. Regulatory & Legal
McCormick & Company, Incorporated
- Subject to food safety and labeling regulations globally; potential cost impact from compliance.
Hormel Foods Corporation
- Faces regulatory risks related to meat processing and international food standards compliance.
5. Supply Chain & Operations
McCormick & Company, Incorporated
- Supply chain complexity from global spice sourcing may introduce volatility and cost pressures.
Hormel Foods Corporation
- Diverse product lines require robust cold chain and logistics; operational scale helps mitigate risks.
6. ESG & Climate Transition
McCormick & Company, Incorporated
- Increasing pressure to improve sustainability practices in sourcing and packaging.
Hormel Foods Corporation
- Faces challenges in reducing carbon footprint in meat production and processing operations.
7. Geopolitical Exposure
McCormick & Company, Incorporated
- Exposure to emerging markets and trade tensions could disrupt supply chains and sales.
Hormel Foods Corporation
- Primarily US-focused with international exposure, less vulnerable to geopolitical shocks.
Which company shows a better risk-adjusted profile?
Hormel’s strongest risk lies in regulatory and operational complexity from its meat processing, but its solid balance sheet and low beta reduce financial risk. McCormick’s biggest concern is supply chain volatility amplified by its high leverage and weaker liquidity ratios. Hormel’s superior liquidity and safer Altman Z-Score (3.55 vs. 2.49) indicate a better risk-adjusted profile for cautious investors in 2026.
Final Verdict: Which stock to choose?
McCormick & Company, Incorporated’s superpower lies in its improving profitability and solid operational efficiency, signaling a company gradually enhancing its competitive position. However, its low liquidity ratios remain a point of vigilance, suggesting caution in tight financial conditions. It suits portfolios seeking steady, slightly favorable growth with moderate risk tolerance.
Hormel Foods Corporation boasts a strategic moat through its strong balance sheet and consistent free cash flow generation, underpinning its defensive stability. Compared to McCormick, Hormel offers better liquidity and lower leverage, appealing to investors prioritizing financial safety. It fits well in a GARP (Growth at a Reasonable Price) portfolio emphasizing resilience over rapid expansion.
If you prioritize improving profitability and operational efficiency, McCormick outshines as a compelling choice due to its upward ROIC trend and margin strength. However, if you seek better stability and balance sheet health, Hormel offers superior financial safety and a stronger liquidity profile despite its earnings challenges. Each represents a distinct analytical scenario suited to different investor risk preferences.
Disclaimer: Investment carries a risk of loss of initial capital. The past performance is not a reliable indicator of future results. Be sure to understand risks before making an investment decision.
Go Further
I encourage you to read the complete analyses of McCormick & Company, Incorporated and Hormel Foods Corporation to enhance your investment decisions: