In the competitive packaged foods sector, Hormel Foods Corporation and Lamb Weston Holdings, Inc. stand out as key players with strong market presences and distinct product focuses. Hormel offers a diverse portfolio spanning meats, nuts, and prepared foods, while Lamb Weston specializes in frozen potato products and related innovations. This comparison explores their industry strategies and growth potential to help you identify which company might be the smarter investment choice in 2026.
Table of contents
Companies Overview
I will begin the comparison between Hormel Foods Corporation and Lamb Weston Holdings, Inc. by providing an overview of these two companies and their main differences.
Hormel Foods Corporation Overview
Hormel Foods Corporation operates in the packaged foods industry, focusing on developing, processing, and distributing meat, nuts, and various food products. With a market cap of approximately 12.57B USD, it serves retail, foodservice, deli, and commercial customers domestically and internationally. Hormel’s diverse product range includes fresh meats, frozen items, shelf-stable foods, and nutritional supplements, marketed under multiple well-known brand names.
Lamb Weston Holdings, Inc. Overview
Lamb Weston Holdings, Inc. specializes in value-added frozen potato products, distributing globally through retail and foodservice channels. Headquartered in Eagle, Idaho, the company has a market cap near 5.77B USD and operates four segments covering global, foodservice, retail, and other categories. Lamb Weston markets products under its own and licensed brands, serving a broad customer base including grocery retailers, restaurants, and educational institutions.
Key similarities and differences
Both Hormel and Lamb Weston operate within the consumer defensive sector, focusing on packaged foods. Hormel has a broader product portfolio spanning meats, nuts, and more, while Lamb Weston is concentrated on frozen potato products and related items. Hormel’s market cap is more than double Lamb Weston’s, reflecting its larger scale and product diversity. Both companies serve retail and foodservice customers but differ in product specialization and geographic reach.
Income Statement Comparison
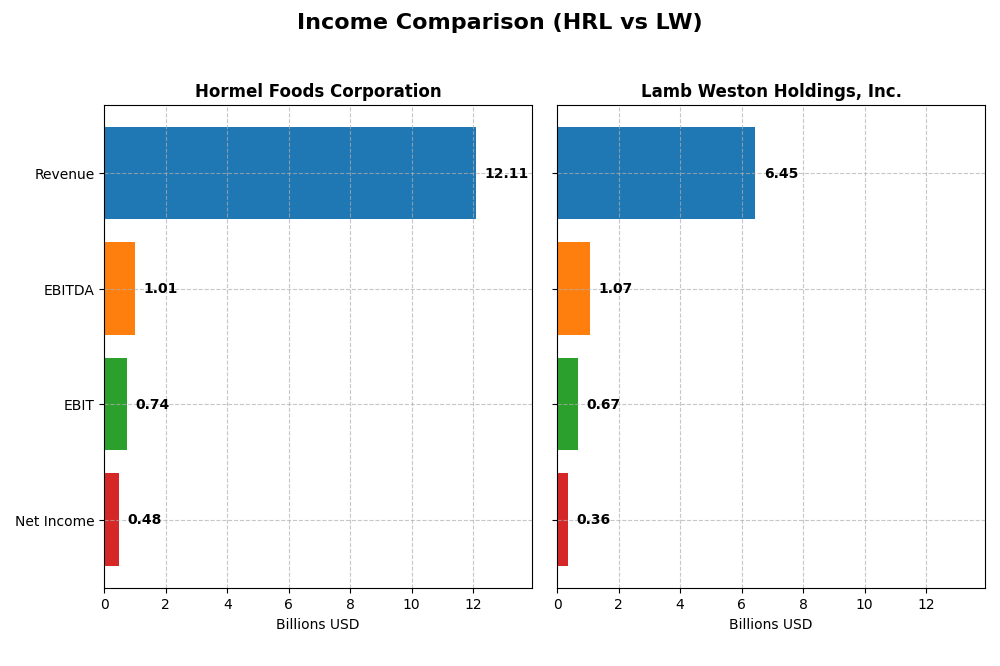
This table compares key income statement metrics for Hormel Foods Corporation and Lamb Weston Holdings, Inc. for the most recent fiscal year available.
| Metric | Hormel Foods Corporation (HRL) | Lamb Weston Holdings, Inc. (LW) |
|---|---|---|
| Market Cap | 12.6B | 5.8B |
| Revenue | 12.11B | 6.45B |
| EBITDA | 1.01B | 1.07B |
| EBIT | 742M | 665M |
| Net Income | 478M | 357M |
| EPS | 0.87 | 2.51 |
| Fiscal Year | 2025 | 2025 |
Income Statement Interpretations
Hormel Foods Corporation
Hormel Foods showed modest revenue growth of 6.32% over 2021-2025 but experienced a significant decline in net income by 47.38%. Margins remained mostly neutral, with a 15.45% gross margin and 3.95% net margin in 2025. The latest year showed slowed revenue growth of 1.55% and notable margin compression alongside a 40.82% drop in EPS.
Lamb Weston Holdings, Inc.
Lamb Weston’s revenue increased strongly by 75.74% over the period, with net income rising 12.4%. It maintained favorable gross and EBIT margins of 21.68% and 10.31%, respectively, in 2025. However, the most recent year saw a slight revenue decline of 0.25%, with substantial decreases in margins and EPS by around 50%, indicating a recent performance setback.
Which one has the stronger fundamentals?
Hormel Foods presents stable but shrinking profitability, with mostly neutral margins and unfavorable growth trends. Lamb Weston shows stronger top-line growth and better margin levels overall but faces significant recent declines in profitability and margins. While Hormel’s fundamentals appear cautious, Lamb Weston’s longer-term growth is more favorable despite recent volatility, resulting in a neutral comparative outlook.
Financial Ratios Comparison
The table below compares key financial ratios for Hormel Foods Corporation (HRL) and Lamb Weston Holdings, Inc. (LW) based on their most recent fiscal year data.
| Ratios | Hormel Foods Corporation (HRL) | Lamb Weston Holdings, Inc. (LW) |
|---|---|---|
| ROE | 6.04% | 20.56% |
| ROIC | 4.31% | 7.43% |
| P/E | 24.84 | 22.21 |
| P/B | 1.50 | 4.56 |
| Current Ratio | 2.47 | 1.38 |
| Quick Ratio | 1.20 | 0.68 |
| D/E (Debt-to-Equity) | 0.36 | 2.39 |
| Debt-to-Assets | 21.3% | 56.2% |
| Interest Coverage | 9.21 | 3.70 |
| Asset Turnover | 0.90 | 0.87 |
| Fixed Asset Turnover | 5.41 | 1.68 |
| Payout ratio | 132.4% | 57.9% |
| Dividend yield | 5.33% | 2.61% |
Interpretation of the Ratios
Hormel Foods Corporation
Hormel Foods shows a balanced financial profile with favorable liquidity and leverage ratios, including a strong current ratio of 2.47 and low debt-to-equity of 0.36. However, profitability metrics like net margin (3.95%) and return on equity (6.04%) are below expectations, signaling potential concerns. The company offers a dividend yield of 5.33%, supported by a stable payout ratio and free cash flow coverage, which suggests moderate shareholder returns.
Lamb Weston Holdings, Inc.
Lamb Weston presents a mixed ratio set with notable strength in return on equity at 20.56% and a favorable WACC of 4.8%. Conversely, its leverage ratios are less attractive, with a high debt-to-equity ratio of 2.39 and a debt-to-assets ratio over 56%, raising financial risk concerns. The dividend yield stands at 2.61%, indicating modest income returns, though the company’s liquidity ratios, such as a quick ratio of 0.68, are weak.
Which one has the best ratios?
Hormel Foods exhibits a slightly more favorable ratio profile, particularly in liquidity, leverage, and dividend yield, despite weaker profitability metrics. Lamb Weston’s superior profitability is offset by higher leverage and weaker liquidity, which increases financial risk. Overall, Hormel’s ratios suggest a more balanced financial position compared to Lamb Weston’s more leveraged and riskier stance.
Strategic Positioning
This section compares the strategic positioning of Hormel Foods Corporation (HRL) and Lamb Weston Holdings, Inc. (LW) including Market position, Key segments, and disruption:
Hormel Foods Corporation
- Established leader in packaged foods with competitive pressure from diversified branded products.
- Diverse segments: Grocery, Refrigerated Foods, Jennie-O Turkey Store, International & Other.
- Exposure to disruption not explicitly detailed in provided data.
Lamb Weston Holdings, Inc.
- Smaller market cap, focused on frozen potato products with moderate competitive pressure.
- Concentrated on frozen potatoes with segments: Global, Foodservice, Retail, and Other.
- Exposure to disruption not explicitly detailed in provided data.
Hormel Foods Corporation vs Lamb Weston Holdings, Inc. Positioning
HRL pursues a diversified approach across multiple food product segments, offering broader revenue streams. LW maintains a concentrated focus on frozen potato products, potentially limiting diversification but specializing in a niche market.
Which has the best competitive advantage?
Based on MOAT evaluation, LW shows a slightly favorable competitive advantage with value creation despite declining profitability. HRL exhibits a very unfavorable moat, destroying value with decreasing ROIC and profitability.
Stock Comparison
The stock price movements over the past year reveal contrasting dynamics between Hormel Foods Corporation and Lamb Weston Holdings, with notable declines and differing volume trends shaping their trading profiles.
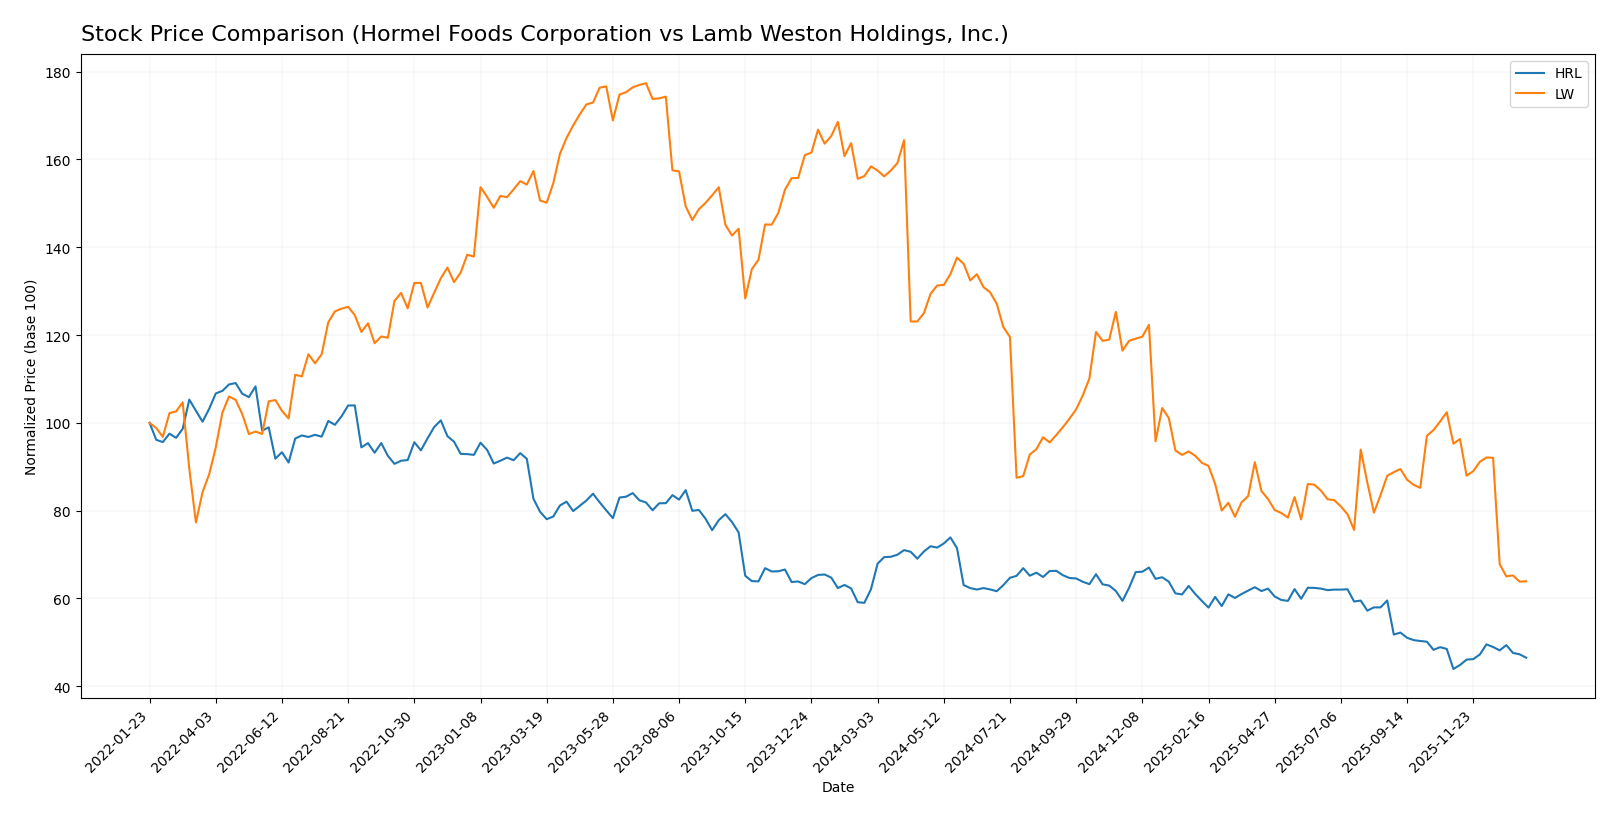
Trend Analysis
Hormel Foods Corporation’s stock experienced a 25.11% decline over the past year, indicating a bearish trend with accelerating downward momentum. The price fluctuated between a high of 36.31 and a low of 21.59, with moderate volatility (std dev 3.52).
Lamb Weston Holdings’ stock showed a sharper bearish trend, falling 59.65% over the same period with decelerating decline. Price volatility was significantly higher (std dev 15.2), ranging from 106.53 at peak to 41.37 at its lowest point.
Comparing both, Hormel Foods delivered a less severe loss and showed recent positive price movement, while Lamb Weston suffered a larger decline and more volatile trading, making Hormel the stronger performer overall.
Target Prices
The current analyst consensus indicates moderate upside potential for both Hormel Foods Corporation and Lamb Weston Holdings, Inc.
| Company | Target High | Target Low | Consensus |
|---|---|---|---|
| Hormel Foods Corporation | 30 | 26 | 27.75 |
| Lamb Weston Holdings, Inc. | 68 | 46 | 52.67 |
Analysts expect Hormel Foods to trade roughly 21% above its current price of $22.85, while Lamb Weston shows about 27% upside from $41.43. These targets suggest cautious optimism in both stocks.
Analyst Opinions Comparison
This section compares analysts’ ratings and grades for Hormel Foods Corporation (HRL) and Lamb Weston Holdings, Inc. (LW):
Rating Comparison
HRL Rating
- Rating: B, classified as Very Favorable overall rating.
- Discounted Cash Flow Score: 4, indicating a Favorable valuation.
- ROE Score: 2, showing Moderate efficiency in generating profit from equity.
- ROA Score: 3, reflecting Moderate effectiveness in asset utilization.
- Debt To Equity Score: 3, indicating Moderate financial risk.
- Overall Score: 3, a Moderate summary assessment of financial standing.
LW Rating
- Rating: B, classified as Very Favorable overall rating.
- Discounted Cash Flow Score: 4, indicating a Favorable valuation.
- ROE Score: 5, showing Very Favorable efficiency in generating profit from equity.
- ROA Score: 4, reflecting Favorable effectiveness in asset utilization.
- Debt To Equity Score: 1, indicating Very Unfavorable financial risk.
- Overall Score: 3, a Moderate summary assessment of financial standing.
Which one is the best rated?
Both HRL and LW share the same overall rating of B and an identical overall score of 3. However, LW outperforms HRL in profitability metrics like ROE and ROA but has a significantly weaker debt-to-equity score, suggesting higher financial risk.
Scores Comparison
Here is the comparison of the Altman Z-Score and Piotroski Score for Hormel Foods Corporation and Lamb Weston Holdings, Inc.:
HRL Scores
- Altman Z-Score: 5.17, in the safe zone, low bankruptcy risk.
- Piotroski Score: 7, strong financial health indication.
LW Scores
- Altman Z-Score: 2.75, in the grey zone, moderate bankruptcy risk.
- Piotroski Score: 9, very strong financial health indication.
Which company has the best scores?
Based on the provided data, HRL has a higher Altman Z-Score indicating lower bankruptcy risk, while LW has a superior Piotroski Score showing stronger financial health. Both excel in different evaluation aspects.
Grades Comparison
Here is a detailed comparison of the latest grades for Hormel Foods Corporation and Lamb Weston Holdings, Inc.:
Hormel Foods Corporation Grades
This table summarizes recent grades and actions from reputable grading companies for Hormel Foods Corporation.
| Grading Company | Action | New Grade | Date |
|---|---|---|---|
| Barclays | Maintain | Overweight | 2025-12-09 |
| JP Morgan | Maintain | Overweight | 2025-12-05 |
| B of A Securities | Maintain | Neutral | 2025-12-05 |
| Piper Sandler | Maintain | Neutral | 2025-12-05 |
| JP Morgan | Maintain | Overweight | 2025-11-21 |
| Piper Sandler | Maintain | Neutral | 2025-11-06 |
| Goldman Sachs | Maintain | Buy | 2025-10-30 |
| Goldman Sachs | Maintain | Buy | 2025-08-29 |
| B of A Securities | Maintain | Neutral | 2025-08-29 |
| Barclays | Maintain | Overweight | 2025-08-29 |
The grades for Hormel Foods show a consistent pattern of maintaining overweight and neutral ratings, with Goldman Sachs consistently issuing buy ratings.
Lamb Weston Holdings, Inc. Grades
The following table presents recent grades and actions from verified grading companies for Lamb Weston Holdings, Inc.
| Grading Company | Action | New Grade | Date |
|---|---|---|---|
| Wells Fargo | Maintain | Overweight | 2025-12-23 |
| Barclays | Maintain | Overweight | 2025-12-23 |
| B of A Securities | Maintain | Neutral | 2025-12-22 |
| Stifel | Maintain | Hold | 2025-12-22 |
| Deutsche Bank | Maintain | Hold | 2025-12-22 |
| Wells Fargo | Maintain | Overweight | 2025-10-01 |
| B of A Securities | Maintain | Neutral | 2025-10-01 |
| Barclays | Maintain | Overweight | 2025-07-25 |
| Wells Fargo | Maintain | Overweight | 2025-07-24 |
| Wells Fargo | Maintain | Overweight | 2025-07-09 |
The grades for Lamb Weston Holdings indicate a stable overweight consensus with some hold and neutral ratings, reflecting mixed but generally positive sentiment.
Which company has the best grades?
Both companies have a consensus rating of “Hold,” but Hormel Foods shows more buy and overweight grades from major banks, while Lamb Weston exhibits a stronger overweight bias but also some hold ratings. Investors may interpret Hormel’s buy signals as a sign of potential upside, whereas Lamb Weston’s overweight ratings suggest steady confidence with caution.
Strengths and Weaknesses
The table below summarizes the key strengths and weaknesses of Hormel Foods Corporation (HRL) and Lamb Weston Holdings, Inc. (LW) based on their recent financial performance, market presence, and innovation capabilities.
| Criterion | Hormel Foods Corporation (HRL) | Lamb Weston Holdings, Inc. (LW) |
|---|---|---|
| Diversification | Strong with multiple segments: Retail $7.46B, Foodservice $3.94B, International $0.71B (2025) | Moderate with focus on Foodservice $1.49B, Global $2.93B, Retail $0.80B (2023) |
| Profitability | Low net margin 3.95%, ROIC 4.31% below WACC 4.86%, value destroying | Higher net margin 5.54%, ROIC 7.43% above WACC 4.80%, value creating |
| Innovation | Limited recent innovation impact, declining ROIC trend -46% | Improving product reach, though ROIC declining -27% |
| Global presence | Solid international segment, but smaller compared to domestic | Global segment significant, stronger international footprint |
| Market Share | Strong in perishable meat and retail grocery sectors | Leading in frozen potato products with growing global reach |
Key takeaways: Hormel shows strong diversification but struggles with declining profitability and value destruction. Lamb Weston creates value with better profitability and global presence, though its ROIC is also declining. Investors should weigh stability versus growth potential carefully.
Risk Analysis
Below is a comparative table highlighting key risks for Hormel Foods Corporation (HRL) and Lamb Weston Holdings, Inc. (LW) based on the most recent data from 2025.
| Metric | Hormel Foods Corporation (HRL) | Lamb Weston Holdings, Inc. (LW) |
|---|---|---|
| Market Risk | Low beta (0.32) indicates lower volatility vs. market | Moderate beta (0.44), slightly higher volatility |
| Debt level | Low debt-to-equity (0.36), favorable leverage | High debt-to-equity (2.39), unfavorable leverage |
| Regulatory Risk | Moderate, typical for food packaging industry | Moderate, similar sector regulatory exposure |
| Operational Risk | Diversified product portfolio reduces operational risk | Concentrated in frozen potato products, higher operational risk |
| Environmental Risk | Moderate, food production impacts and sustainability pressures | Moderate, focus on frozen products with supply chain impacts |
| Geopolitical Risk | Low, primarily US and international markets | Low to moderate, global supply chain exposure |
Hormel Foods’ most significant risk lies in modest profitability with a net margin under 4%, though it benefits from low leverage and strong liquidity. Lamb Weston faces higher financial risk due to its elevated debt levels and lower liquidity ratios, despite stronger profitability metrics. Operational risk is more concentrated for Lamb Weston given its narrower product focus. Investors should weigh these factors carefully in risk management.
Which Stock to Choose?
Hormel Foods Corporation (HRL) shows a slightly favorable financial ratios profile despite unfavorable income statement growth, with declining profitability and a very unfavorable MOAT rating indicating value destruction. Its debt levels and liquidity ratios are favorable, and ratings are very favorable overall.
Lamb Weston Holdings, Inc. (LW) presents a neutral income statement evaluation with mixed growth trends, a slightly unfavorable financial ratios profile due to high leverage, but a slightly favorable MOAT rating suggesting value creation despite declining profitability. Its ratings are also very favorable but tempered by financial risk.
For investors prioritizing financial stability and moderate risk, HRL might appear more attractive due to its stronger liquidity and lower debt, while those focused on growth potential could see LW’s higher profitability and income growth as more favorable despite its financial risk. The choice could depend on the investor’s risk tolerance and strategy emphasis.
Disclaimer: Investment carries a risk of loss of initial capital. The past performance is not a reliable indicator of future results. Be sure to understand risks before making an investment decision.
Go Further
I encourage you to read the complete analyses of Hormel Foods Corporation and Lamb Weston Holdings, Inc. to enhance your investment decisions: