In the dynamic world of packaged foods, JBS N.V. and Hormel Foods Corporation stand out as influential players with strong market presence and innovative strategies. JBS, a global protein powerhouse, and Hormel, a diversified food producer with iconic brands, both cater to evolving consumer tastes and sustainability trends. This comparison explores their strengths and growth potential, helping you decide which company deserves a spot in your investment portfolio.
Table of contents
Companies Overview
I will begin the comparison between JBS N.V. and Hormel Foods Corporation by providing an overview of these two companies and their main differences.
JBS N.V. Overview
JBS N.V. operates globally as a protein and food company, offering a wide range of products including beef, pork, chicken, fish, and plant-based foods. Founded in 1953 and headquartered in Amstelveen, Netherlands, it also diversifies into leather, biodiesel, and packaging products, alongside services such as logistics and electric power production. JBS employs approximately 280K people and is listed on the NYSE under the ticker JBS, with a market cap of about 31.7B USD.
Hormel Foods Corporation Overview
Hormel Foods Corporation, based in Austin, Minnesota, focuses on developing, processing, and distributing meat, nuts, and various food products primarily in the U.S. and internationally. Established in 1891, it operates through multiple segments including Grocery and Refrigerated Foods. Hormel has about 20K employees, trades on the NYSE as HRL, and holds a market capitalization near 12.6B USD. It is known for brands such as SKIPPY, SPAM, and Jennie-O.
Key similarities and differences
Both companies operate in the packaged foods industry with a strong focus on meat and protein products, serving global and domestic markets respectively. JBS has a broader product portfolio including leather, biodiesel, and extensive logistics services, while Hormel emphasizes branded consumer goods and food segments. JBS is significantly larger in terms of employees and market cap, whereas Hormel maintains a more concentrated U.S. presence with a diverse range of shelf-stable and perishable food items.
Income Statement Comparison
The table below compares the key income statement metrics for JBS N.V. and Hormel Foods Corporation for their most recent fiscal year, providing a snapshot of their financial performance.

| Metric | JBS N.V. (2024) | Hormel Foods Corporation (2025) |
|---|---|---|
| Market Cap | 31.7B USD | 12.6B USD |
| Revenue | 417B BRL | 12.1B USD |
| EBITDA | 35.4B BRL | 1.01B USD |
| EBIT | 25.7B BRL | 742M USD |
| Net Income | 9.62B BRL | 478M USD |
| EPS | 30.55 BRL | 0.87 USD |
| Fiscal Year | 2024 | 2025 |
Income Statement Interpretations
JBS N.V.
JBS has shown strong revenue growth of 54.31% over 2020-2024, with net income more than doubling during this period. Margins have remained stable, with a gross margin of 15.06% and a net margin of 2.31% in 2024. The company’s 2024 performance was notably robust, with revenue up 14.61% and net income surging 890.83%, reflecting significant margin and profitability improvements.
Hormel Foods Corporation
Hormel’s revenue growth over 2021-2025 was modest at 6.32%, but net income declined by 47.38%, with margins contracting accordingly. Its 2025 results showed a slight revenue increase of 1.55%, yet net income fell by over 40%, indicating pressure on profitability. Gross and EBIT margins held steady near 15.45% and 6.13%, but the recent margin decline contributed to an unfavorable income trend.
Which one has the stronger fundamentals?
JBS displays stronger fundamentals with consistent revenue and net income growth, improving margins, and favorable interest expense metrics. Hormel, contrastingly, faces declining net income and margin contraction despite stable gross margins. The overall income statement evaluation rates JBS favorably, while Hormel’s metrics suggest weaker profitability and growth prospects over the period.
Financial Ratios Comparison
The table below compares key financial ratios for JBS N.V. and Hormel Foods Corporation based on their most recent fiscal year data, providing a snapshot of their financial health and valuation metrics.
| Ratios | JBS N.V. (2024) | Hormel Foods Corporation (2025) |
|---|---|---|
| ROE | 21.47% | 6.04% |
| ROIC | 8.61% | 4.31% |
| P/E | 3.20 | 24.84 |
| P/B | 0.69 | 1.50 |
| Current Ratio | 1.47 | 2.47 |
| Quick Ratio | 0.90 | 1.20 |
| D/E (Debt-to-Equity) | 3.01 | 0.36 |
| Debt-to-Assets | 53.56% | 21.34% |
| Interest Coverage | 2.33 | 9.21 |
| Asset Turnover | 1.65 | 0.90 |
| Fixed Asset Turnover | 4.85 | 5.41 |
| Payout ratio | 46.14% | 132.41% |
| Dividend yield | 14.42% | 5.33% |
Interpretation of the Ratios
JBS N.V.
JBS shows a mixed set of ratios with favorable metrics in ROE (21.47%), WACC (4.56%), PE (3.2), and asset turnover (1.65), indicating efficient capital use and low valuation. However, concerns include a low net margin (2.31%) and high leverage with debt-to-equity at 3.01 and debt-to-assets at 53.56%. The company pays a dividend with a high yield of 14.42%, suggesting significant shareholder returns, but this may carry risks if distributions are unsustainable.
Hormel Foods Corporation
Hormel’s ratios reveal some weaknesses, with unfavorable net margin (3.95%), ROE (6.04%), and ROIC (4.31%), pointing to moderate profitability and capital efficiency challenges. Positives include strong liquidity (current ratio 2.47, quick ratio 1.2), low leverage (debt-to-equity 0.36), and solid interest coverage (9.51). The dividend yield is moderate at 5.33%, providing steady shareholder returns without aggressive risk from leverage or payout pressure.
Which one has the best ratios?
Both JBS and Hormel exhibit a balanced profile with 50% favorable ratios and 21.43% unfavorable, leading to a slightly favorable overall opinion. JBS excels in profitability and asset efficiency but carries higher financial risk due to leverage. Hormel offers stronger liquidity and lower debt but faces weaker profitability metrics. The choice depends on investor priorities between risk and return.
Strategic Positioning
This section compares the strategic positioning of JBS and HRL, including market position, key segments, and exposure to disruption:
JBS
- Operates globally in protein and food with diverse products, facing broad competitive pressure.
- Key segments include beef, pork, chicken, plant-based foods, leather, biodiesel, and logistics.
- Exposure to disruption includes plant-based foods and energy markets, leveraging broad operations.
HRL
- US-focused meat, nuts, and food products with retail, foodservice, deli, and commercial customers.
- Key segments are Grocery, Refrigerated Foods, Jennie-O Turkey, and International with diverse brands.
- Exposure to processed and shelf-stable foods; less emphasis on emerging food technologies.
JBS vs HRL Positioning
JBS follows a diversified global strategy spanning multiple protein types and related industries, enhancing operational breadth. HRL concentrates on US markets with strong branded segments, focusing on packaged and processed foods. Diversification offers scale but complexity; concentration may allow focused brand management.
Which has the best competitive advantage?
JBS shows a slightly favorable moat with value creation despite declining ROIC, indicating some competitive advantage. HRL displays a very unfavorable moat with value destruction and sharply declining profitability, suggesting weaker competitive positioning.
Stock Comparison
The stock price movements over the past year reveal contrasting trends for JBS N.V. and Hormel Foods Corporation, with JBS showing moderate gains and Hormel experiencing a significant decline, alongside shifting trading volumes and buyer behaviors.
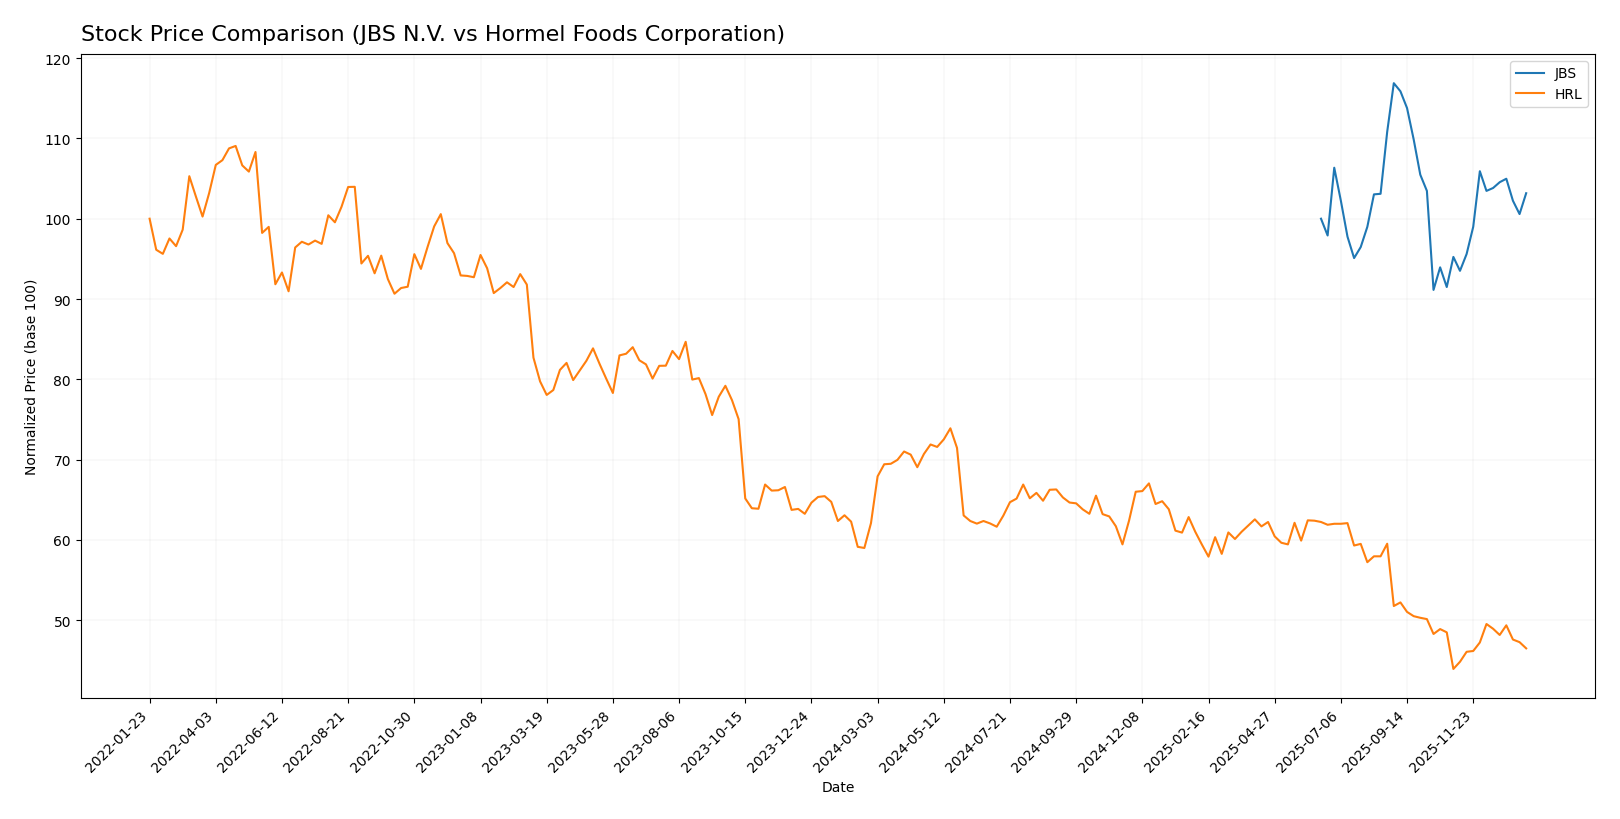
Trend Analysis
JBS N.V. exhibited a bullish trend over the past 12 months with a 3.17% price increase, showing acceleration and a moderate volatility level (0.9 std deviation), reaching a high of 16.21 and a low of 12.64.
Hormel Foods Corporation experienced a bearish trend with a 25.11% price decrease, also with acceleration but higher volatility (3.52 std deviation), hitting a peak of 36.31 and a bottom of 21.59.
Comparing both stocks, JBS N.V. delivered the highest market performance over the past year, contrasting with Hormel’s pronounced negative price trend.
Target Prices
The current analyst consensus indicates promising upside potential for both JBS N.V. and Hormel Foods Corporation.
| Company | Target High | Target Low | Consensus |
|---|---|---|---|
| JBS N.V. | 20 | 17 | 18.5 |
| Hormel Foods Corporation | 30 | 26 | 27.75 |
Analysts expect JBS shares to appreciate from the current price of 14.31 USD to a consensus target of 18.5 USD, while Hormel Foods is projected to rise from 22.85 USD to 27.75 USD, reflecting moderate bullish sentiment.
Analyst Opinions Comparison
This section compares the analysts’ ratings and grades for JBS N.V. and Hormel Foods Corporation:
Rating Comparison
JBS Rating
- Rated A, indicating a very favorable outlook according to analysts.
- Discounted Cash Flow Score of 4, showing a favorable valuation based on future cash flows.
- Return on Equity Score of 5, a very favorable indicator of efficient profit generation from equity.
- Return on Assets Score of 5, very favorable for effective asset utilization.
- Debt To Equity Score of 1, very unfavorable, indicating high financial risk due to leverage.
- Overall Score of 4, reflecting a favorable overall financial standing.
HRL Rating
- Rated B, also considered very favorable but lower than JBS.
- Discounted Cash Flow Score of 4, also reflecting favorable valuation metrics.
- Return on Equity Score of 2, indicating moderate efficiency in profit generation.
- Return on Assets Score of 3, moderate effectiveness in using assets to generate earnings.
- Debt To Equity Score of 3, moderate financial risk with balanced leverage.
- Overall Score of 3, reflecting a moderate overall financial standing.
Which one is the best rated?
Based strictly on the provided data, JBS holds a superior rating with an overall score of 4 versus HRL’s 3. JBS also outperforms HRL in ROE, ROA, and maintains a favorable DCF score despite a weaker debt-to-equity rating.
Scores Comparison
Here is the comparison of the Altman Z-Score and Piotroski Score for JBS and HRL:
JBS Scores
- Altman Z-Score: 10.74, indicating a safe zone.
- Piotroski Score: 8, classified as very strong.
HRL Scores
- Altman Z-Score: 5.17, indicating a safe zone.
- Piotroski Score: 7, classified as strong.
Which company has the best scores?
Based on the provided data, JBS has higher scores in both Altman Z-Score and Piotroski Score, reflecting stronger financial stability and health than HRL.
Grades Comparison
The grades assigned by reputable financial institutions for JBS N.V. and Hormel Foods Corporation are as follows:
JBS N.V. Grades
The following table summarizes recent grades by recognized grading companies for JBS N.V.:
| Grading Company | Action | New Grade | Date |
|---|---|---|---|
| JP Morgan | Maintain | Overweight | 2025-10-14 |
| JP Morgan | Maintain | Overweight | 2025-09-03 |
| Stephens & Co. | Maintain | Overweight | 2025-08-15 |
| Stephens & Co. | Maintain | Overweight | 2025-06-26 |
Overall, JBS N.V. has consistently received “Overweight” grades, reflecting a positive sentiment from major financial analysts.
Hormel Foods Corporation Grades
The following table presents the latest grades issued by reputable firms for Hormel Foods Corporation:
| Grading Company | Action | New Grade | Date |
|---|---|---|---|
| Barclays | Maintain | Overweight | 2025-12-09 |
| JP Morgan | Maintain | Overweight | 2025-12-05 |
| B of A Securities | Maintain | Neutral | 2025-12-05 |
| Piper Sandler | Maintain | Neutral | 2025-12-05 |
| JP Morgan | Maintain | Overweight | 2025-11-21 |
| Piper Sandler | Maintain | Neutral | 2025-11-06 |
| Goldman Sachs | Maintain | Buy | 2025-10-30 |
| Goldman Sachs | Maintain | Buy | 2025-08-29 |
| B of A Securities | Maintain | Neutral | 2025-08-29 |
| Barclays | Maintain | Overweight | 2025-08-29 |
Hormel Foods exhibits a mixed range of grades from “Buy” to “Neutral” and “Overweight,” indicating some divergence in analyst opinions.
Which company has the best grades?
JBS N.V. has a more uniform and consistently positive grading trend with repeated “Overweight” ratings, while Hormel Foods shows a broader spread including “Neutral” and “Buy” grades. This suggests JBS may currently enjoy stronger analyst confidence, which could influence investor perception of relative stability and growth potential.
Strengths and Weaknesses
Below is a comparative overview of the key strengths and weaknesses of JBS N.V. and Hormel Foods Corporation based on the latest available data.
| Criterion | JBS N.V. | Hormel Foods Corporation |
|---|---|---|
| Diversification | Moderate product range focused on meat processing; less diversified geographically. | Highly diversified product segments including foodservice, retail, and international markets. |
| Profitability | ROIC 8.61% with favorable ROE (21.47%), but net margin low at 2.31%. | Lower profitability with ROIC 4.31% and ROE 6.04%, net margin 3.95%. |
| Innovation | Limited recent innovation data; moderate asset turnover efficiency (4.85 fixed asset turnover). | Strong focus on diverse product lines, implying ongoing innovation; fixed asset turnover at 5.41. |
| Global presence | Strong presence especially in meat markets, but facing declining profitability trend. | Global footprint with international segment, though profitability declining sharply. |
| Market Share | Large market share in meat processing industry. | Significant share in various food segments, especially retail and foodservice. |
Key takeaways: JBS creates value with decent profitability but faces a declining ROIC trend and higher leverage risks. Hormel Foods shows strong diversification and global reach but is currently destroying value with declining profitability. Both companies warrant cautious consideration with attention to their profitability trajectories and risk factors.
Risk Analysis
The table below highlights key risk factors for JBS N.V. and Hormel Foods Corporation based on the most recent data from 2025 and 2024.
| Metric | JBS N.V. | Hormel Foods Corporation |
|---|---|---|
| Market Risk | Beta 0.48 (moderate volatility) | Beta 0.32 (low volatility) |
| Debt level | High leverage (D/E 3.01, Debt to assets 53.56%) | Low leverage (D/E 0.36, Debt to assets 21.34%) |
| Regulatory Risk | Moderate, global food industry regulations | Moderate, primarily US regulations |
| Operational Risk | Large scale global operations, complex supply chain | More focused US operations, less complexity |
| Environmental Risk | Exposure to environmental impact in livestock and biodiesel | Moderate, focus on sustainability initiatives |
| Geopolitical Risk | High, operations in multiple countries including Brazil | Moderate, mainly US market exposure |
JBS faces significant debt-related risk due to its high leverage, which could impact financial stability under adverse market conditions. Hormel benefits from lower debt and operational concentration in stable US markets, reducing exposure to geopolitical and regulatory uncertainties. The most impactful risk for JBS remains its high debt level, while Hormel’s primary risks relate to market competition and regulatory changes.
Which Stock to Choose?
JBS N.V. shows a favorable income evolution with strong growth in revenue and net income over recent years, supported by a slightly favorable global ratios evaluation. Profitability is decent with a 21.47% ROE but offset by high debt levels and a very favorable overall rating.
Hormel Foods Corporation presents an unfavorable income evolution marked by declines in net income and margins, alongside a moderate global ratios evaluation. Profitability ratios are generally weaker with lower ROE, but the company benefits from lower debt and a very favorable rating status.
Investors focused on growth and value creation might find JBS’s favorable income growth and strong profitability metrics appealing, despite its higher leverage. Conversely, risk-averse investors or those prioritizing financial stability could see Hormel’s lower debt and moderate ratios as more suitable, although its income trends are less encouraging.
Disclaimer: Investment carries a risk of loss of initial capital. The past performance is not a reliable indicator of future results. Be sure to understand risks before making an investment decision.
Go Further
I encourage you to read the complete analyses of JBS N.V. and Hormel Foods Corporation to enhance your investment decisions: