Home > Comparison > Industrials > HON vs ROP
The strategic rivalry between Honeywell International Inc. and Roper Technologies, Inc. shapes the Industrials sector’s evolution. Honeywell operates as a diversified conglomerate with broad manufacturing and technology exposure. Roper focuses on specialized industrial machinery and software solutions, leveraging precision and innovation. This analysis explores their contrasting models and growth vectors. I aim to identify which company presents the superior risk-adjusted potential for inclusion in a diversified portfolio amid sector uncertainties.
Table of contents
Companies Overview
Honeywell International and Roper Technologies both command significant industrial market roles with distinct operational models.
Honeywell International Inc.: Diversified Industrial Technology Leader
Honeywell International dominates as a diversified technology and manufacturing giant. Its core revenue stems from aerospace systems, building technologies, and performance materials. In 2026, Honeywell focuses strategically on expanding software integration and eco-friendly materials across operations to maintain its innovation edge.
Roper Technologies, Inc.: Specialist in Software-Driven Industrial Solutions
Roper Technologies excels in engineered products and software solutions across multiple industrial verticals. Its revenue engine relies on cloud-based software, data analytics, and precision instruments. The company’s 2026 strategy centers on scaling cloud infrastructure and analytics to deepen customer integration and enhance operational efficiencies.
Strategic Collision: Similarities & Divergences
Honeywell pursues a broad conglomerate approach blending hardware and software, while Roper specializes in software-led solutions with targeted industrial applications. Their battleground lies in industrial automation and data analytics services. Investors face contrasting profiles: Honeywell’s scale and diversification versus Roper’s focused innovation and growth agility.
Income Statement Comparison
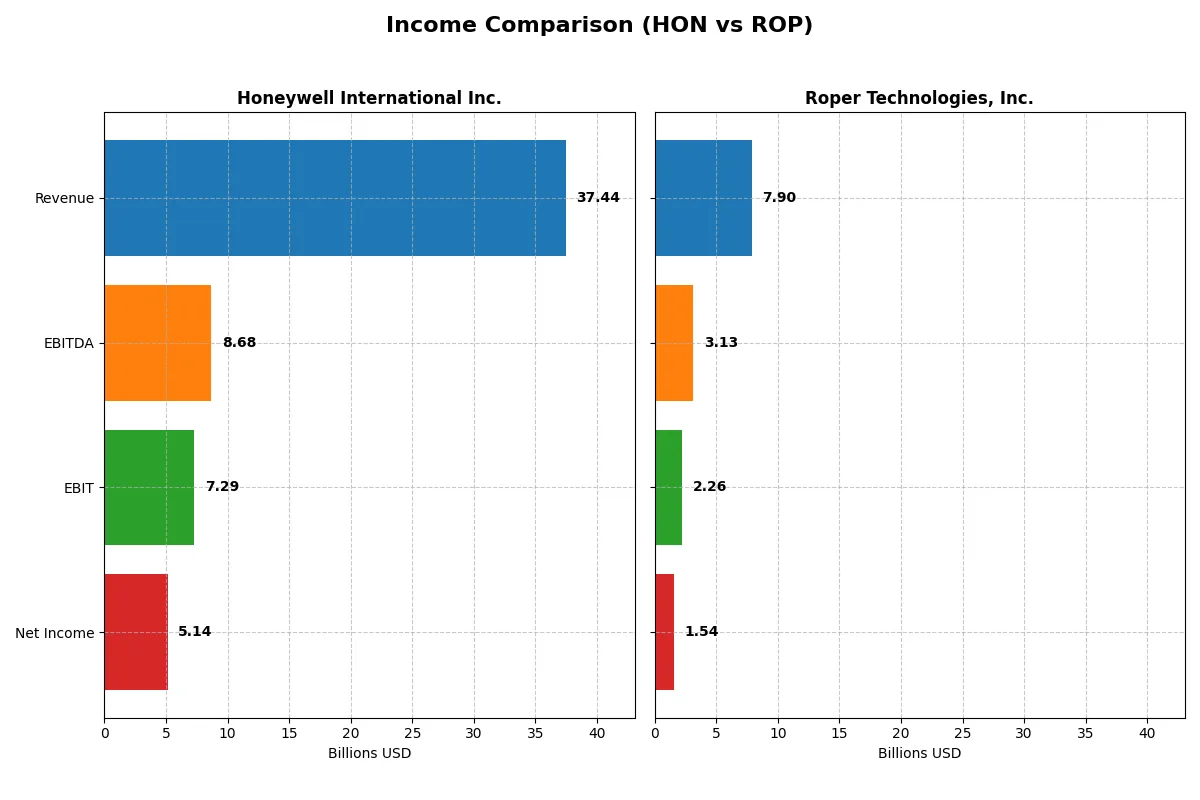
This data dissects the core profitability and scalability of both corporate engines to reveal who dominates the bottom line:
| Metric | Honeywell International Inc. (HON) | Roper Technologies, Inc. (ROP) |
|---|---|---|
| Revenue | 37.4B | 7.9B |
| Cost of Revenue | 23.6B | 2.4B |
| Operating Expenses | 7.2B | 3.2B |
| Gross Profit | 13.8B | 5.5B |
| EBITDA | 8.7B | 3.1B |
| EBIT | 7.3B | 2.3B |
| Interest Expense | 1.3B | 0.3B |
| Net Income | 5.1B | 1.5B |
| EPS | 8.03 | 14.31 |
| Fiscal Year | 2025 | 2025 |
Income Statement Analysis: The Bottom-Line Duel
This income statement comparison reveals which company drives profitability and operational efficiency more effectively through their financial performance.
Honeywell International Inc. Analysis
Honeywell’s revenue grew moderately by 8.9% from 2021 to 2025 but declined 2.7% in 2025 alone. Net income fell 7.3% overall and 7.4% in 2025, reflecting margin pressure. The 2025 gross margin stood at 36.9%, and net margin at 13.7%, both favorable but sliding. Recent results show weakening momentum and declining profitability.
Roper Technologies, Inc. Analysis
Roper’s revenue surged 63.5% over five years and gained 12.3% in 2025, signaling strong top-line growth. Net income climbed 40.1% overall despite a 11.7% net margin dip in 2025. Roper boasts a robust 69.2% gross margin and 19.4% net margin, illustrating superior operational leverage. The latest year reflects solid efficiency and expanding earnings power.
Margin Strength vs. Growth Trajectory
Roper outperforms Honeywell in revenue growth and net income expansion, underpinned by significantly higher margins. Honeywell’s stable but declining margins contrast with Roper’s dynamic profitability gains. For investors prioritizing growth and margin resilience, Roper presents a more compelling profile, while Honeywell’s fading momentum demands cautious scrutiny.
Financial Ratios Comparison
These vital ratios act as a diagnostic tool to expose the underlying fiscal health, valuation premiums, and capital efficiency of the companies compared below:
| Ratios | Honeywell International Inc. (HON) | Roper Technologies, Inc. (ROP) |
|---|---|---|
| ROE | 33.3% | 0% |
| ROIC | 9.4% | 0% |
| P/E | 24.1 | 31.1 |
| P/B | 8.0 | 0 |
| Current Ratio | 1.32 | 0 |
| Quick Ratio | 1.05 | 0 |
| D/E (Debt-to-Equity) | 2.14 | 0 |
| Debt-to-Assets | 44.6% | 0 |
| Interest Coverage | 5.16 | 6.88 |
| Asset Turnover | 0.54 | 0 |
| Fixed Asset Turnover | 8.71 | 0 |
| Payout Ratio | 57.9% | 23.1% |
| Dividend Yield | 2.40% | 0.74% |
| Fiscal Year | 2025 | 2025 |
Efficiency & Valuation Duel: The Vital Signs
Financial ratios act as a company’s DNA, uncovering hidden risks and operational strengths that shape investment decisions.
Honeywell International Inc.
Honeywell delivers robust profitability with a 33.3% ROE and a healthy 12.7% net margin. Its P/E ratio of 24.1 signals a fairly valued stock, though an 8.0 PB ratio flags some premium pricing. A 2.4% dividend yield enhances shareholder returns, complemented by steady reinvestment in R&D at 4.7% of revenue.
Roper Technologies, Inc.
Roper shows a strong 19.4% net margin but lacks ROE and ROIC data, reflecting possible reporting gaps or structural challenges. Its P/E stands at 31.1, marking it as expensive, while zero current and quick ratios raise liquidity concerns. A modest 0.74% dividend yield suggests limited direct shareholder returns amid uncertain capital allocation.
Balanced Profitability vs. Valuation Risk
Honeywell offers a stronger balance of profitability and valuation metrics with favorable cash flow and dividend support. Roper’s high margin is offset by valuation stretch and liquidity red flags. Investors seeking operational safety might lean toward Honeywell; those prioritizing margin potential face higher risk with Roper.
Which one offers the Superior Shareholder Reward?
Honeywell International Inc. (HON) delivers a balanced distribution strategy with a 2.4% dividend yield and a sustainable 58% payout ratio, supported by strong free cash flow coverage. Its moderate buyback program complements dividends, enhancing shareholder returns steadily. Roper Technologies, Inc. (ROP) offers lower dividend yield at 0.74%, with a conservative 23% payout ratio, but allocates more aggressively to share buybacks fueled by robust free cash flow and high operating margins. Historically, ROP’s reinvestment and buybacks drive higher capital appreciation, yet its lower yield and coverage introduce risk during downturns. I find Honeywell’s dividend-plus-buyback model more sustainable and attractive for total return in 2026, given its stable cash flow and prudent capital allocation.
Comparative Score Analysis: The Strategic Profile
The radar chart reveals the fundamental DNA and trade-offs of Honeywell International and Roper Technologies, highlighting their strategic strengths and weaknesses:
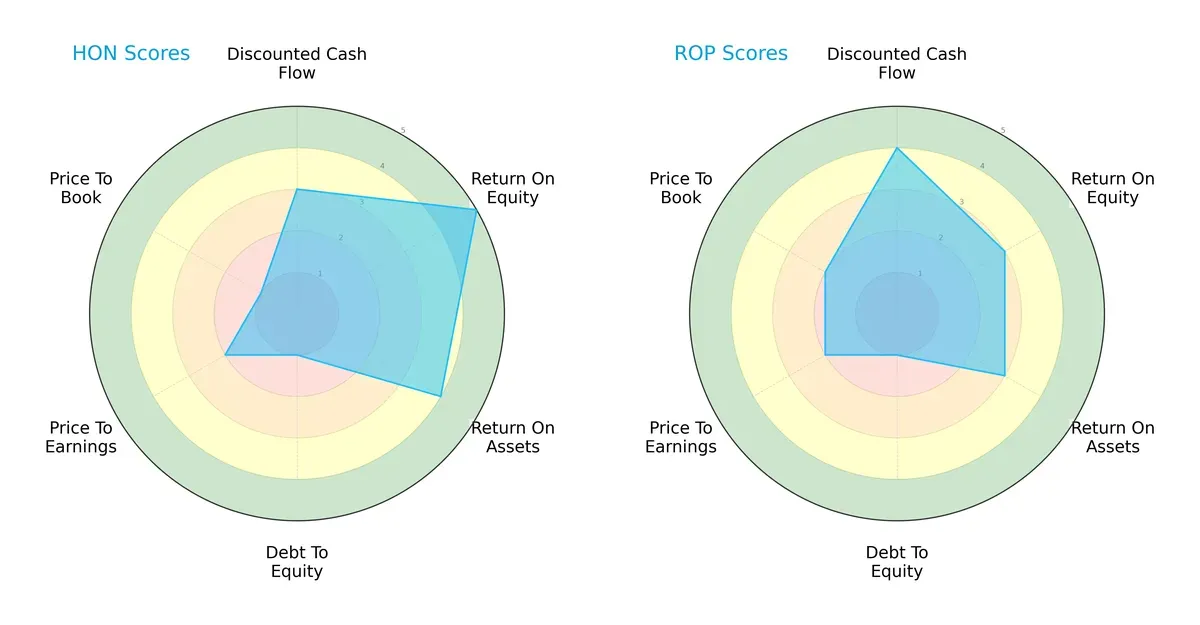
Honeywell excels in return on equity (5 vs. 3) and return on assets (4 vs. 3), showcasing operational efficiency. Roper leads slightly in discounted cash flow (4 vs. 3) and price-to-book valuation (2 vs. 1), suggesting better market pricing. Both share a weak debt-to-equity score (1), indicating high leverage risks. Honeywell’s profile is more focused on profitability, while Roper offers a more balanced valuation approach.
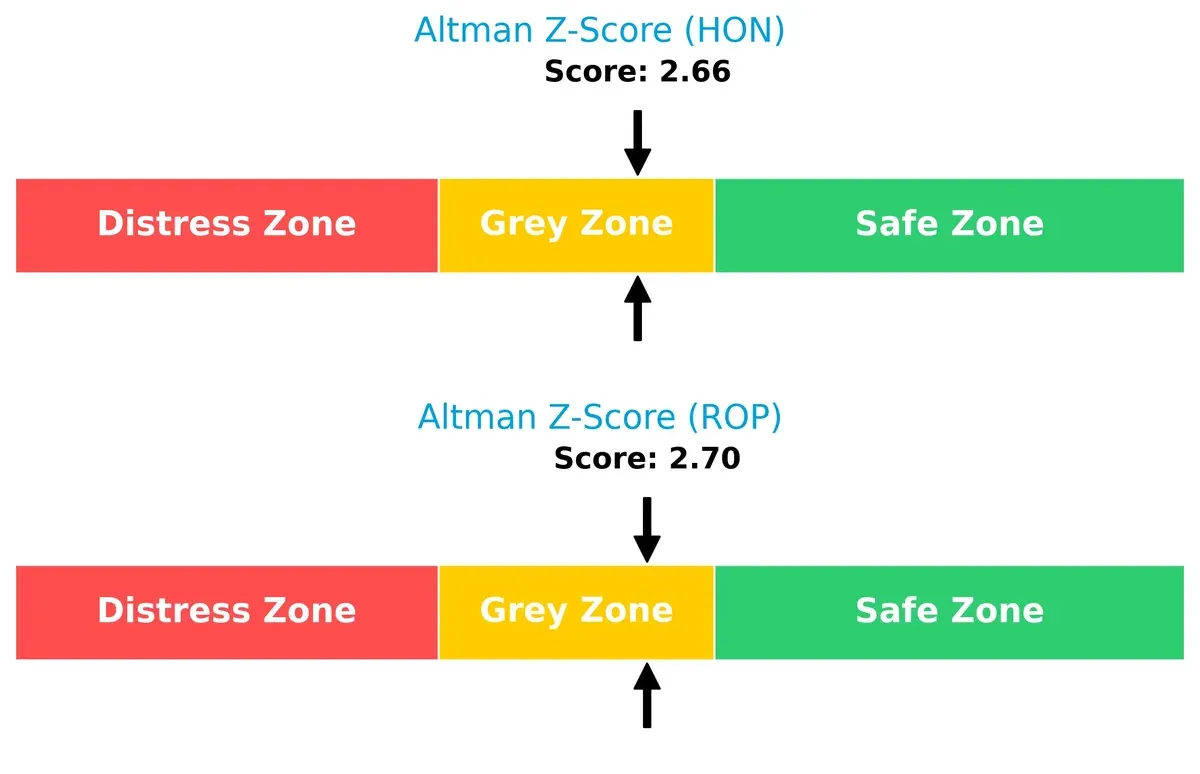
Bankruptcy Risk: Solvency Showdown
The Altman Z-Scores place both firms in the grey zone, with Roper slightly ahead at 2.70 vs. 2.66 for Honeywell, indicating moderate bankruptcy risk for both in this cycle:
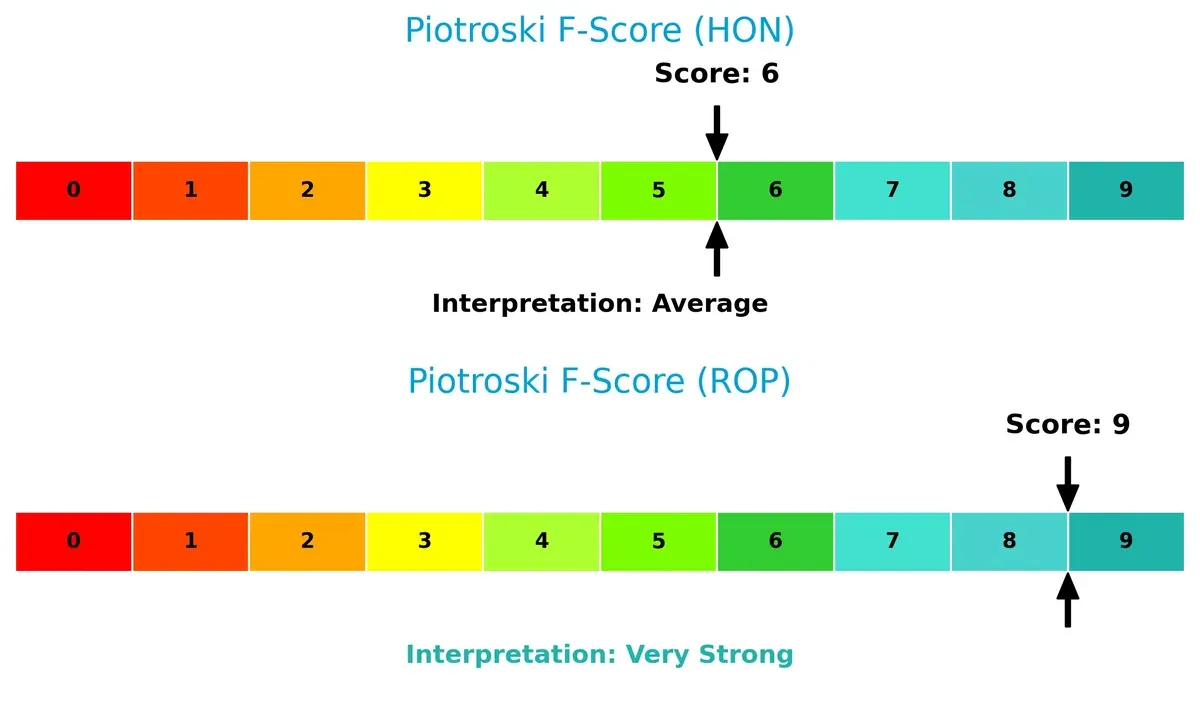
Financial Health: Quality of Operations
Roper’s Piotroski F-Score of 9 signals peak financial health and robust internal metrics, while Honeywell’s 6 suggests average strength with possible red flags in operational quality:
How are the two companies positioned?
This section dissects the operational DNA of HON and ROP by comparing their revenue distribution and internal strengths and weaknesses. The goal is to confront their economic moats to reveal which model offers the most resilient competitive advantage today.
Revenue Segmentation: The Strategic Mix
This visual comparison dissects how Honeywell International Inc. and Roper Technologies, Inc. diversify their income streams and where their primary sector bets lie:
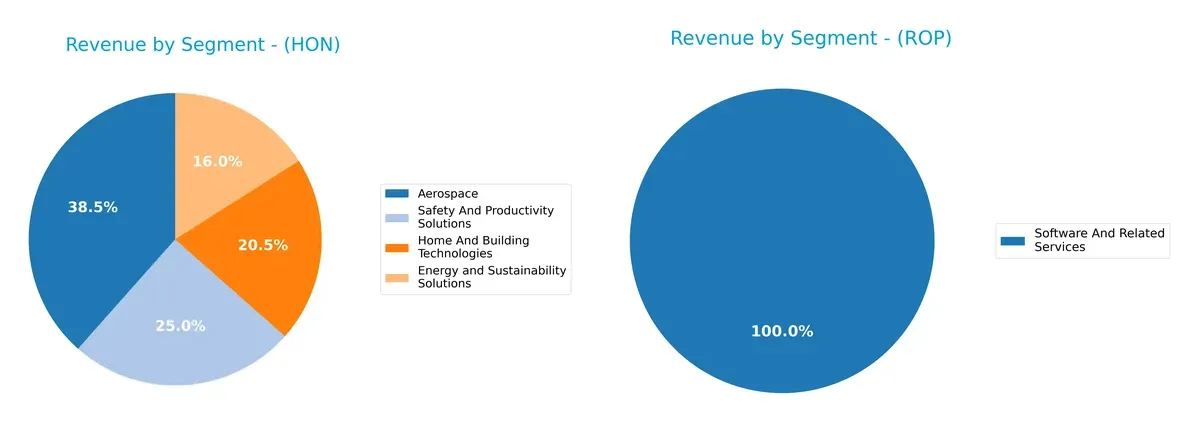
Honeywell anchors revenue in Aerospace at $15.5B and balances four strong segments, showing broad industrial diversification. Roper pivots almost entirely on Software and Related Services at $10.7B, reflecting a focused tech-driven model. Honeywell’s mix reduces concentration risk and leverages infrastructure dominance. Roper’s reliance on software heightens vulnerability but benefits from ecosystem lock-in and high-margin growth potential. Both strategies reveal distinct paths to market resilience.
Strengths and Weaknesses Comparison
This table compares the Strengths and Weaknesses of Honeywell International Inc. (HON) and Roper Technologies, Inc. (ROP):
HON Strengths
- Diversified revenue across Aerospace, Home Technologies, Energy, Safety
- Favorable net margin of 12.74%
- Strong ROE at 33.28%
- Favorable quick ratio and interest coverage
- Global presence with significant US and Europe sales
ROP Strengths
- High net margin of 19.44%
- Favorable debt to equity and debt to assets ratios
- Strong interest coverage at 6.96
- Focused software and technology segments
- Presence in US and growing international markets
HON Weaknesses
- Elevated debt to equity at 2.14 is unfavorable
- Price-to-book ratio at 8.03 is high
- Neutral ROIC at 9.41% close to WACC
- Asset turnover moderate at 0.54
- Current ratio only neutral at 1.32
ROP Weaknesses
- Zero or unavailable ROE and ROIC indicate profitability concerns
- Unfavorable P/E at 31.06
- Poor liquidity ratios (current and quick ratio at zero)
- Low dividend yield at 0.74%
- Asset turnover and fixed asset turnover unavailable
Honeywell’s diversified business mix supports stable revenues and profitability despite moderate leverage risks. Roper focuses on high-margin software but shows liquidity and profitability weaknesses, indicating potential operational or reporting limitations.
The Moat Duel: Analyzing Competitive Defensibility
A structural moat protects long-term profits from relentless competition erosion. Only a durable competitive advantage secures sustainable economic profits:
Honeywell International Inc.: Diversified Engineering Moat
Honeywell’s moat stems from its intangible assets and diversified technology portfolio. It sustains high ROIC above WACC, reflecting efficient capital use. However, a declining ROIC trend signals future challenges amid shifting industrial demands in 2026.
Roper Technologies, Inc.: Software-Driven Niche Moat
Roper’s moat relies on specialized software solutions and engineered products, offering higher gross and EBIT margins than Honeywell. Its revenue growth outpaces peers, but missing ROIC data clouds full moat assessment. Growth in cloud analytics could deepen its edge in 2026.
Engineering Complexity vs. Software Specialization: The Moat Showdown
Honeywell’s wider moat benefits from legacy diversification and steady value creation despite margin pressure. Roper’s deeper margin profile and software focus show promise but lack full ROIC validation. Honeywell remains better positioned to defend market share amid industrial shifts.
Which stock offers better returns?
Over the past 12 months, Honeywell International Inc. advanced steadily with clear acceleration, while Roper Technologies, Inc. faced a sharp downturn and decelerating losses.
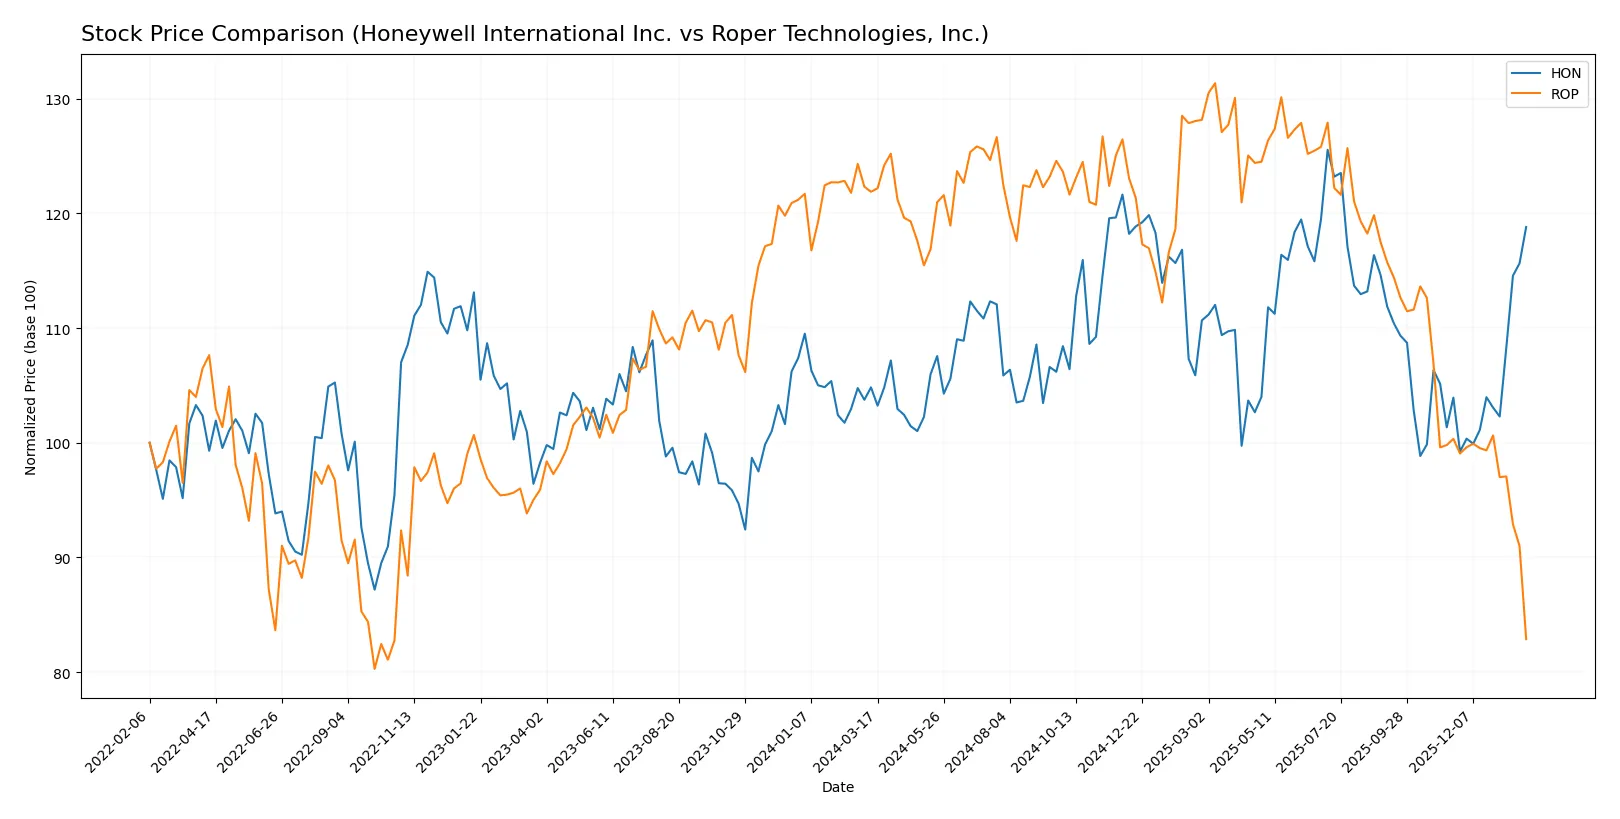
Trend Comparison
Honeywell’s stock rose 13.33% over the past year, showing a bullish trend with accelerating momentum and a price range between 189.29 and 240.4.
Roper’s stock declined 32.0% over the same period, marking a bearish trend with deceleration and a wider volatility range from 371.23 to 588.38.
Honeywell outperformed Roper significantly, delivering the highest market returns and demonstrating stronger upward price momentum.
Target Prices
Analysts present a clear consensus on target prices for Honeywell International Inc. and Roper Technologies, Inc.
| Company | Target Low | Target High | Consensus |
|---|---|---|---|
| Honeywell International Inc. | 195 | 268 | 242.08 |
| Roper Technologies, Inc. | 365 | 575 | 475.5 |
The consensus target for Honeywell exceeds its current price of 228, implying moderate upside. Roper’s target consensus significantly surpasses its 371 stock price, indicating strong analyst optimism.

Don’t Let Luck Decide Your Entry Point
Optimize your entry points with our advanced ProRealTime indicators. You’ll get efficient buy signals with precise price targets for maximum performance. Start outperforming now!
How do institutions grade them?
This section compares the latest institutional grades assigned to the two companies:
Honeywell International Inc. Grades
Below are recent grades from major financial institutions for Honeywell International Inc.
| Grading Company | Action | New Grade | Date |
|---|---|---|---|
| Citigroup | Maintain | Buy | 2026-01-30 |
| RBC Capital | Maintain | Outperform | 2026-01-30 |
| Barclays | Maintain | Overweight | 2026-01-30 |
| Wells Fargo | Maintain | Equal Weight | 2026-01-30 |
| JP Morgan | Maintain | Overweight | 2026-01-30 |
| JP Morgan | Upgrade | Overweight | 2026-01-16 |
| Citigroup | Maintain | Buy | 2026-01-12 |
| Wells Fargo | Maintain | Equal Weight | 2026-01-07 |
| Mizuho | Maintain | Outperform | 2026-01-05 |
| Barclays | Maintain | Overweight | 2025-12-24 |
Roper Technologies, Inc. Grades
Below are recent grades from major financial institutions for Roper Technologies, Inc.
| Grading Company | Action | New Grade | Date |
|---|---|---|---|
| Goldman Sachs | Maintain | Neutral | 2026-01-29 |
| Argus Research | Downgrade | Hold | 2026-01-28 |
| Truist Securities | Maintain | Buy | 2026-01-28 |
| Mizuho | Maintain | Underperform | 2026-01-28 |
| Oppenheimer | Downgrade | Perform | 2026-01-28 |
| RBC Capital | Maintain | Sector Perform | 2026-01-28 |
| Barclays | Maintain | Underweight | 2026-01-28 |
| Stifel | Downgrade | Hold | 2026-01-28 |
| Citigroup | Maintain | Buy | 2026-01-28 |
| JP Morgan | Maintain | Underweight | 2026-01-28 |
Which company has the best grades?
Honeywell International consistently earns higher grades like Buy, Outperform, and Overweight from top firms. Roper Technologies shows mixed ratings with several downgrades and neutral or underweight views. Investors may see Honeywell’s steadier institutional support as a positive signal.
Risks specific to each company
The following categories identify the critical pressure points and systemic threats facing both firms in the 2026 market environment:
1. Market & Competition
Honeywell International Inc.
- Operates in diversified industrial markets with strong aerospace and technology segments; faces intense competition and cyclical demand.
Roper Technologies, Inc.
- Focuses on industrial machinery and software with niche markets; competition from tech disruptors and cyclical industrial demand risks.
2. Capital Structure & Debt
Honeywell International Inc.
- High debt-to-equity ratio at 2.14 signals leverage risk despite good interest coverage (5.42x).
Roper Technologies, Inc.
- Shows no reported debt metrics, suggesting conservative leverage but data gaps raise transparency concerns.
3. Stock Volatility
Honeywell International Inc.
- Beta near 0.94 indicates moderate market correlation, consistent with industrial sector norms.
Roper Technologies, Inc.
- Identical beta of 0.94, but wider price range (345.93-595.17) implies higher price volatility.
4. Regulatory & Legal
Honeywell International Inc.
- Aerospace and tech segments expose to stringent safety and environmental regulations globally.
Roper Technologies, Inc.
- Software and industrial products face data privacy, compliance, and environmental regulation risks.
5. Supply Chain & Operations
Honeywell International Inc.
- Global manufacturing and aerospace operations vulnerable to supply chain disruptions and raw material cost inflation.
Roper Technologies, Inc.
- Heavy reliance on precision equipment and software supply chains; risks from component shortages and tech integration.
6. ESG & Climate Transition
Honeywell International Inc.
- Active in low global-warming-potential materials; faces pressure to meet evolving ESG standards.
Roper Technologies, Inc.
- ESG efforts less transparent; industrial focus may face increased scrutiny on emissions and sustainability.
7. Geopolitical Exposure
Honeywell International Inc.
- Global footprint exposes to trade tensions and geopolitical risks affecting aerospace and tech sales.
Roper Technologies, Inc.
- Concentrated US operations reduce exposure, but international clients and supply chains remain vulnerable.
Which company shows a better risk-adjusted profile?
Honeywell’s main risk is its elevated leverage amid a complex global supply chain. Roper’s top concern is opaque financial data and higher stock volatility. Despite leverage concerns, Honeywell’s diversified operations and strong cash flow promote a slightly better risk-adjusted profile. Recent ratio evaluations reveal Roper’s unfavorable net margins and zero returns on equity and invested capital, heightening risk. Honeywell’s solid interest coverage and moderate Altman Z-Score in the grey zone suggest more stability. Therefore, I favor Honeywell for a balanced risk-return tradeoff in 2026.
Final Verdict: Which stock to choose?
Honeywell International Inc. stands out with its superpower as a well-established cash machine, generating strong returns on equity and maintaining a favorable cost of capital. However, its declining profitability trend and elevated debt levels warrant vigilance. It suits portfolios aiming for steady income and moderate growth with some risk tolerance.
Roper Technologies, Inc. boasts a strategic moat through its high gross margins and robust income quality, reflecting operational excellence and recurring revenue safety. Compared to Honeywell, it offers a safer financial profile with stronger cash flow yields but faces challenges in capital efficiency metrics. It fits well in GARP portfolios seeking growth tempered by reasonable valuation.
If you prioritize consistent value creation and dividend income, Honeywell outshines due to its solid ROE and dividend yield despite some weakening trends. However, if you seek growth with operational strength and better cash flow quality, Roper offers better stability and margin expansion potential, albeit with a higher valuation premium. Each represents a distinct investor profile—balanced income versus growth-at-a-reasonable-price.
Disclaimer: Investment carries a risk of loss of initial capital. The past performance is not a reliable indicator of future results. Be sure to understand risks before making an investment decision.
Go Further
I encourage you to read the complete analyses of Honeywell International Inc. and Roper Technologies, Inc. to enhance your investment decisions: