Home > Comparison > Healthcare > HOLX vs COO
The strategic rivalry between Hologic, Inc. and The Cooper Companies, Inc. shapes the healthcare instruments and supplies sector’s evolution. Hologic operates as a diagnostics and surgical products specialist focusing on women’s health, while Cooper blends family health with a strong presence in vision care. This head-to-head highlights a contrast between diagnostic innovation and diversified medical solutions. This analysis aims to reveal which trajectory offers superior risk-adjusted returns for a balanced portfolio.
Table of contents
Companies Overview
Hologic and The Cooper Companies stand as pivotal players in the medical instruments and supplies sector.
Hologic, Inc.: Women’s Health Diagnostics Leader
Hologic dominates the women’s health diagnostics market through its innovative product suite. Its revenue arises from diagnostics assays, breast imaging, and surgical products, focusing on early detection and treatment. In 2026, the company emphasized expanding molecular diagnostics and minimally invasive surgical solutions to strengthen its competitive edge.
The Cooper Companies, Inc.: Vision and Women’s Health Innovator
The Cooper Companies excels in contact lenses and women’s health care devices. Its core revenue streams come from CooperVision contact lenses and CooperSurgical’s fertility and diagnostic products. Strategic efforts in 2026 targeted broadening fertility services and enhancing product portfolios across global markets to capture growing healthcare demands.
Strategic Collision: Similarities & Divergences
Both firms prioritize women’s health but diverge in approach—Hologic champions diagnostic precision, while Cooper spans vision and fertility. The main battleground lies in women’s healthcare innovation, with Hologic’s early detection challenging Cooper’s surgical and fertility devices. Their distinct investment profiles reflect Hologic’s diagnostic focus versus Cooper’s diversified medical solutions.
Income Statement Comparison
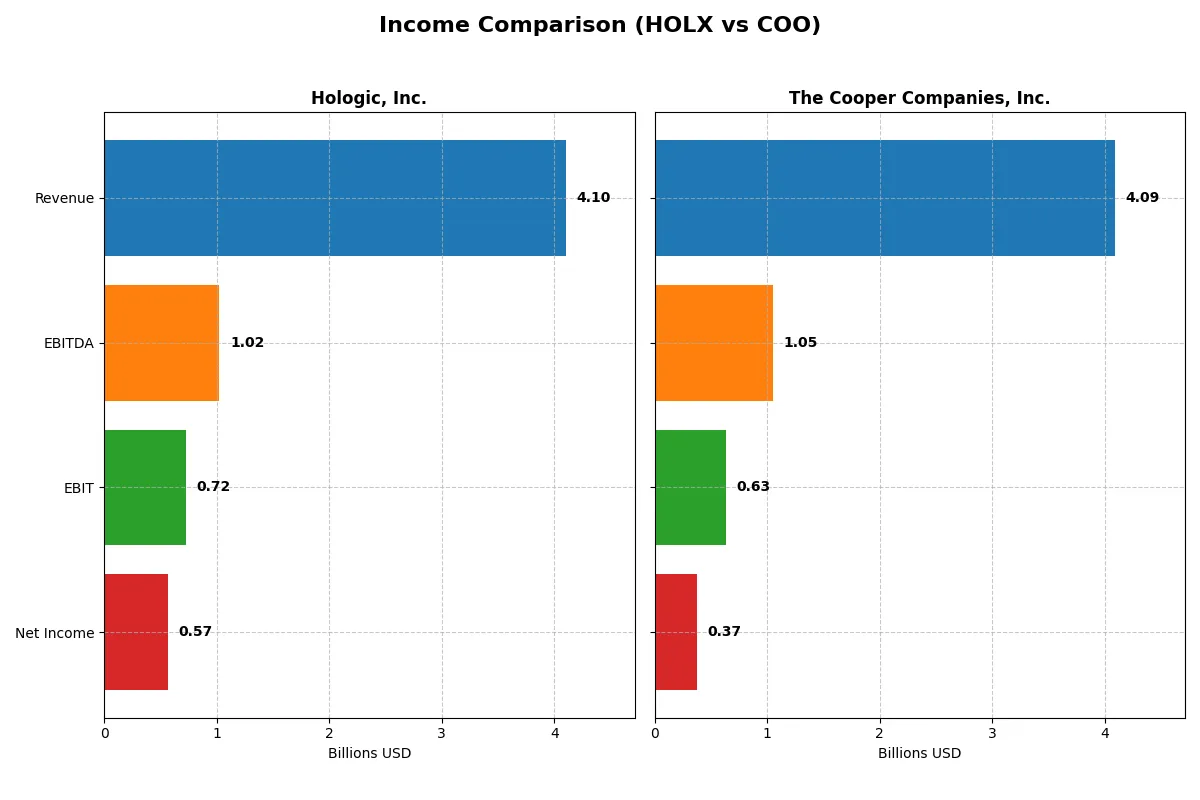
The following data dissects the core profitability and scalability of both corporate engines to reveal who dominates the bottom line:
| Metric | Hologic, Inc. (HOLX) | The Cooper Companies, Inc. (COO) |
|---|---|---|
| Revenue | 4.10B | 4.09B |
| Cost of Revenue | 1.60B | 1.61B |
| Operating Expenses | 1.79B | 1.80B |
| Gross Profit | 2.50B | 2.48B |
| EBITDA | 1.02B | 1.05B |
| EBIT | 724M | 630M |
| Interest Expense | 43M | 100M |
| Net Income | 566M | 375M |
| EPS | 2.50 | 1.87 |
| Fiscal Year | 2025 | 2025 |
Income Statement Analysis: The Bottom-Line Duel
This income statement comparison reveals how efficiently each company converts revenue into profit, highlighting operational strengths and weaknesses.
Hologic, Inc. Analysis
Hologic’s revenue declined from 5.63B in 2021 to 4.10B in 2025, with net income dropping sharply from 1.87B to 566M. Its gross margin remains healthy at 61%, but net margin compressed to 13.8%. The latest year shows weakened EBIT and EPS, signaling operational challenges despite stable gross profits.
The Cooper Companies, Inc. Analysis
Cooper Companies grew revenue steadily from 2.92B in 2021 to 4.09B in 2025, though net income plunged from 2.94B to 375M. Gross margin hovers near 61%, but net margin contracted to 9.16%. The latest year reflects modest revenue growth but declines in profitability and earnings per share, indicating margin pressure.
Margin Resilience vs. Revenue Growth
Hologic offers stronger margin resilience but faces steep declines in net income and EPS, while Cooper Companies shows consistent revenue growth but weaker profit conversion. Hologic’s higher EBIT and net margins mark it as the fundamental leader. Investors seeking margin stability may favor Hologic’s profile over Cooper’s top-line momentum.
Financial Ratios Comparison
These vital ratios act as a diagnostic tool to expose the underlying fiscal health, valuation premiums, and capital efficiency of the companies compared below:
| Ratios | Hologic, Inc. (HOLX) | The Cooper Companies, Inc. (COO) |
|---|---|---|
| ROE | 11.2% | 4.6% |
| ROIC | 7.3% | 4.0% |
| P/E | 27.0x | 37.3x |
| P/B | 3.0x | 1.7x |
| Current Ratio | 3.75 | 1.89 |
| Quick Ratio | 3.06 | 1.13 |
| D/E (Debt-to-Equity) | 0.52 | 0.34 |
| Debt-to-Assets | 29.1% | 22.5% |
| Interest Coverage | 16.7x | 6.8x |
| Asset Turnover | 0.45 | 0.33 |
| Fixed Asset Turnover | 6.27 | 1.97 |
| Payout Ratio | 0% | 0% |
| Dividend Yield | 0% | 0% |
| Fiscal Year | 2025 | 2025 |
Efficiency & Valuation Duel: The Vital Signs
Financial ratios act as a company’s DNA, uncovering hidden risks and operational strengths that shape investor outcomes.
Hologic, Inc.
Hologic posts a solid 11.2% ROE with a favorable 13.8% net margin, reflecting operational efficiency. Its P/E ratio of 27 signals a stretched valuation relative to earnings. Despite no dividend, Hologic reinvests through R&D, fueling growth. A high current ratio of 3.75 flags possible inefficiency in asset management.
The Cooper Companies, Inc.
Cooper shows weaker profitability with a 4.6% ROE and a 9.2% net margin. Its P/E of 37.3 suggests an expensive stock, demanding strong future growth. The company also pays no dividend, focusing on reinvestment. Cooper’s current ratio is more conservative at 1.89, indicating tighter liquidity control.
Premium Valuation vs. Operational Safety
Hologic balances moderate returns and operational efficiency despite a stretched valuation, while Cooper trades at a higher premium with weaker profitability. Hologic offers a better risk-reward balance. Investors seeking operational resilience may prefer Hologic’s profile over Cooper’s growth-dependent valuation.
Which one offers the Superior Shareholder Reward?
I observe that neither Hologic, Inc. (HOLX) nor The Cooper Companies, Inc. (COO) pays meaningful dividends in 2026, focusing instead on reinvestment and buybacks. HOLX shows zero dividend payout and yield, with a robust free cash flow per share of about 4.05 and a strong buyback capacity supported by a high current ratio (~3.75). COO also pays negligible dividends (~0.02% yield) but exhibits weaker free cash flow per share (~2.17) and a lower cash ratio (~0.10). Both companies deploy capital prudently, but HOLX’s larger free cash flow and stronger liquidity support more aggressive buybacks, enhancing total shareholder return sustainably. I conclude HOLX offers the superior shareholder reward in 2026 due to its balance of cash generation and capital allocation.
Comparative Score Analysis: The Strategic Profile
The radar chart reveals the fundamental DNA and trade-offs of Hologic, Inc. and The Cooper Companies, Inc., highlighting their strategic strengths and weaknesses:
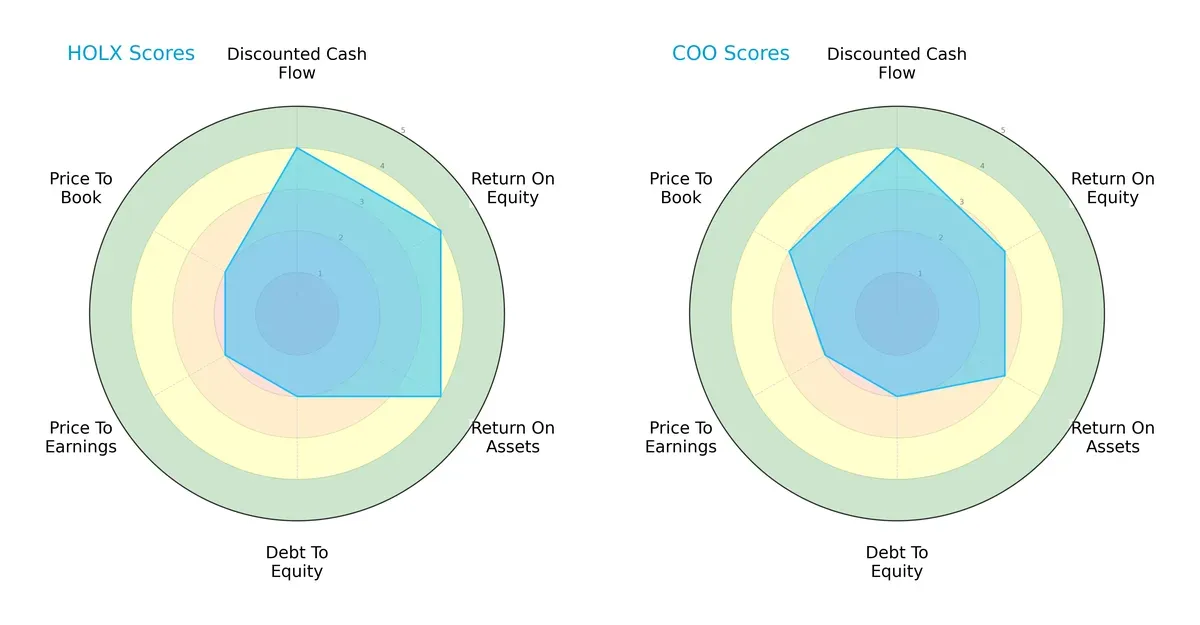
Hologic scores higher on ROE and ROA (4 vs. 3), indicating superior profitability and asset efficiency. Both share strong DCF scores (4), reflecting healthy future cash flow expectations. Debt-to-equity scores are equal (2), signaling moderate leverage risk. Valuation metrics slightly favor Cooper with a better price-to-book score (3 vs. 2), suggesting a marginally more attractive market price relative to book value. Overall, Hologic presents a more balanced profitability profile, while Cooper leans on valuation appeal.
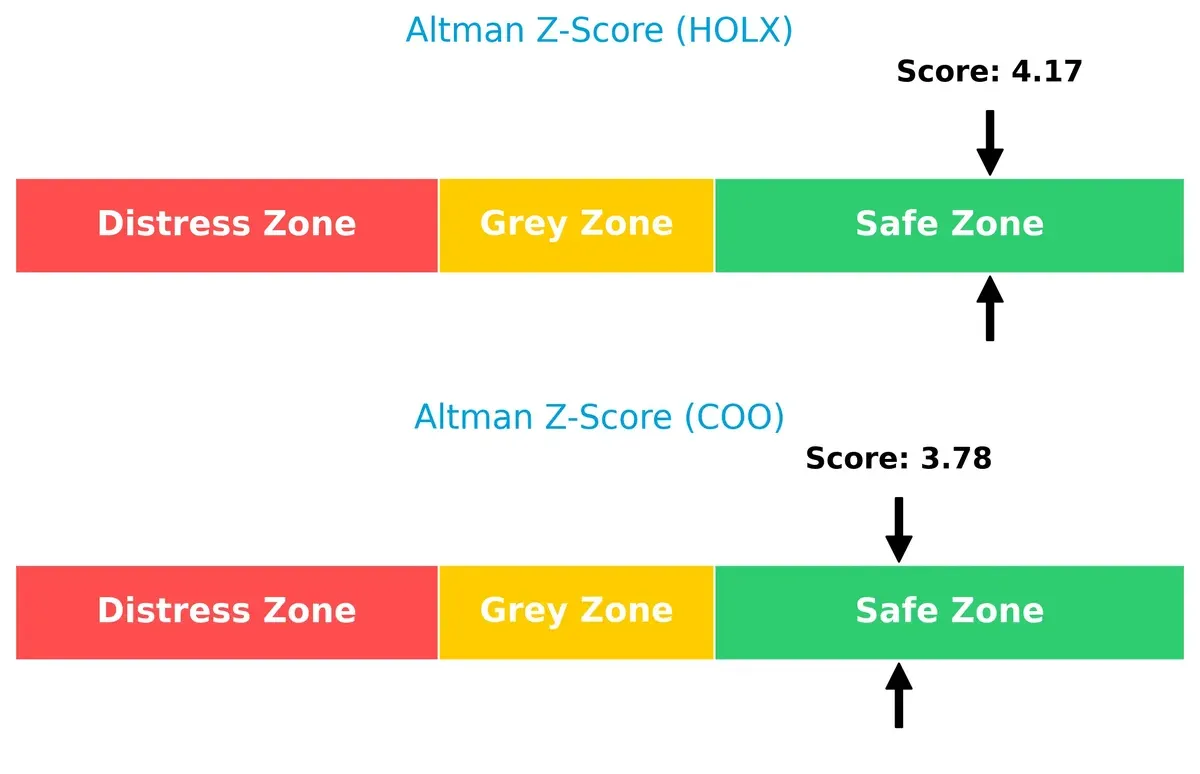
Bankruptcy Risk: Solvency Showdown
Hologic’s Altman Z-Score of 4.17 versus Cooper’s 3.78 puts both in the safe zone, indicating solid solvency and low bankruptcy risk in this economic cycle:
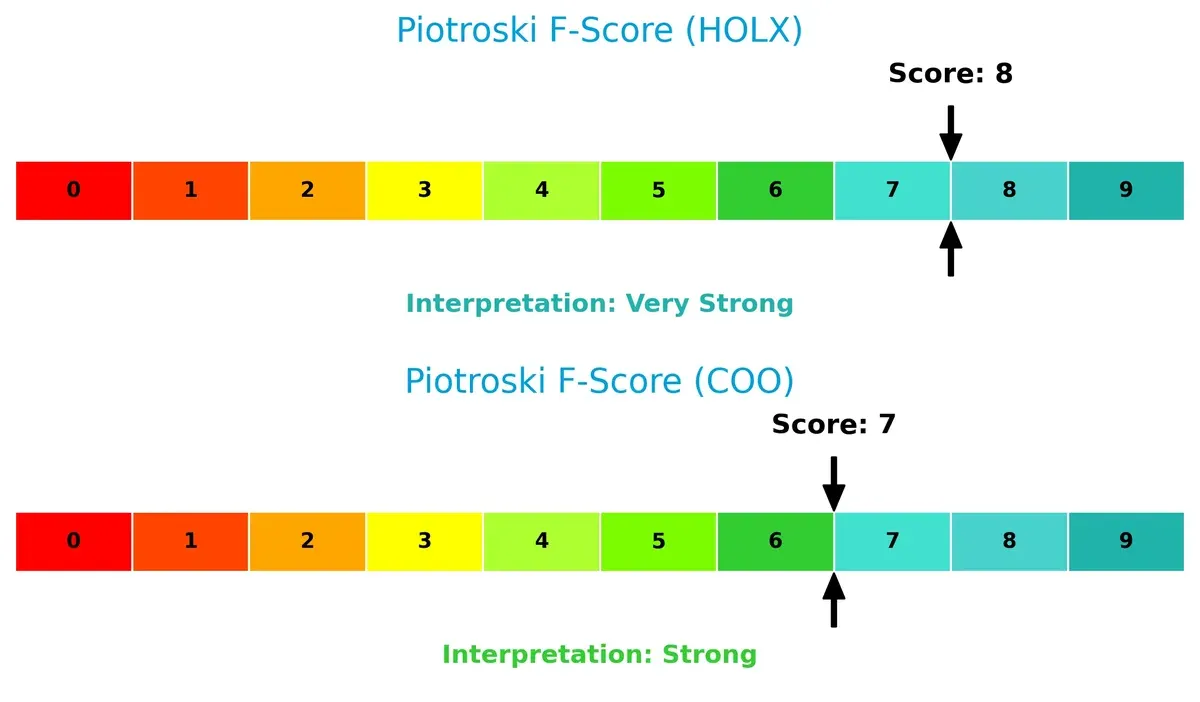
Financial Health: Quality of Operations
Hologic’s Piotroski F-Score of 8 outperforms Cooper’s 7, signaling stronger internal financial health and operational quality. Cooper’s slightly lower score suggests minor red flags in efficiency or liquidity metrics:
How are the two companies positioned?
This section dissects the operational DNA of HOLX and COO by comparing their revenue distribution by segment and internal dynamics. The goal is to confront their economic moats to identify which model offers the most resilient, sustainable competitive advantage today.
Revenue Segmentation: The Strategic Mix
This visual comparison dissects how Hologic, Inc. and The Cooper Companies, Inc. diversify their income streams and where their primary sector bets lie:
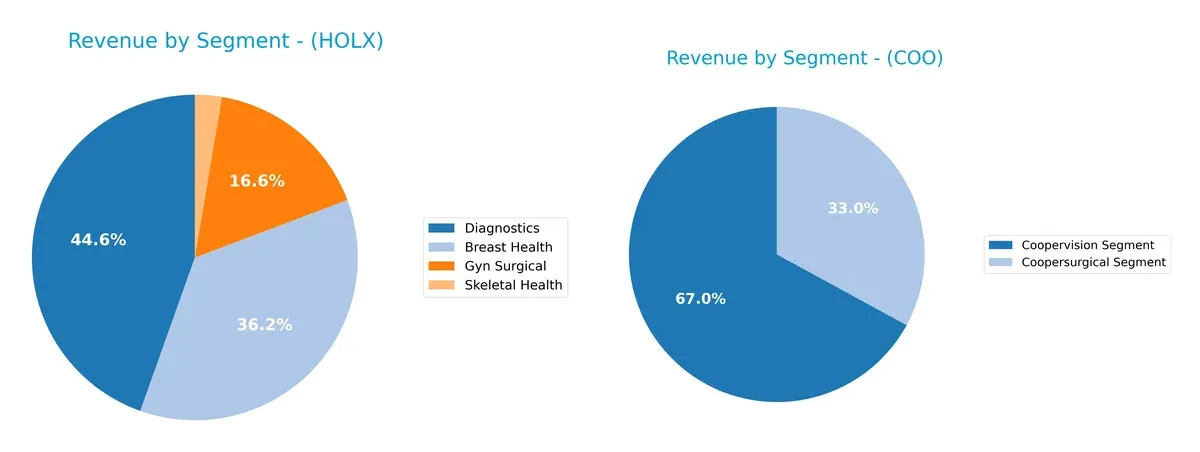
Hologic’s 2025 revenue splits across Breast Health ($1.48B), Diagnostics ($1.83B), Gyn Surgical ($680M), and Skeletal Health ($109M), showing a balanced portfolio. Cooper Companies leans heavily on Coopervision ($2.74B) over Coopersurgical ($1.35B), revealing concentration risk. Hologic’s diversified mix anchors stability, while Cooper’s dominance in vision care pivots on maintaining ecosystem lock-in within its core segment.
Strengths and Weaknesses Comparison
This table compares the strengths and weaknesses of Hologic, Inc. and The Cooper Companies, Inc.:
Hologic Strengths
- Diverse medical segments including Breast Health and Diagnostics
- Favorable net margin at 13.8%
- Strong quick ratio of 3.06
- Favorable debt-to-assets at 29.14%
- High interest coverage of 16.95
- Robust fixed asset turnover at 6.27
Cooper Strengths
- Solid segment focus on Coopervision and Coopersurgical
- Favorable current and quick ratios (1.89 and 1.13)
- Low debt-to-equity ratio of 0.34
- Favorable debt-to-assets at 22.46%
- Interest coverage at 6.3
- Presence in US, Europe, and Rest of World markets
Hologic Weaknesses
- Unfavorable P/E of 26.99 and P/B of 3.02 suggest expensive valuation
- Unfavorable current ratio of 3.75 despite quick ratio strength
- Neutral ROIC at 7.35% barely above WACC of 6.54%
- Unfavorable asset turnover at 0.45
- Zero dividend yield
Cooper Weaknesses
- Lower profitability with neutral net margin at 9.16% and unfavorable ROE of 4.55%
- ROIC of 3.98% below WACC of 7.81%
- Unfavorable P/E of 37.3
- Neutral P/B of 1.7
- Asset turnover weak at 0.33
- Zero dividend yield
Hologic shows strong profitability metrics and liquidity but faces valuation and asset utilization challenges. Cooper exhibits financial strength in leverage and liquidity but struggles with lower returns and valuation pressures. These contrasts highlight different strategic focuses in capital efficiency and market valuation management.
The Moat Duel: Analyzing Competitive Defensibility
A structural moat protects long-term profits from relentless competitive erosion. Without it, sustainable value evaporates quickly:
Hologic, Inc.: Intangible Assets Shielding Women’s Health Innovation
Hologic’s moat stems from proprietary diagnostics and surgical technologies, reflected in stable 61% gross margins. Yet, declining ROIC signals eroding advantage by 2026 amidst intensifying competition.
The Cooper Companies, Inc.: Diversified Product Ecosystem in Vision and Women’s Care
Cooper’s moat relies on a broad portfolio spanning contact lenses and surgical devices, supporting a 60.7% gross margin. However, a sharper ROIC decline than Hologic’s warns of weakening capital efficiency.
Verdict: Proprietary Innovation vs. Portfolio Breadth in Healthcare Devices
Hologic’s intangible asset moat remains somewhat deeper despite a 70% ROIC drop. Cooper’s broader ecosystem faces steeper value destruction. I see Hologic better positioned to defend market share into 2026.
Which stock offers better returns?
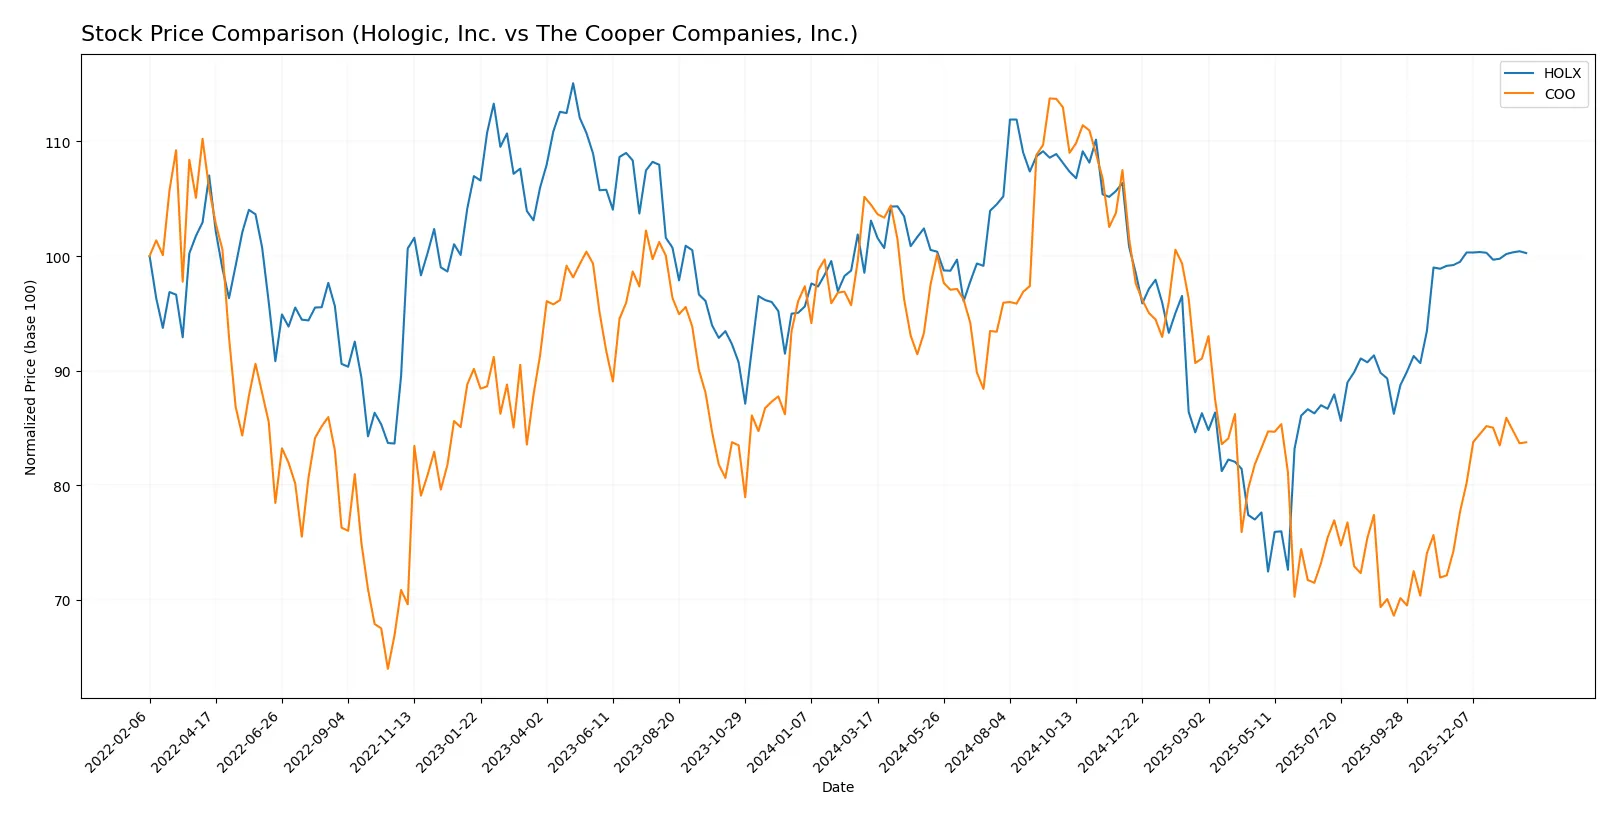
Over the past year, both Hologic, Inc. and The Cooper Companies, Inc. experienced bearish trends with accelerating declines, yet recent months reveal emerging positive momentum in their stock prices.
Trend Comparison
Hologic, Inc. shows an overall bearish trend with a price drop of 2.75% over the past 12 months, exhibiting acceleration and a high volatility level with a 7.2 standard deviation. The stock hit a high of 83.64 and a low of 54.16, but recent weeks indicate a slight bullish reversal with a 1.05% gain.
The Cooper Companies, Inc. recorded a sharper bearish trend, falling 19.83% over the past year with accelerating decline and higher volatility, reflected in a 12.34 standard deviation. It ranged between 110.53 and 66.68, yet recently surged 12.82%, signaling a strong short-term recovery.
Comparing these trends, The Cooper Companies, Inc. delivered the highest recent market performance with a notable rebound, despite a steeper yearly loss than Hologic, Inc.
Target Prices
Analysts present a confident target price consensus for both Hologic, Inc. and The Cooper Companies, Inc.
| Company | Target Low | Target High | Consensus |
|---|---|---|---|
| Hologic, Inc. | 76 | 79 | 77.8 |
| The Cooper Companies, Inc. | 73 | 100 | 91.75 |
The consensus target for Hologic sits slightly above its current price of $74.93, suggesting modest upside. The Cooper Companies shows a more optimistic outlook, with targets well above the current $81.38 price, reflecting stronger growth expectations.

Don’t Let Luck Decide Your Entry Point
Optimize your entry points with our advanced ProRealTime indicators. You’ll get efficient buy signals with precise price targets for maximum performance. Start outperforming now!
How do institutions grade them?
The following tables summarize institutional grades for Hologic, Inc. and The Cooper Companies, Inc.:
Hologic, Inc. Grades
This table lists recent grade changes and actions by recognized grading firms for Hologic, Inc.
| Grading Company | Action | New Grade | Date |
|---|---|---|---|
| Argus Research | Downgrade | Hold | 2026-01-12 |
| Evercore ISI Group | Downgrade | In Line | 2026-01-05 |
| Morgan Stanley | Maintain | Equal Weight | 2025-11-11 |
| Mizuho | Downgrade | Neutral | 2025-10-23 |
| JP Morgan | Downgrade | Neutral | 2025-10-22 |
| Stephens & Co. | Downgrade | Equal Weight | 2025-10-22 |
| Raymond James | Downgrade | Market Perform | 2025-10-22 |
| Leerink Partners | Maintain | Market Perform | 2025-10-21 |
| Needham | Maintain | Hold | 2025-10-21 |
| BTIG | Maintain | Neutral | 2025-10-21 |
The Cooper Companies, Inc. Grades
This table lists recent grade maintenance actions by reputable institutions for The Cooper Companies, Inc.
| Grading Company | Action | New Grade | Date |
|---|---|---|---|
| Barclays | Maintain | Overweight | 2026-01-26 |
| Citigroup | Maintain | Neutral | 2025-12-08 |
| Goldman Sachs | Maintain | Sell | 2025-12-08 |
| Morgan Stanley | Maintain | Equal Weight | 2025-12-08 |
| Mizuho | Maintain | Outperform | 2025-12-05 |
| Stifel | Maintain | Buy | 2025-12-05 |
| Baird | Maintain | Outperform | 2025-12-05 |
| Needham | Maintain | Buy | 2025-12-05 |
| JP Morgan | Maintain | Neutral | 2025-12-05 |
| Wells Fargo | Maintain | Equal Weight | 2025-12-05 |
Which company has the best grades?
The Cooper Companies, Inc. holds stronger grades overall, with multiple “Buy” and “Outperform” ratings maintained. In contrast, Hologic, Inc. experienced several downgrades, shifting toward “Hold” and “Neutral.” Investors may interpret this as a signal of greater institutional confidence in The Cooper Companies.
Risks specific to each company
The following categories identify critical pressure points and systemic threats facing both firms in the 2026 market environment:
1. Market & Competition
Hologic, Inc.
- Strong position in women’s health diagnostics but faces pressure from innovation and pricing in saturated markets.
The Cooper Companies, Inc.
- Diverse portfolio with CooperVision and CooperSurgical segments, but intense competition in contact lenses and fertility devices.
2. Capital Structure & Debt
Hologic, Inc.
- Moderate leverage with debt-to-assets at 29%, interest coverage robust at 17x, indicating manageable debt risk.
The Cooper Companies, Inc.
- Lower leverage at 22%, but interest coverage weaker at 6.3x, signaling higher sensitivity to interest rate fluctuations.
3. Stock Volatility
Hologic, Inc.
- Beta of 0.7 suggests lower volatility than the market, appealing for risk-averse investors.
The Cooper Companies, Inc.
- Beta above 1.0 indicates greater volatility and higher market sensitivity, increasing investment risk.
4. Regulatory & Legal
Hologic, Inc.
- Operates globally with exposure to diverse healthcare regulations; risk from evolving diagnostic product approvals.
The Cooper Companies, Inc.
- Faces regulatory scrutiny across multiple healthcare domains including fertility and surgical devices, increasing compliance costs.
5. Supply Chain & Operations
Hologic, Inc.
- Complex manufacturing and distribution channels in diagnostics and surgical products may face supply disruptions.
The Cooper Companies, Inc.
- Broad global supply chain for contact lenses and surgical instruments is vulnerable to geopolitical and logistical risks.
6. ESG & Climate Transition
Hologic, Inc.
- Increasing pressure to improve sustainability in manufacturing and product lifecycle; ESG initiatives still evolving.
The Cooper Companies, Inc.
- Stronger ESG integration due to consumer-facing products; faces challenges in sourcing materials sustainably and reducing carbon footprint.
7. Geopolitical Exposure
Hologic, Inc.
- Significant international sales expose firm to trade tensions and regulatory shifts, especially in Asia-Pacific markets.
The Cooper Companies, Inc.
- Diverse geographic revenue mitigates risk but also increases exposure to geopolitical instability in key regions.
Which company shows a better risk-adjusted profile?
Hologic’s most impactful risk is regulatory complexity amid innovation demands, while Cooper faces higher financial leverage and market volatility. Hologic’s lower beta and superior interest coverage offer a more stable risk-adjusted profile. The recent strong Altman Z-score (4.17 vs. 3.78) and higher Piotroski score (8 vs. 7) confirm Hologic’s safer financial footing despite competitive pressures.
Final Verdict: Which stock to choose?
Hologic, Inc. (HOLX) stands out for its robust operational efficiency and strong cash flow generation. Its superpower lies in maintaining quality earnings and solid liquidity, making it a reliable cash machine. A point of vigilance is its declining profitability trend, which could challenge growth momentum. HOLX suits investors targeting aggressive growth with an appetite for moderate risk.
The Cooper Companies, Inc. (COO) offers a strategic moat through its recurring revenue streams and disciplined capital structure. It presents a safer profile relative to HOLX, supported by steady liquidity and moderate leverage. However, its value destruction and weaker returns signal caution. COO fits investors focused on GARP—growth at a reasonable price—with a preference for stability over rapid expansion.
If you prioritize operational excellence and cash generation, HOLX is the compelling choice due to its superior earnings quality and liquidity buffer. However, if you seek a more conservative profile with recurring revenue safety, COO offers better stability despite its weaker profitability. Both carry risks of declining returns, so aligning with your risk tolerance is essential.
Disclaimer: Investment carries a risk of loss of initial capital. The past performance is not a reliable indicator of future results. Be sure to understand risks before making an investment decision.
Go Further
I encourage you to read the complete analyses of Hologic, Inc. and The Cooper Companies, Inc. to enhance your investment decisions: