Home > Comparison > Healthcare > RMD vs HOLX
The strategic rivalry between ResMed Inc. and Hologic, Inc. shapes the trajectory of the healthcare instruments sector. ResMed operates as a technology-driven provider of respiratory care and cloud software solutions. Hologic focuses on diagnostics and surgical products specializing in women’s health. This analysis compares their operational models and growth prospects to identify which presents a superior risk-adjusted opportunity for a diversified portfolio seeking exposure in medical instruments.
Table of contents
Companies Overview
ResMed and Hologic both hold influential roles within the medical instruments and supplies sector, shaping healthcare delivery worldwide.
ResMed Inc.: Leader in Respiratory Care and Digital Health
ResMed specializes in sleep and respiratory care devices combined with cloud-based software. Its primary revenue stems from ventilators, mask systems, and patient monitoring solutions. In 2026, ResMed sharpened its focus on integrating remote monitoring technologies and expanding its Software as a Service platform to improve patient compliance and clinical outcomes globally.
Hologic, Inc.: Pioneer in Women’s Health Diagnostics and Surgical Products
Hologic drives revenue through diagnostic assays, breast imaging, and surgical systems targeting women’s health. Its diverse product lineup supports early disease detection and treatment. The company’s 2026 strategy centers on enhancing molecular diagnostics and expanding minimally invasive surgical solutions, emphasizing innovation across its Diagnostics, Breast Health, GYN Surgical, and Skeletal Health divisions.
Strategic Collision: Similarities & Divergences
Both companies emphasize specialized medical devices but diverge in their market philosophies—ResMed leans on integrated digital health ecosystems, while Hologic focuses on discrete diagnostic and surgical innovations. Their primary battleground lies in clinical adoption and technology integration within healthcare providers. ResMed offers a growth profile tied to SaaS scalability; Hologic appeals through diversified product innovation in women’s health diagnostics.
Income Statement Comparison
The following data dissects the core profitability and scalability of both corporate engines to reveal who dominates the bottom line:

| Metric | ResMed Inc. (RMD) | Hologic, Inc. (HOLX) |
|---|---|---|
| Revenue | 5.15B | 4.10B |
| Cost of Revenue | 2.09B | 1.60B |
| Operating Expenses | 1.37B | 1.79B |
| Gross Profit | 3.05B | 2.50B |
| EBITDA | 1.91B | 1.02B |
| EBIT | 1.68B | 724M |
| Interest Expense | 13M | 43M |
| Net Income | 1.40B | 566M |
| EPS | 9.55 | 2.50 |
| Fiscal Year | 2025 | 2025 |
Income Statement Analysis: The Bottom-Line Duel
This income statement comparison reveals which company runs a more efficient and profitable corporate engine in 2025.
ResMed Inc. Analysis
ResMed’s revenue climbs steadily to 5.15B in 2025, with net income surging to 1.40B. Its gross margin holds strong at 59.4%, and net margin impresses at 27.2%. The company accelerates EBIT growth by 28% year-over-year, demonstrating robust operational momentum and disciplined cost control.
Hologic, Inc. Analysis
Hologic’s revenue edges up slightly to 4.10B in 2025, but net income falls to 566M, reflecting margin pressure. Gross margin remains healthy at 61%, yet net margin compresses to 13.8%. EBIT declines sharply by 27%, signaling weakening profitability and operational challenges in the latest year.
Verdict: Robust Margin Expansion vs. Margin Compression Under Revenue Pressure
ResMed emerges as the clear fundamental winner with superior margin expansion and strong net income growth. Hologic struggles with declining profitability despite stable revenue. ResMed’s profile suits investors seeking consistent margin improvement and earnings resilience.
Financial Ratios Comparison
These vital ratios act as a diagnostic tool to expose the underlying fiscal health, valuation premiums, and capital efficiency of the companies compared below:
| Ratios | ResMed Inc. (RMD) | Hologic, Inc. (HOLX) |
|---|---|---|
| ROE | 23.47% | 11.21% |
| ROIC | 19.56% | 7.35% |
| P/E | 27.02 | 26.99 |
| P/B | 6.34 | 3.02 |
| Current Ratio | 3.44 | 3.75 |
| Quick Ratio | 2.53 | 3.06 |
| D/E (Debt-to-Equity) | 0.14 | 0.52 |
| Debt-to-Assets | 10.42% | 29.14% |
| Interest Coverage | 133.66 | 16.73 |
| Asset Turnover | 0.63 | 0.45 |
| Fixed Asset Turnover | 7.16 | 6.27 |
| Payout Ratio | 22.19% | 0% |
| Dividend Yield | 0.82% | 0% |
| Fiscal Year | 2025 | 2025 |
Efficiency & Valuation Duel: The Vital Signs
Financial ratios act as a company’s DNA, unveiling hidden risks and operational strengths crucial for informed investing decisions.
ResMed Inc.
ResMed exhibits robust profitability with a 23.47% ROE and a strong 27.22% net margin. Its valuation appears stretched, with a P/E of 27.02 above favorable norms. The firm returns modest dividends at 0.82%, balancing shareholder rewards with reinvestment into R&D, signaling a growth-focused capital allocation.
Hologic, Inc.
Hologic shows moderate profitability, with an 11.21% ROE and a 13.8% net margin. The stock trades at a similar P/E near 27, suggesting an expensive valuation. Hologic pays no dividends, instead channeling resources into growth and innovation, reflected in its solid quick ratio and manageable debt profile.
Operational Strength vs. Valuation Pressure
ResMed delivers superior returns on equity and capital but trades at a premium with elevated valuation multiples. Hologic offers a slightly favorable balance with lower profitability but less stretched asset turnover. Investors prioritizing operational excellence may prefer ResMed, while those seeking growth with moderate risk might lean toward Hologic.
Which one offers the Superior Shareholder Reward?
I compare ResMed Inc. (RMD) and Hologic, Inc. (HOLX) on dividends, buybacks, and sustainability. RMD yields 0.82–1.03%, with a payout ratio around 22–28%, comfortably covered by free cash flow (FCF/OCF ratio ~0.92–0.95). It pairs dividends with moderate buybacks, supporting steady shareholder returns. HOLX pays no dividends but reinvests heavily in growth and acquisitions, showing robust free cash flow (FCF/OCF ~0.85–0.94) and stronger buyback activity relative to earnings, reflecting aggressive capital allocation. Historically in healthcare tech, dividends provide stability, but HOLX’s reinvestment strategy targets higher long-term value. Given RMD’s balanced yield and buybacks versus HOLX’s growth focus without dividends, I find RMD offers a more attractive total return profile in 2026 for income-focused investors, while HOLX suits growth seekers willing to tolerate higher volatility.
Comparative Score Analysis: The Strategic Profile
The radar chart reveals the fundamental DNA and trade-offs of ResMed Inc. and Hologic, Inc., highlighting their core financial strengths and vulnerabilities:

ResMed demonstrates superior profitability with higher ROE (5 vs. 4) and ROA (5 vs. 4) scores, signaling efficient asset and equity utilization. Both firms match on DCF (4) and valuation metrics (PE and PB at 2), indicating similar market pricing. However, ResMed’s moderate debt-to-equity score (3 vs. 2) suggests a slightly higher leverage risk. Overall, ResMed presents a more balanced profile with operational excellence, while Hologic leans on a conservative capital structure.
Bankruptcy Risk: Solvency Showdown
ResMed’s Altman Z-Score of 12.9 significantly exceeds Hologic’s 4.2, underscoring its robust solvency and minimal bankruptcy risk in this market cycle:

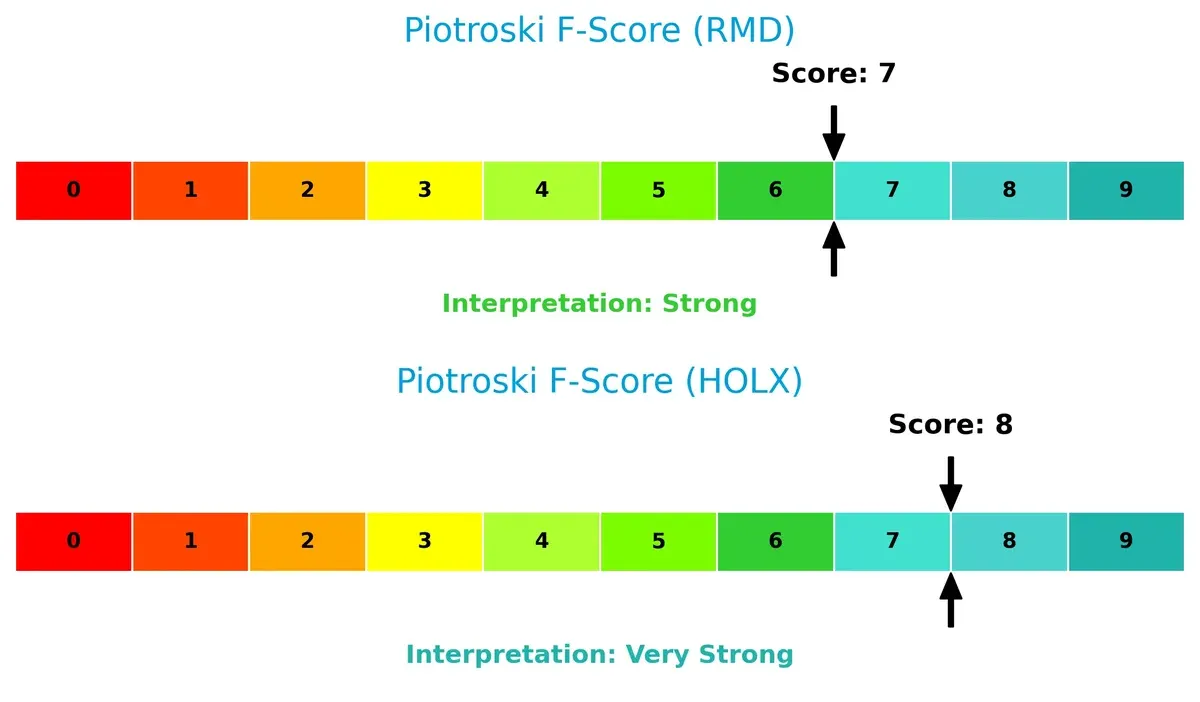
Financial Health: Quality of Operations
Hologic’s Piotroski F-Score of 8 edges out ResMed’s 7, indicating marginally stronger financial health and operational efficiency. Neither company shows red flags, but Hologic’s metrics suggest tighter internal controls:
How are the two companies positioned?
This section dissects the operational DNA of ResMed and Hologic by comparing their revenue distribution and internal dynamics. The goal is to confront their economic moats to reveal which model delivers the most resilient competitive advantage today.
Revenue Segmentation: The Strategic Mix
This comparison dissects how ResMed Inc. and Hologic, Inc. diversify income streams and reveals their primary sector bets:

ResMed anchors revenue in Sleep and Respiratory at $4.1B (2024), with Software as Service trailing at $584M, showing a moderate diversification. Hologic displays a broader spread: Diagnostics leads with $1.8B, Breast Health contributes $1.5B, and Gyn Surgical adds $680M (2025). ResMed’s reliance on a dominant segment risks concentration but strengthens its ecosystem lock-in. Hologic’s diverse base reduces risk and supports infrastructure dominance across medical fields.
Strengths and Weaknesses Comparison
This table compares the Strengths and Weaknesses of ResMed Inc. and Hologic, Inc.:
ResMed Inc. Strengths
- High net margin at 27.22%
- Strong ROE of 23.47%
- Robust ROIC at 19.56%
- Low debt-to-equity at 0.14
- High interest coverage ratio at 133.05
- Diversified revenue from Sleep and Respiratory plus SaaS segments
Hologic, Inc. Strengths
- Favorable net margin at 13.8%
- Moderate WACC at 6.54%
- Solid interest coverage at 16.95
- Diverse product lines including Breast Health, Diagnostics, and Gyn Surgical
- Global presence across US, Europe, Asia-Pacific
- Stable fixed asset turnover at 6.27
ResMed Inc. Weaknesses
- Unfavorable PE ratio at 27.02
- High price-to-book ratio at 6.34
- Elevated current ratio at 3.44 indicating possible inefficiency
- Low dividend yield at 0.82%
- Neutral asset turnover at 0.63
Hologic, Inc. Weaknesses
- PE ratio unfavorable at 26.99
- Price-to-book ratio moderate at 3.02
- High current ratio at 3.75 may signal asset inefficiency
- Debt-to-equity at 0.52 is moderate
- Lower asset turnover at 0.45
- Zero dividend yield
ResMed’s strengths lie in profitability and low leverage, but high valuation ratios and liquidity metrics suggest caution. Hologic shows diversified revenue and global reach but weaker profitability and lower asset efficiency that may challenge growth. Both companies face valuation and liquidity concerns impacting capital allocation strategy.
The Moat Duel: Analyzing Competitive Defensibility
A structural moat is the only true shield protecting long-term profits from relentless competitive pressure and market erosion:
ResMed Inc.: Software-Driven Switching Costs
ResMed’s moat roots in high switching costs powered by its integrated cloud-based software and medical devices. This synergy drives stable 27% net margins and robust 55% ROIC growth. New SaaS offerings in respiratory care deepen this advantage in 2026.
Hologic, Inc.: Broad Product Portfolio with Cost Advantage
Hologic relies on a diverse product lineup in women’s health, but faces shrinking margins and a declining ROIC trend unlike ResMed’s growth. Its narrower moat limits pricing power, though expansion in diagnostics offers some upside.
Verdict: Software Lock-In vs. Product Breadth
ResMed’s durable software ecosystem creates a wider, more defensible moat compared to Hologic’s product-focused, cost-sensitive positioning. ResMed is better equipped to defend and grow market share in 2026 and beyond.
Which stock offers better returns?
The past year saw ResMed Inc. rally 37.1%, showing a strong but decelerating uptrend, while Hologic, Inc. declined 2.8%, reflecting a bearish trend with accelerating losses.

Trend Comparison
ResMed Inc. posted a bullish 37.1% price gain over the past year with a decelerating trend and a volatility of 24.9%. The stock peaked at 293.73 and troughed at 178.85.
Hologic, Inc. experienced a 2.8% price decline over the same period, confirming a bearish trend. Its volatility was lower at 7.2%, with accelerating downward momentum.
ResMed’s strong positive trend outpaced Hologic’s modest decline, delivering the highest market performance over the analyzed 12-month span.
Target Prices
Analysts show a moderate upside consensus for ResMed Inc. and Hologic, Inc.
| Company | Target Low | Target High | Consensus |
|---|---|---|---|
| ResMed Inc. | 265 | 345 | 295.88 |
| Hologic, Inc. | 76 | 79 | 77.8 |
ResMed’s consensus target price sits roughly 14% above its current 258 price, indicating potential growth. Hologic’s target consensus is about 4% higher than its 74.93 market price, reflecting modest upside expectations.

Don’t Let Luck Decide Your Entry Point
Optimize your entry points with our advanced ProRealTime indicators. You’ll get efficient buy signals with precise price targets for maximum performance. Start outperforming now!
How do institutions grade them?
ResMed Inc. Grades
The following table summarizes recent institutional grades for ResMed Inc. from recognized firms.
| Grading Company | Action | New Grade | Date |
|---|---|---|---|
| Wells Fargo | Maintain | Equal Weight | 2026-01-30 |
| RBC Capital | Maintain | Outperform | 2026-01-30 |
| Stifel | Maintain | Hold | 2026-01-30 |
| Piper Sandler | Maintain | Neutral | 2026-01-30 |
| Stifel | Maintain | Hold | 2025-12-18 |
| Baird | Downgrade | Neutral | 2025-12-16 |
| Baird | Maintain | Outperform | 2025-11-03 |
| RBC Capital | Maintain | Outperform | 2025-10-31 |
| Keybanc | Maintain | Overweight | 2025-10-31 |
| Mizuho | Maintain | Outperform | 2025-10-31 |
Hologic, Inc. Grades
This table shows recent institutional grades for Hologic, Inc. from verified grading companies.
| Grading Company | Action | New Grade | Date |
|---|---|---|---|
| Argus Research | Downgrade | Hold | 2026-01-12 |
| Evercore ISI Group | Downgrade | In Line | 2026-01-05 |
| Morgan Stanley | Maintain | Equal Weight | 2025-11-11 |
| Mizuho | Downgrade | Neutral | 2025-10-23 |
| JP Morgan | Downgrade | Neutral | 2025-10-22 |
| Stephens & Co. | Downgrade | Equal Weight | 2025-10-22 |
| Raymond James | Downgrade | Market Perform | 2025-10-22 |
| Leerink Partners | Maintain | Market Perform | 2025-10-21 |
| Needham | Maintain | Hold | 2025-10-21 |
| BTIG | Maintain | Neutral | 2025-10-21 |
Which company has the best grades?
ResMed Inc. holds stronger grades overall, including multiple Outperform and Overweight ratings. Hologic, Inc. has seen mostly downgrades to Neutral or Hold. ResMed’s higher grades suggest more favorable institutional sentiment, potentially impacting investor confidence positively.
Risks specific to each company
The following categories identify the critical pressure points and systemic threats facing both firms in the 2026 market environment:
1. Market & Competition
ResMed Inc.
- Faces intense competition in respiratory care and SaaS, requiring constant innovation to maintain its leading market share.
Hologic, Inc.
- Competes heavily in women’s health diagnostics and imaging, with pressure from emerging technologies and new entrants.
2. Capital Structure & Debt
ResMed Inc.
- Maintains a strong balance sheet with low debt-to-equity (0.14), showing prudent capital allocation and financial flexibility.
Hologic, Inc.
- Has higher leverage (debt-to-equity 0.52), which increases financial risk despite manageable interest coverage.
3. Stock Volatility
ResMed Inc.
- Beta of 0.876 suggests moderate volatility, roughly in line with healthcare sector norms.
Hologic, Inc.
- Lower beta at 0.697 indicates less sensitivity to market swings, appealing for risk-averse investors.
4. Regulatory & Legal
ResMed Inc.
- Subject to stringent medical device regulations globally, with potential compliance cost increases.
Hologic, Inc.
- Faces regulatory scrutiny in diagnostics and imaging, especially in evolving women’s health policies.
5. Supply Chain & Operations
ResMed Inc.
- Complex global supply chain for devices and software, vulnerable to component shortages and technology disruptions.
Hologic, Inc.
- Relies on supply chains for diagnostic reagents and imaging hardware, exposed to geopolitical and logistic risks.
6. ESG & Climate Transition
ResMed Inc.
- Increasing pressure to improve sustainability in manufacturing and reduce carbon footprint.
Hologic, Inc.
- Faces rising demands for ESG transparency and climate-friendly product innovation in healthcare tech.
7. Geopolitical Exposure
ResMed Inc.
- Operates in 140 countries, with exposure to trade tensions and foreign regulatory changes.
Hologic, Inc.
- International presence exposes it to geopolitical uncertainties, especially in Asia-Pacific and Europe.
Which company shows a better risk-adjusted profile?
ResMed’s low leverage and strong profitability mitigate its market and operational risks effectively. Hologic’s higher debt and moderate returns raise caution despite its lower stock volatility. ResMed’s Altman Z-Score of 12.9 places it far in the safe zone, signaling exceptional financial stability. Hologic’s score of 4.2 is safe but less robust. ResMed’s dominant ROIC (19.56% vs. 7.35%) outpaces its WACC by a wide margin, underscoring its superior capital efficiency. Hologic’s moderate ROIC relative to WACC signals tighter margins for error. The critical risk for ResMed is market competition requiring continuous innovation. For Hologic, elevated financial leverage poses the greatest threat. Overall, ResMed presents a stronger risk-adjusted profile, bolstered by resilient cash flow and balance sheet strength.
Final Verdict: Which stock to choose?
ResMed Inc. (RMD) shines with its unmatched ability to create value through a durable competitive moat and a consistently growing return on invested capital. Its high profitability and cash flow generation make it a robust engine for growth. A point of vigilance remains its stretched valuation metrics, which might pressure returns in a market correction. It fits aggressive growth portfolios seeking strong operational leverage.
Hologic, Inc. (HOLX) offers a strategic moat rooted in steady cash flow and solid income quality, supported by a safer balance sheet relative to ResMed. Though its recent profitability and growth have faltered, HOLX appeals to investors valuing stability and recurring revenue streams. It suits GARP portfolios aiming for growth tempered by reasonable price considerations.
If you prioritize aggressive growth underpinned by strong economic moats and expanding profitability, ResMed outshines due to its superior capital efficiency and robust income growth. However, if you seek better stability with a strategic focus on cash flow resilience and moderate valuation risk, Hologic offers a safer analytical scenario. Each presents distinct risk-return profiles aligned with different investor appetites.
Disclaimer: Investment carries a risk of loss of initial capital. The past performance is not a reliable indicator of future results. Be sure to understand risks before making an investment decision.
Go Further
I encourage you to read the complete analyses of ResMed Inc. and Hologic, Inc. to enhance your investment decisions: