Home > Comparison > Consumer Cyclical > MAR vs HLT
The strategic rivalry between Marriott International, Inc. and Hilton Worldwide Holdings Inc. shapes the consumer cyclical travel lodging sector. Marriott operates a vast, global franchising and licensing model with nearly 8,000 properties, while Hilton blends hotel management with ownership across 6,800 locations. This analysis pits Marriott’s expansive scale against Hilton’s integrated approach to determine which offers superior risk-adjusted returns for diversified portfolios.
Table of contents
Companies Overview
Marriott International and Hilton Worldwide are titans in the global travel lodging industry, shaping hospitality trends worldwide.
Marriott International, Inc.: The Global Hospitality Giant
Marriott International dominates with a diversified portfolio of 7,989 properties across 30 brands in 139 countries. Its core revenue engine lies in franchising, managing, and licensing hotels, leveraging iconic brands like Ritz-Carlton and Sheraton. In 2026, Marriott’s strategic focus emphasizes expanding its luxury and lifestyle segments to capture high-margin travelers.
Hilton Worldwide Holdings Inc.: The Hospitality Innovator
Hilton Worldwide operates approximately 6,800 properties with over 1M rooms under 18 brands, including Waldorf Astoria and Hilton Hotels. Hilton’s revenue primarily stems from a mix of management fees and franchising agreements. The company’s 2026 strategy prioritizes enhancing customer loyalty programs and expanding midscale to upscale offerings to strengthen global footprint.
Strategic Collision: Similarities & Divergences
Both firms compete intensely in hotel franchising and management, yet Marriott leans heavily on brand diversification while Hilton emphasizes customer loyalty innovation. Their battleground centers on premium and luxury segments where brand prestige drives market share. Marriott presents a broader global reach; Hilton offers a more focused asset-light model—distinct profiles for different investor appetites.
Income Statement Comparison
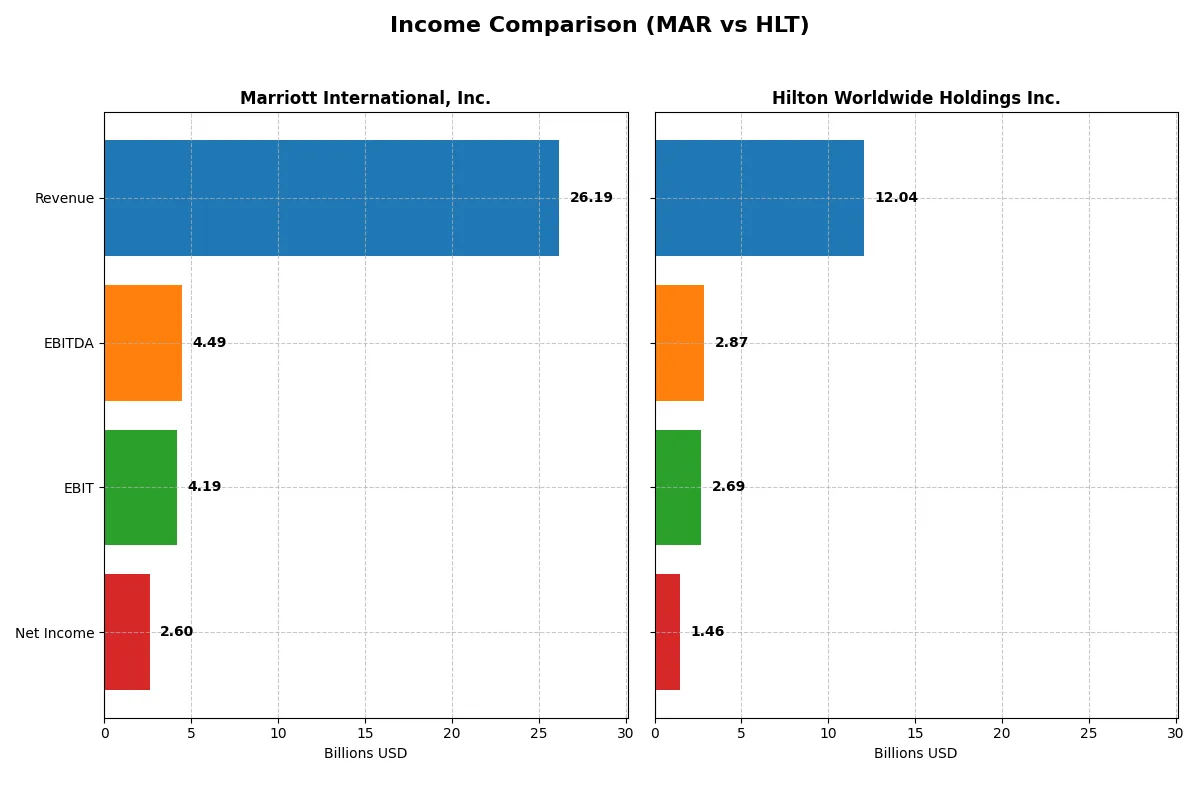
This data dissects the core profitability and scalability of both corporate engines to reveal who dominates the bottom line:
| Metric | Marriott International, Inc. (MAR) | Hilton Worldwide Holdings Inc. (HLT) |
|---|---|---|
| Revenue | 26.2B | 12.0B |
| Cost of Revenue | 20.6B | 7.1B |
| Operating Expenses | 1.45B | 2.26B |
| Gross Profit | 5.59B | 4.95B |
| EBITDA | 4.49B | 2.87B |
| EBIT | 4.19B | 2.69B |
| Interest Expense | 809M | 620M |
| Net Income | 2.60B | 1.46B |
| EPS | 9.52 | 6.18 |
| Fiscal Year | 2025 | 2025 |
Income Statement Analysis: The Bottom-Line Duel
This income statement comparison reveals the true efficiency and profitability dynamics of Marriott International and Hilton Worldwide.
Marriott International, Inc. Analysis
Marriott’s revenue grew steadily from 13.9B in 2021 to 26.2B in 2025, with net income rising from 1.1B to 2.6B. Its gross margin holds favorably at 21.3%, while net margin reached 9.9% in 2025. Despite a slight rise in operating expenses, Marriott’s EBIT surged 9% year-over-year, reflecting solid operational momentum and margin expansion.
Hilton Worldwide Holdings Inc. Analysis
Hilton doubled its revenue from 5.8B in 2021 to 12.0B in 2025, with net income growing sharply to 1.5B. The company maintains an impressive gross margin of 41.1% and a net margin of 12.1% in 2025. However, its net margin declined 12% in the last year, while EBIT grew 14.5%, indicating strong top-line growth but pressure on profitability ratios.
Margin Power vs. Revenue Scale
Marriott shows robust margin expansion with consistent net income growth, while Hilton boasts higher margins and faster revenue growth but recent margin compression. Marriott’s stable margin profile makes it a fundamentally sound choice. Hilton’s profile suits investors prioritizing scale and top-line momentum despite short-term margin risks.
Financial Ratios Comparison
These vital ratios act as a diagnostic tool to expose the underlying fiscal health, valuation premiums, and capital efficiency of the companies compared below:
| Ratios | Marriott International, Inc. (MAR) | Hilton Worldwide Holdings Inc. (HLT) |
|---|---|---|
| ROE | -69% | 0% |
| ROIC | 15.2% | 497.0% |
| P/E | 32.0 | 46.5 |
| P/B | -22.1 | 0 |
| Current Ratio | 0.38 | 0 |
| Quick Ratio | 0.38 | 0 |
| D/E (Debt-to-Equity) | -4.53 | 0 |
| Debt-to-Assets | 62.0% | 0 |
| Interest Coverage | 5.12 | 4.34 |
| Asset Turnover | 0.95 | 31.60 |
| Fixed Asset Turnover | 9.05 | 42.54 |
| Payout ratio | 27.6% | 9.8% |
| Dividend yield | 0.86% | 0.21% |
| Fiscal Year | 2025 | 2025 |
Efficiency & Valuation Duel: The Vital Signs
Ratios act as a company’s DNA, unveiling hidden risks and operational excellence crucial for understanding its true financial health.
Marriott International, Inc.
Marriott shows a mixed profitability profile with a negative ROE at -69%, signaling shareholder returns challenges. Its net margin is a neutral 9.93%, while the P/E of 32.03 suggests the stock is somewhat expensive. Marriott’s dividend yield at 0.86% is low, indicating limited direct shareholder returns amid reinvestment in growth and operational efficiency.
Hilton Worldwide Holdings Inc.
Hilton delivers a strong net margin of 12.1% and an extraordinary ROIC of 497%, reflecting high operational efficiency. However, its P/E ratio of 46.53 marks the stock as stretched. Hilton offers a low dividend yield of 0.21%, implying most cash is likely reinvested for expansion or debt reduction, supporting long-term value creation.
Premium Valuation vs. Operational Efficiency
Hilton’s superior operational metrics come at a higher valuation, posing greater risk for stretched multiples. Marriott’s lower P/E and mixed returns offer a more balanced risk profile despite profitability concerns. Investors seeking operational strength may prefer Hilton, while those valuing valuation discipline might lean toward Marriott.
Which one offers the Superior Shareholder Reward?
Marriott International (MAR) delivers a more attractive shareholder reward than Hilton Worldwide (HLT) in 2026. Marriott’s dividend yield stands near 0.86% with a prudent payout ratio around 28%, well covered by robust free cash flow of $12/share. Its buyback program, although moderate, complements steady dividends, supporting sustainable capital return. Hilton yields a mere 0.21% with a lower payout ratio near 10%, but its free cash flow per share of $9 is impressive, and it maintains aggressive buybacks driving total return. However, Hilton’s lower dividend yield and higher valuation multiples suggest less immediate income. I believe Marriott’s balanced dividend and buyback strategy offers superior, sustainable shareholder value amid industry volatility.
Comparative Score Analysis: The Strategic Profile
The radar chart reveals the fundamental DNA and trade-offs of both Marriott International, Inc. and Hilton Worldwide Holdings Inc.:
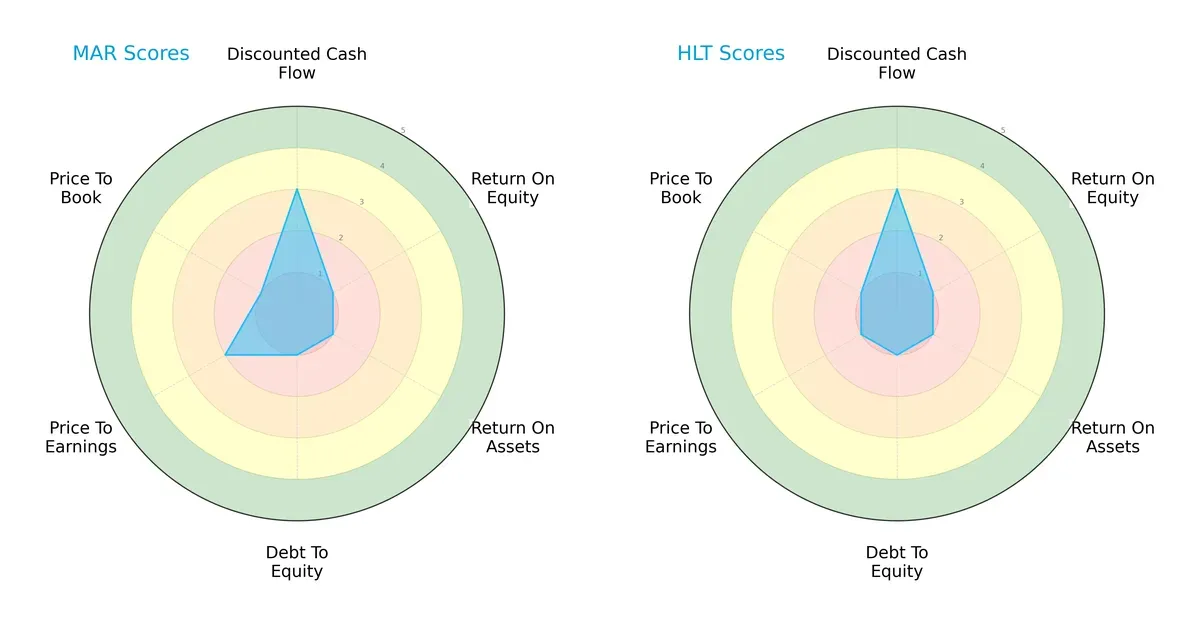
Both firms exhibit moderate discounted cash flow scores of 3, indicating similar valuation outlooks. Marriott edges Hilton slightly on price-to-earnings with a score of 2 versus 1, suggesting marginally better valuation metrics. However, both struggle with return on equity, return on assets, and debt-to-equity, each scoring 1, signaling weak profitability and heavy leverage. Marriott’s profile is slightly more balanced on valuation, while Hilton relies more heavily on a single edge: aggressive growth prospects that have yet to translate into profitability or balance sheet strength.
Bankruptcy Risk: Solvency Showdown
Marriott’s Altman Z-Score of 4.04 places it firmly in the safe zone, signaling strong financial stability and low bankruptcy risk in this economic cycle. Hilton’s Altman Z-Score data is unavailable, limiting direct solvency comparison:

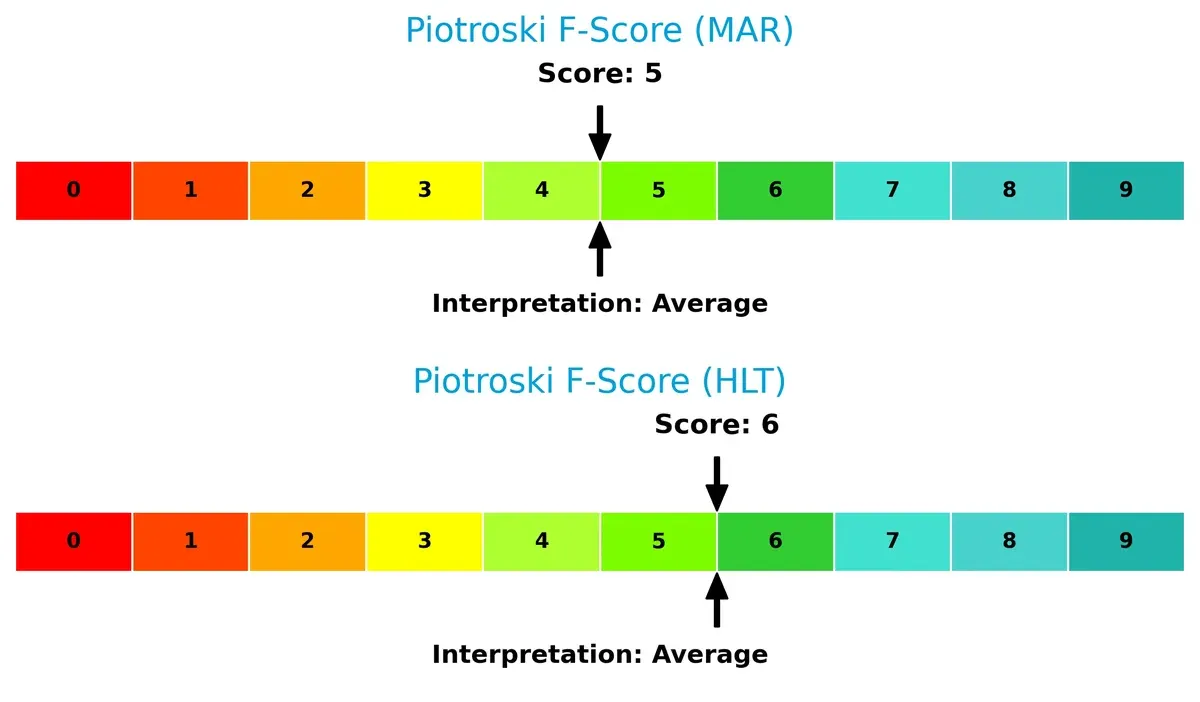
Financial Health: Quality of Operations
Marriott’s Piotroski F-Score of 5 and Hilton’s score of 6 both indicate average financial health. Hilton slightly outperforms Marriott, suggesting marginally better operational quality and internal financial metrics. Neither firm demonstrates peak financial health, and investors should monitor for red flags:
How are the two companies positioned?
This section dissects Marriott and Hilton’s operational DNA by comparing revenue distribution and internal dynamics. The goal is to confront their economic moats to reveal which model offers the most resilient competitive advantage today.
Revenue Segmentation: The Strategic Mix
The following visual comparison dissects how Marriott International and Hilton Worldwide diversify their income streams and where their primary sector bets lie:
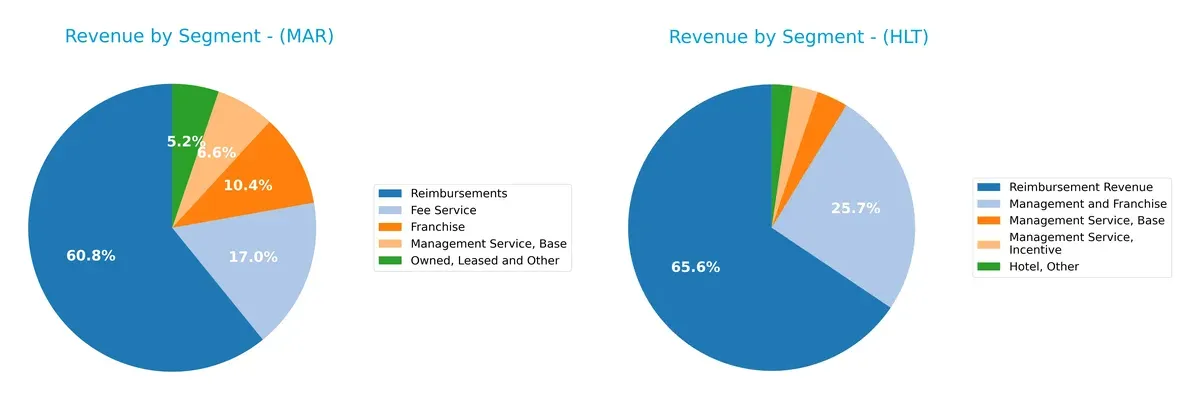
Marriott’s revenue pivots heavily on Reimbursements at $19.5B, dwarfs other segments like Fee Service ($5.4B) and Franchise ($3.3B). Hilton shows a more balanced mix, with Reimbursement Revenue at $7.1B but significant contributions from Management and Franchise ($2.8B) and Hotel Owned ($1.3B). Marriott’s concentration signals reliance on pass-through costs, increasing exposure to external cost volatility. Hilton’s diversified mix underpins more stable fee-based income, reducing concentration risk.
Strengths and Weaknesses Comparison
This table compares the Strengths and Weaknesses of Marriott and Hilton based on diversification, profitability, financials, innovation, global presence, and market share:
Marriott Strengths
- Diverse revenue from owned, leased, franchise, and management services
- Strong ROIC at 15.16% above WACC
- Favorable fixed asset turnover at 9.05
- Solid global presence with growing international segment of 5.67B
Hilton Strengths
- Higher net margin at 12.1% indicates better profitability
- Exceptional ROIC of 497%, significantly above WACC
- Strong asset and fixed asset turnover (31.6 and 42.54)
- More balanced debt-to-assets ratio favorable at 0%
Marriott Weaknesses
- Unfavorable ROE at -68.97%, indicating poor equity returns
- Low current and quick ratios at 0.38 signal liquidity concerns
- High debt-to-assets ratio of 62% increases financial risk
- Price-to-earnings ratio at 32.03 considered unfavorable
Hilton Weaknesses
- Zero current and quick ratios pose liquidity red flags
- ROE at 0% shows no return to shareholders
- High P/E ratio at 46.53 questions valuation
- Lower interest coverage at 4.34 suggests tighter debt servicing
Marriott shows strength in asset efficiency and diversification but struggles with equity returns and liquidity. Hilton excels in profitability and capital turnover but faces liquidity and valuation risks. These factors underline challenges and opportunities in their financial and strategic positioning.
The Moat Duel: Analyzing Competitive Defensibility
A structural moat is the sole shield protecting a company’s long-term profits from relentless competition erosion:
Marriott International, Inc.: Brand Portfolio & Scale Moat
Marriott’s competitive edge lies in its vast, diverse brand portfolio spanning luxury to midscale. This manifests in stable margins and a robust ROIC growth of 85.6% over 2021-25. Expansion into international markets in 2026 could deepen its scale advantage but also invites competitive risks.
Hilton Worldwide Holdings Inc.: Operational Efficiency & Franchise Model Moat
Hilton leverages a highly efficient franchise and management model, enhancing asset-light returns. Its ROIC growth exceeds Marriott’s dramatically at 8442%, signaling exceptional capital efficiency. Hilton’s focus on expanding its U.S. footprint and premium brands offers significant growth potential and operational leverage.
Scale & Efficiency: Marriott’s Brand Depth vs. Hilton’s Capital Mastery
Hilton possesses a deeper moat, evidenced by its extraordinary ROIC spread and efficiency gains. Marriott’s wider global brand reach offers scale, but Hilton’s superior capital allocation better defends market share in 2026.
Which stock offers better returns?
Over the past 12 months, Marriott International, Inc. and Hilton Worldwide Holdings Inc. both exhibited strong price appreciation with accelerating upward trends and increasing trading volumes.
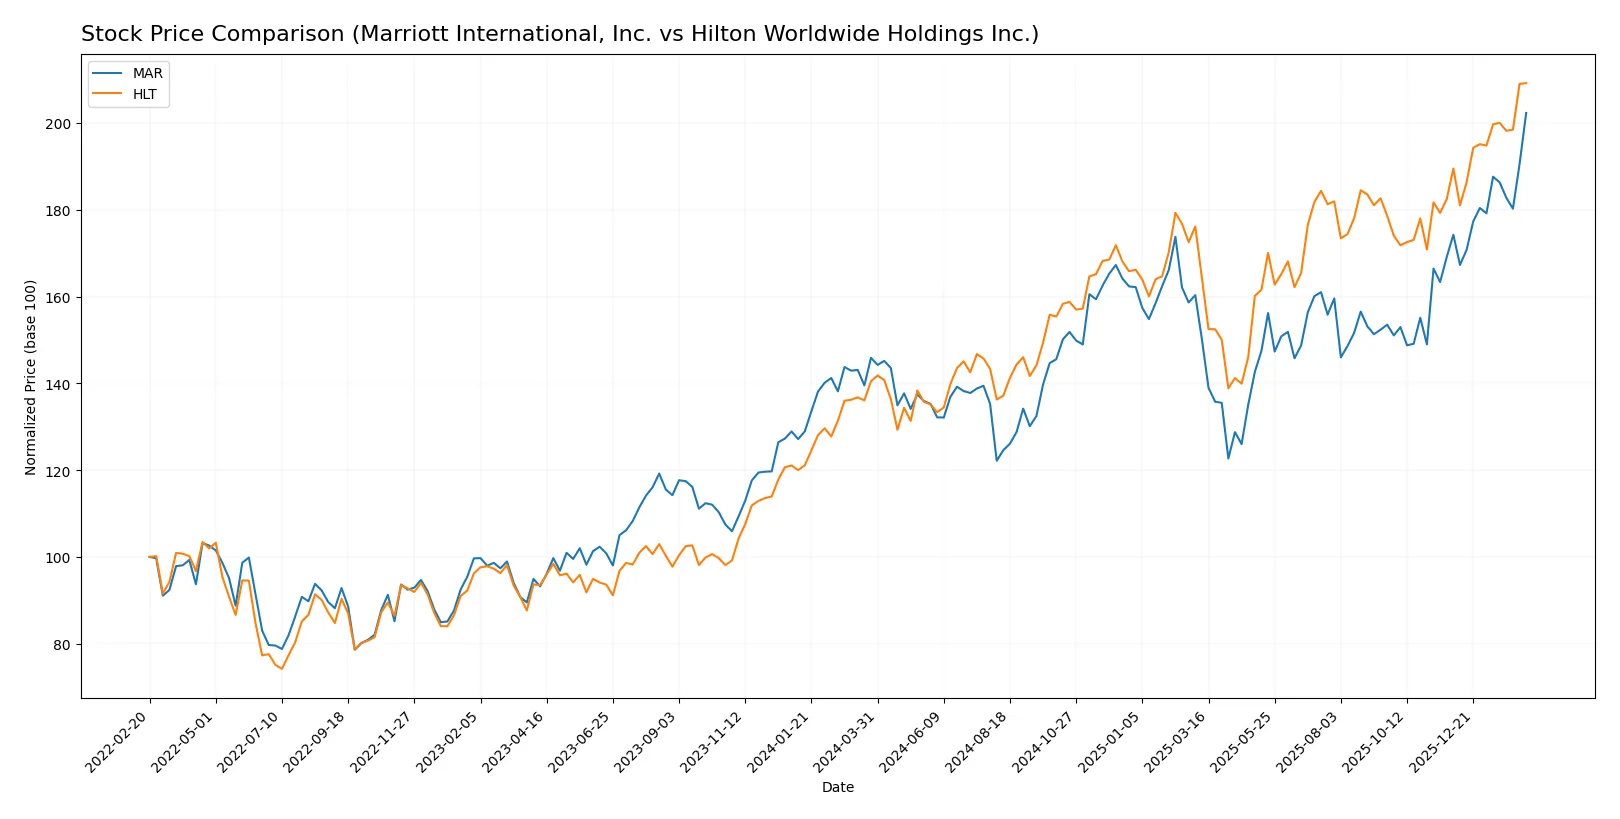
Trend Comparison
Marriott International, Inc. shows a bullish trend with a 38.69% price increase over the past year. The trend accelerates, reaching a high of 353.89, supported by a 28.23 volatility measure.
Hilton Worldwide Holdings Inc. outpaces Marriott with a 48.9% gain in the same period. Its trend also accelerates, hitting a peak of 314.62, accompanied by slightly higher volatility of 29.42.
Hilton’s stock delivered higher market performance than Marriott. Both exhibit accelerating bullish trends, but Hilton’s superior price gain and stronger buyer dominance stand out.
Target Prices
Analysts present a moderate bullish consensus for Marriott International and Hilton Worldwide.
| Company | Target Low | Target High | Consensus |
|---|---|---|---|
| Marriott International, Inc. | 310 | 400 | 356.1 |
| Hilton Worldwide Holdings Inc. | 255 | 373 | 313.25 |
Marriott’s target consensus of 356.1 slightly exceeds its current price of 353.89, suggesting modest upside. Hilton’s consensus of 313.25 aligns closely with its current price of 314.62, indicating a balanced risk-reward profile.

Don’t Let Luck Decide Your Entry Point
Optimize your entry points with our advanced ProRealTime indicators. You’ll get efficient buy signals with precise price targets for maximum performance. Start outperforming now!
How do institutions grade them?
The following tables summarize recent institutional grades for Marriott International, Inc. and Hilton Worldwide Holdings Inc.:
Marriott International, Inc. Grades
This table shows recent grade actions from major financial institutions on Marriott International:
| Grading Company | Action | New Grade | Date |
|---|---|---|---|
| Goldman Sachs | Maintain | Buy | 2026-02-11 |
| JP Morgan | Maintain | Neutral | 2026-02-11 |
| Jefferies | Maintain | Buy | 2026-02-11 |
| Macquarie | Maintain | Neutral | 2026-02-11 |
| Barclays | Maintain | Equal Weight | 2026-02-11 |
| Wells Fargo | Maintain | Overweight | 2026-02-11 |
| Evercore ISI Group | Maintain | Outperform | 2026-02-11 |
| Truist Securities | Maintain | Hold | 2026-02-11 |
| JP Morgan | Maintain | Neutral | 2026-02-03 |
| Evercore ISI Group | Maintain | Outperform | 2026-01-22 |
Hilton Worldwide Holdings Inc. Grades
The following table lists recent grades from key institutions for Hilton Worldwide Holdings:
| Grading Company | Action | New Grade | Date |
|---|---|---|---|
| Macquarie | Maintain | Neutral | 2026-02-12 |
| Mizuho | Maintain | Neutral | 2026-02-12 |
| Wells Fargo | Maintain | Overweight | 2026-02-12 |
| Truist Securities | Maintain | Hold | 2026-02-12 |
| Barclays | Maintain | Overweight | 2026-02-12 |
| JP Morgan | Maintain | Overweight | 2026-02-03 |
| Evercore ISI Group | Maintain | In Line | 2026-01-22 |
| Barclays | Maintain | Overweight | 2026-01-16 |
| Morgan Stanley | Maintain | Overweight | 2026-01-16 |
| Bernstein | Maintain | Market Perform | 2026-01-06 |
Which company has the best grades?
Hilton Worldwide holds a stronger consensus with multiple Overweight ratings from Barclays, Wells Fargo, JP Morgan, and Morgan Stanley. Marriott International shows more mixed grades, including Neutral and Hold, despite some Buy and Outperform ratings. Investors might interpret Hilton’s generally higher grades as greater confidence in near-term performance.
Risks specific to each company
The following categories identify the critical pressure points and systemic threats facing both firms in the 2026 market environment:
1. Market & Competition
Marriott International, Inc.
- Operates 7,989 properties across 139 countries, facing intense global competition and saturation risks.
Hilton Worldwide Holdings Inc.
- Manages 6,800 properties in 122 countries, contending with strong rivals and regional market volatility.
2. Capital Structure & Debt
Marriott International, Inc.
- High debt-to-assets at 62%, raising leverage concerns despite favorable interest coverage.
Hilton Worldwide Holdings Inc.
- Debt metrics appear favorable with no reported debt-to-assets, indicating a stronger balance sheet.
3. Stock Volatility
Marriott International, Inc.
- Beta of 1.101 suggests moderate sensitivity to market swings, typical for lodging sector.
Hilton Worldwide Holdings Inc.
- Slightly higher beta at 1.11, reflecting marginally greater stock price volatility.
4. Regulatory & Legal
Marriott International, Inc.
- Exposed to diverse international regulations, including data privacy and hospitality standards.
Hilton Worldwide Holdings Inc.
- Similarly faces complex regulatory environments globally, with potential legal risks in franchising.
5. Supply Chain & Operations
Marriott International, Inc.
- Large scale operations risk disruptions, especially in international markets.
Hilton Worldwide Holdings Inc.
- Operational risks exist but less extensive footprint could mitigate supply chain complexity.
6. ESG & Climate Transition
Marriott International, Inc.
- Increasing pressure to improve sustainability across nearly 8,000 properties worldwide.
Hilton Worldwide Holdings Inc.
- Faces ESG demands but can leverage smaller scale to implement faster climate initiatives.
7. Geopolitical Exposure
Marriott International, Inc.
- Broad global presence heightens exposure to geopolitical instability, especially in emerging markets.
Hilton Worldwide Holdings Inc.
- Also globally exposed but with slightly fewer regions and properties to manage geopolitical risks.
Which company shows a better risk-adjusted profile?
Marriott’s highest risk is its heavy leverage, with a debt-to-assets ratio over 60%, posing financial strain if market conditions worsen. Hilton’s primary risk lies in its higher stock volatility and less transparent debt data, raising questions on financial stability. Hilton’s more favorable debt profile and slightly better ESG adaptability support a stronger risk-adjusted stance. However, Marriott’s sheer scale and diversification provide a buffer against operational risks. Recent data showing Marriott’s unfavorable liquidity ratios versus Hilton’s absence of debt metrics justify caution towards Marriott’s capital structure risks. Overall, Hilton shows a marginally better risk-adjusted profile given its balance sheet resilience and operational scale.
Final Verdict: Which stock to choose?
Marriott International’s superpower lies in its stable value creation and steadily growing ROIC. It demonstrates operational resilience with solid cash flow generation. However, its stretched liquidity ratios warrant caution. Marriott suits investors seeking aggressive growth with a tolerance for balance sheet risks.
Hilton Worldwide commands a strategic moat through exceptional capital efficiency and superior asset turnover. Its financial safety, marked by low debt levels and strong income quality, offers better stability than Marriott. Hilton fits well in portfolios aiming for growth at a reasonable price with a preference for disciplined capital allocation.
If you prioritize robust capital efficiency and financial safety, Hilton outshines Marriott due to its compelling moat and lower leverage. However, if you seek aggressive growth backed by a company steadily increasing its operating returns despite liquidity concerns, Marriott presents an intriguing scenario. Both require careful risk assessment aligned with your investment profile.
Disclaimer: Investment carries a risk of loss of initial capital. The past performance is not a reliable indicator of future results. Be sure to understand risks before making an investment decision.
Go Further
I encourage you to read the complete analyses of Marriott International, Inc. and Hilton Worldwide Holdings Inc. to enhance your investment decisions: