In the rapidly evolving industrial machinery sector, Hillenbrand, Inc. and Symbotic Inc. stand out as key players with distinct approaches to innovation and market focus. Hillenbrand offers diversified solutions across processing and molding technologies, while Symbotic specializes in cutting-edge warehouse automation. Comparing these companies provides valuable insight into traditional industrial strength versus technological disruption. Join me as we explore which company presents the most compelling opportunity for your investment portfolio in 2025.
Table of contents
Companies Overview
I will begin the comparison between Hillenbrand, Inc. and Symbotic Inc. by providing an overview of these two companies and their main differences.
Hillenbrand, Inc. Overview
Hillenbrand, Inc. is a diversified industrial company operating in the United States and internationally. It serves multiple industries through three segments: Advanced Process Solutions, Molding Technology Solutions, and Batesville, which offers funeral service products. Founded in 1906 and headquartered in Batesville, Indiana, Hillenbrand focuses on equipment design, manufacturing, and distribution with a strong legacy in industrial machinery.
Symbotic Inc. Overview
Symbotic Inc. specializes in automation technology, providing robotics and warehouse automation systems primarily for retailers and wholesalers in the U.S. Its flagship offering, The Symbotic System, enhances operational efficiency and inventory management. Founded more recently and based in Wilmington, Massachusetts, Symbotic is positioned as a technology-driven company within the industrial machinery sector.
Key similarities and differences
Both companies operate in the industrial machinery sector in the United States but differ significantly in focus and scale. Hillenbrand is a diversified industrial manufacturer with a legacy spanning over a century, while Symbotic concentrates on cutting-edge warehouse automation technology. Hillenbrand’s broader product range contrasts with Symbotic’s specialized robotics solutions, reflecting differing approaches to innovation and market demands.
Income Statement Comparison
The table below presents a side-by-side comparison of key income statement metrics for Hillenbrand, Inc. and Symbotic Inc. for the fiscal year 2025.
| Metric | Hillenbrand, Inc. (HI) | Symbotic Inc. (SYM) |
|---|---|---|
| Market Cap | 2.23B | 35.63B |
| Revenue | 2.67B | 2.25B |
| EBITDA | 231M | -48M |
| EBIT | 92M | -92M |
| Net Income | 43M | -17M |
| EPS | 0.74 | -0.16 |
| Fiscal Year | 2025 | 2025 |
Income Statement Interpretations
Hillenbrand, Inc. experienced a revenue decline of nearly 16% from 2024 to 2025, with net income turning positive at $43M after a significant loss the previous year. Gross margins remained stable around 34%, supporting improved profitability. The latest year showed a notable recovery in EBIT and net margin, reflecting better operational efficiency despite lower sales.
Symbotic Inc. posted a strong revenue growth of 25.65% between 2024 and 2025, with gross profit rising over 51%. However, operating expenses grew disproportionately, leading to a negative EBIT margin and a net loss of $17M, although slightly improved from prior years. The company’s EPS declined sharply, signaling ongoing profitability challenges despite top-line expansion.
Which one has the stronger fundamentals?
Hillenbrand’s fundamentals appear stronger, supported by positive net income growth, improved EBIT, and stable margins despite revenue contraction. In contrast, Symbotic’s rapid revenue growth is offset by widening losses, negative margins, and declining EPS. The income statement evaluation favors Hillenbrand, reflecting better control over costs and a more balanced profitability profile.
Financial Ratios Comparison
The table below presents a side-by-side comparison of key financial ratios for Hillenbrand, Inc. (HI) and Symbotic Inc. (SYM) for their most recent fiscal year, offering insight into their profitability, liquidity, leverage, and market valuation.
| Ratios | Hillenbrand, Inc. (HI) | Symbotic Inc. (SYM) |
|---|---|---|
| ROE | 3.66% | -16.67% |
| ROIC | -32.60% | -17.47% |
| P/E | 36.69 | -70.32 |
| P/B | 1.34 | 11.73 |
| Current Ratio | 1.22 | 1.09 |
| Quick Ratio | 0.88 | 1.00 |
| D/E (Debt-to-Equity) | 1.12 | 0 |
| Debt-to-Assets | 35.86% | 0 |
| Interest Coverage | 0.55 | 0 |
| Asset Turnover | 0.60 | 0.94 |
| Fixed Asset Turnover | 7.80 | 19.10 |
| Payout Ratio | 122% | 0 |
| Dividend Yield | 3.32% | 0 |
Interpretation of the Ratios
Hillenbrand, Inc. shows a mixed financial profile with several unfavorable ratios including net margin at 1.95% and return on invested capital deeply negative at -32.6%. Positives include a favorable weighted average cost of capital at 6.01% and a promising fixed asset turnover of 7.8. The company pays dividends with a solid yield of 3.32%, indicating consistent shareholder returns, though some payout risks may exist given mixed profitability metrics.
Symbotic Inc. presents predominantly unfavorable ratios with a negative net margin of -3.59% and a poor return on equity at -16.67%. Its weighted average cost of capital is high at 13.59%, adding financial pressure. Symbotic does not pay dividends, likely due to ongoing reinvestment in R&D and growth. It maintains a debt-free structure but shows weak interest coverage, reflecting operational challenges.
Which one has the best ratios?
Both companies face significant challenges with unfavorable overall ratio evaluations, each with 28.57% favorable ratios but more than 40% unfavorable. Hillenbrand has a slight edge in profitability and dividend returns, while Symbotic benefits from no debt but suffers from deeper operational losses. Neither company currently demonstrates a clearly superior financial ratio profile.
Strategic Positioning
I will now compare Hillenbrand and Symbotic’s positioning to understand their respective business strategies better.
Hillenbrand Positioning
Hillenbrand operates as a diversified industrial company with key segments in Process Equipment Group and Milacron, serving multiple industries with machinery and funeral services products. The Process Equipment Group drives most revenue, though it declined from $2.29B in 2024 to $2.07B in 2025, while Milacron also saw a sharp drop to $604M in 2025. The company faces competitive pressure from technological advances in automation and production equipment, with recent growth slowing and concentration risks rising in its core industrial segments.
Symbotic Positioning
Symbotic focuses on automation technology for retailers and wholesalers, centering its revenue on its Systems segment, which soared from $1.71B in 2024 to $2.12B in 2025, highlighting rapid growth and adoption. Supporting segments like Operation Services and Software Maintenance also expanded significantly, reflecting a technology-driven market position. Symbotic faces strong competitive pressure and benefits from technological disruption in warehouse automation, with accelerating growth but elevated beta indicating higher volatility.
Hillenbrand vs Symbotic Positioning
Hillenbrand exhibits a diversified portfolio across industrial machinery and funeral services, which offers risk distribution but slower growth potential. Symbotic’s concentrated focus on automation technology allows for rapid expansion and innovation but increases exposure to market fluctuations and technological risks. The trade-off lies between stable, multi-segment revenue versus high-growth specialization.
Stock Comparison
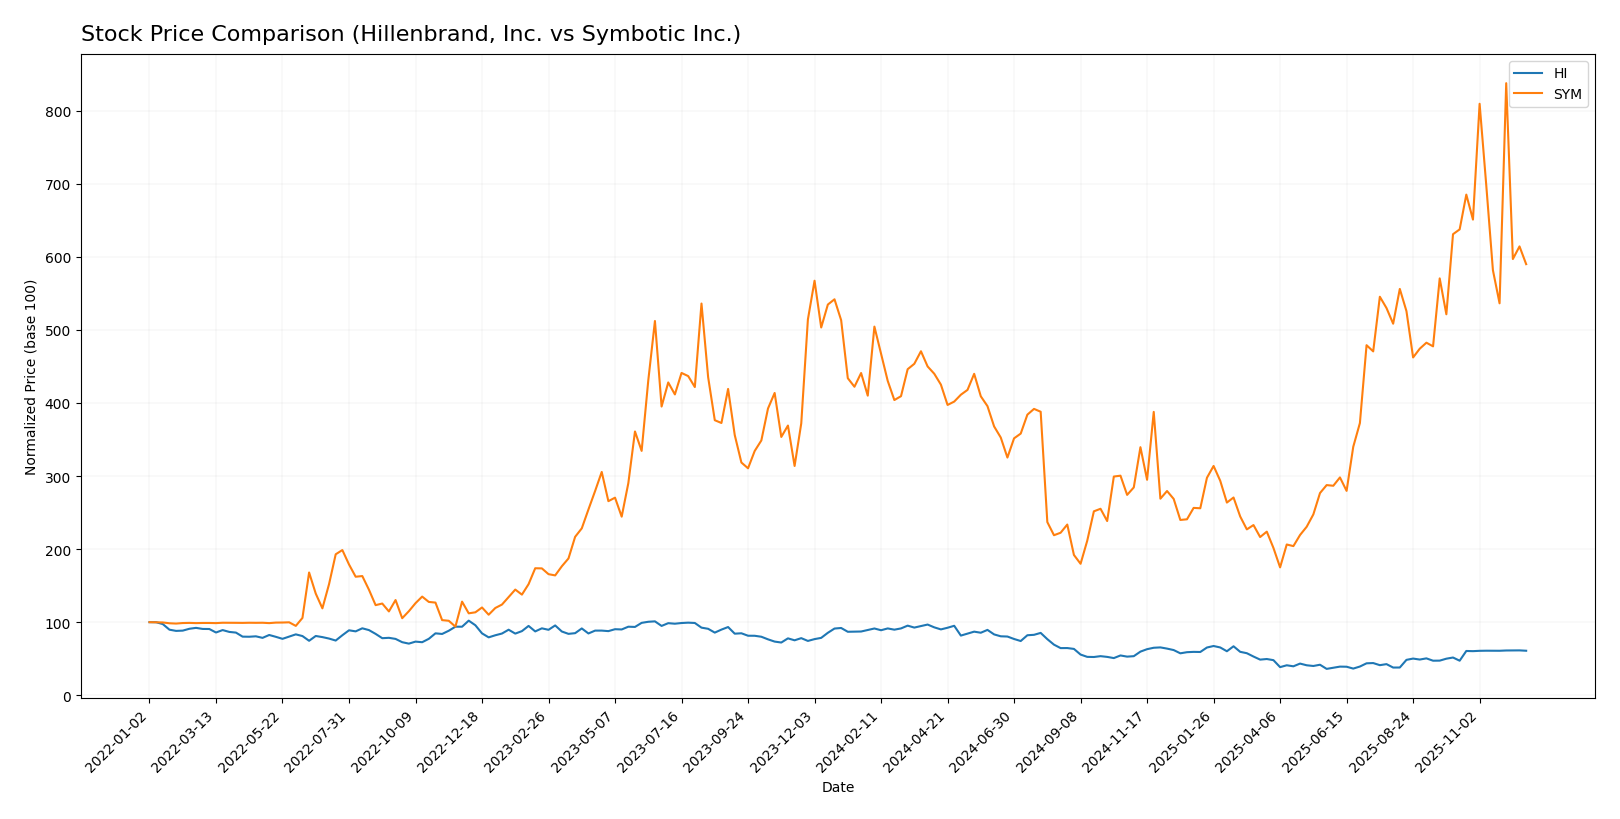
The stock price movements of Hillenbrand, Inc. (HI) and Symbotic Inc. (SYM) over the past year reveal contrasting trends, with HI experiencing a significant decline and recent recovery, while SYM shows strong gains but recent pullback.
Trend Analysis
Hillenbrand, Inc. (HI) exhibited a bearish trend over the past 12 months with a price decline of 31.81%, accompanied by accelerating downward momentum and a high volatility level of 9.19. Notably, it recently reversed with an 18.0% rise in the final months.
Symbotic Inc. (SYM) demonstrated a bullish trend over the past year with a 43.9% price increase, though the trend showed signs of deceleration. Recent trading saw a 6.5% decline, reflecting short-term negative pressure amid elevated volatility at 14.5.
Comparing the two, Symbotic Inc. delivered the highest market performance over the past year with a strong overall gain, while Hillenbrand, Inc. faced a steep decline but showed signs of recovery in the closing period.
Analyst Opinions Comparison
I will now compare Hillenbrand, Inc. and Symbotic Inc.’s ratings, grades, and price targets to gauge analysts’ opinions.
Hillenbrand, Inc. Rating
Hillenbrand holds a B+ rating with a solid overall score of 3, showing strengths in discounted cash flow and return on assets but weaknesses in debt to equity and return on equity.
Symbotic Inc. Rating
Symbotic carries a C rating with an overall score of 2, excelling in discounted cash flow but scoring low in return on equity, return on assets, debt to equity, price to earnings, and price to book ratios.
Which one is the best rated?
Hillenbrand is clearly the better-rated company with a B+ score and higher overall financial metrics compared to Symbotic’s C rating and lower overall score.
Hillenbrand, Inc. Grades
The following table shows recent grades assigned to Hillenbrand, Inc. by reputable grading firms.
| Grading Company | Action | New Grade | Date |
|---|---|---|---|
| DA Davidson | Maintain | Neutral | 2025-11-20 |
| DA Davidson | Maintain | Neutral | 2025-10-16 |
| CJS Securities | Downgrade | Market Perform | 2025-10-16 |
| Keybanc | Downgrade | Sector Weight | 2025-05-08 |
| DA Davidson | Maintain | Neutral | 2025-05-01 |
| DA Davidson | Maintain | Neutral | 2024-11-15 |
| Keybanc | Maintain | Overweight | 2024-11-14 |
| DA Davidson | Downgrade | Neutral | 2024-08-12 |
| DA Davidson | Maintain | Buy | 2021-02-08 |
| DA Davidson | Maintain | Buy | 2021-02-07 |
Overall, Hillenbrand’s grades show a trend toward more cautious ratings, with several downgrades from Buy or Overweight to Neutral or Sector Weight.
Symbotic Inc. Grades
Below are the recent grades for Symbotic Inc. provided by recognized financial institutions.
| Grading Company | Action | New Grade | Date |
|---|---|---|---|
| Goldman Sachs | Downgrade | Sell | 2025-12-02 |
| Barclays | Maintain | Underweight | 2025-11-26 |
| Baird | Maintain | Neutral | 2025-11-26 |
| Craig-Hallum | Upgrade | Buy | 2025-11-25 |
| Northland Capital Markets | Maintain | Outperform | 2025-11-25 |
| Needham | Maintain | Buy | 2025-11-25 |
| Cantor Fitzgerald | Maintain | Overweight | 2025-11-25 |
| DA Davidson | Maintain | Neutral | 2025-11-25 |
| Citigroup | Maintain | Buy | 2025-11-25 |
| UBS | Downgrade | Sell | 2025-09-23 |
Symbotic’s grades are mixed but include notable downgrades to Sell from major firms alongside several Buy and Outperform ratings, indicating a divided analyst outlook.
Grades Comparison of Hillenbrand, Inc. and Symbotic Inc.
Symbotic Inc. has received both stronger Buy and Outperform ratings and significant Sell downgrades, reflecting polarized analyst views. Hillenbrand’s grades are more consistent but generally cautious, trending toward Neutral. This divergence may affect investor sentiment and portfolio risk profiles differently.
Target Prices
The consensus target prices reflect a generally optimistic outlook from analysts for both Hillenbrand, Inc. and Symbotic Inc.
| Company | Target High | Target Low | Consensus |
|---|---|---|---|
| Hillenbrand, Inc. | 32 | 32 | 32 |
| Symbotic Inc. | 83 | 41 | 65.11 |
Analysts expect Hillenbrand’s price to hold steady near the current $31.66, while Symbotic’s consensus target of $65.11 suggests upside potential from its current $59 price.
Strengths and Weaknesses
Below is a comparative overview of key strengths and weaknesses for Hillenbrand, Inc. (HI) and Symbotic Inc. (SYM) based on the latest financial and operational data.
| Criterion | Hillenbrand, Inc. (HI) | Symbotic Inc. (SYM) |
|---|---|---|
| Diversification | Operates across multiple industrial segments including process solutions, molding technology, and funeral services, providing good risk spread. | Focused mainly on warehouse automation technology; less diversified. |
| Profitability | Positive net profit margin (~1.95%) with consistent cash flow; dividend yield ~3.3%. | Negative net profit margin (~-3.6%), no dividends; currently unprofitable. |
| Innovation | Established industrial machinery with steady improvements; less emphasis on cutting-edge robotics. | Leader in automation and robotics innovation for supply chain efficiency. |
| Global presence | Operates internationally with a broad industrial footprint. | Primarily focused on U.S. market with growth potential. |
| Market Share | Moderate market cap (~2.23B USD) with stable industrial niche. | Larger market cap (~35.6B USD), rapidly expanding in automation sector. |
| Debt level | High leverage: debt to equity ratio ~1.12, debt to market cap ~0.84, moderate solvency concerns. | Low or no debt reported, strong balance sheet with positive working capital. |
In summary, Hillenbrand offers diversification and stable profitability with moderate debt risks, suitable for risk-conscious investors favoring dividends. Symbotic shows strong innovation and growth potential with a robust balance sheet but currently lacks profitability, implying higher risk and growth-oriented appeal.
Risk Analysis
The table below summarizes key risks for Hillenbrand, Inc. (HI) and Symbotic Inc. (SYM) as of 2025:
| Metric | Hillenbrand, Inc. (HI) | Symbotic Inc. (SYM) |
|---|---|---|
| Market Risk | Moderate – Beta at 1.40 indicates sensitivity to market fluctuations. | High – Beta at 2.11 shows higher volatility. |
| Regulatory Risk | Moderate – Industrial machinery sector faces evolving environmental and safety regulations. | Moderate – Automation tech may face data privacy and safety compliance challenges. |
| Operational Risk | Moderate – Diverse segments reduce risk but debt levels and leverage are concerns. | High – Negative profit margins and operational losses increase execution risks. |
| Environmental Risk | Moderate – Exposure due to manufacturing processes and waste handling. | Low to Moderate – Primarily technology-driven with less direct environmental impact. |
| Geopolitical Risk | Low – US-based with international operations but no critical exposure to volatile regions. | Low – US-focused operations with limited geopolitical exposure. |
Hillenbrand faces moderate market and regulatory risks, with leverage and debt servicing as notable operational concerns. Symbotic is more vulnerable to market volatility and operational risks due to ongoing losses and high financial leverage. Investors should weigh Symbotic’s growth potential against its profitability challenges and risk profile.
Which Stock to Choose?
Hillenbrand, Inc. (HI) shows a declining income with a -16% revenue growth but favorable EBIT growth (+615%) and net margin improvement. Its financial ratios present mixed signals, with low profitability (ROE 3.66%) and high debt ratios, resulting in a B+ rating.
Symbotic Inc. (SYM) exhibits strong revenue growth (+26%) but overall unfavorable profitability metrics, including negative net margin (-3.59%) and returns. Its financial ratios reveal high valuation multiples and zero debt, yet it holds a lower C rating due to weak returns.
Considering ratings and financial profiles, investors with a risk-tolerant, growth-oriented approach might view SYM’s revenue momentum positively despite its weak profitability. Conversely, those prioritizing stable income and stronger ratings could find HI’s improving earnings and higher rating more aligned with their goals.
Disclaimer: Investment carries a risk of loss of initial capital. The past performance is not a reliable indicator of future results. Be sure to understand risks before making an investment decision.
Go Further
I encourage you to read the complete analyses of Hillenbrand, Inc. and Symbotic Inc. to enhance your investment decisions: