In the dynamic industrial machinery sector, Hillenbrand, Inc. and Kadant Inc. stand out as key players with overlapping markets and distinct innovation approaches. Hillenbrand’s diversified segments contrast with Kadant’s specialized engineered systems focus, offering investors varied exposure to industrial growth. This comparison aims to clarify which company presents a more compelling investment opportunity in 2025. Let’s explore their strengths to help you make an informed choice.
Table of contents
Companies Overview
I will begin the comparison between Hillenbrand, Inc. and Kadant Inc. by providing an overview of these two companies and their main differences.
Hillenbrand, Inc. Overview
Hillenbrand, Inc. operates as a diversified industrial company, serving markets in the United States and internationally. It focuses on three main segments: Advanced Process Solutions, Molding Technology Solutions, and Batesville, which provides funeral service products. Founded in 1906 and headquartered in Batesville, Indiana, Hillenbrand is positioned as a multi-segment industrial machinery provider with a broad industry reach.
Kadant Inc. Overview
Kadant Inc. supplies technologies and engineered systems through three segments: Flow Control, Industrial Processing, and Material Handling. The company develops fluid-handling systems, industrial automation, and conveying equipment for various industries including packaging and wood products. Kadant was incorporated in 1991, is based in Westford, Massachusetts, and is known for specialized industrial machinery and process technology solutions.
Key similarities and differences
Both Hillenbrand and Kadant operate within the industrial machinery sector, offering engineered equipment and systems. While Hillenbrand has a diversified portfolio including funeral service products, Kadant focuses more narrowly on fluid handling, industrial processing, and material handling technologies. Hillenbrand employs over 10K people compared to Kadant’s 3.5K, reflecting different scales and operational scopes within the industrial market.
Income Statement Comparison
The table below presents a side-by-side comparison of key income statement metrics for Hillenbrand, Inc. and Kadant Inc. for their most recent fiscal years.
| Metric | Hillenbrand, Inc. (HI) | Kadant Inc. (KAI) |
|---|---|---|
| Market Cap | 2.23B | 3.40B |
| Revenue | 2.67B | 1.05B |
| EBITDA | 231M | 223M |
| EBIT | 92.1M | 173M |
| Net Income | 43.1M | 112M |
| EPS | 0.74 | 9.51 |
| Fiscal Year | 2025 | 2024 |
Income Statement Interpretations
Hillenbrand, Inc. experienced a revenue decline of nearly 16% from 2024 to 2025, with net income turning positive to $43M after a prior loss. Gross margins remained stable at about 34%, supporting a neutral EBIT margin around 3.4%. The recent year showed improved profitability with EBIT growing over 600%, reflecting better cost control despite lower sales.
Kadant Inc. saw revenue grow by 10% from 2023 to 2024, with net income slightly decreasing to $112M. Gross margin improved to 44%, and the EBIT margin rose to 16.4%, indicating operational efficiency. However, net margin and EPS declined, suggesting some pressure on bottom-line growth despite top-line gains and favorable overall income statement metrics.
Which one has the stronger fundamentals?
Both companies present favorable overall income statement evaluations, with Kadant showing stronger revenue and gross profit growth alongside higher margins. However, Kadant’s net margin and EPS faced recent declines, whereas Hillenbrand improved profitability significantly despite revenue contraction. Hillenbrand’s margin stability and net income turnaround highlight resilience, while Kadant’s growth is more consistent but with margin pressures.
Financial Ratios Comparison
This table compares key financial ratios for Hillenbrand, Inc. and Kadant Inc. based on their most recent fiscal year data, providing a snapshot of operational efficiency, profitability, liquidity, and leverage.
| Ratios | Hillenbrand, Inc. (HI) 2025 | Kadant Inc. (KAI) 2024 |
|---|---|---|
| ROE | 3.7% | 13.2% |
| ROIC | -32.6% | 10.1% |
| P/E | 36.7 | 36.9 |
| P/B | 1.34 | 4.86 |
| Current Ratio | 1.22 | 2.31 |
| Quick Ratio | 0.88 | 1.55 |
| D/E (Debt-to-Equity) | 1.12 | 0.38 |
| Debt-to-Assets | 35.9% | 22.6% |
| Interest Coverage | 0.55 | 8.55 |
| Asset Turnover | 0.60 | 0.74 |
| Fixed Asset Turnover | 7.80 | 6.18 |
| Payout Ratio | 122% | 13.1% |
| Dividend Yield | 3.3% | 0.36% |
Interpretation of the Ratios
Hillenbrand, Inc. (HI) displays a mixed financial profile with several unfavorable ratios, including low net margin (1.95%) and return on equity (3.66%), alongside a significantly negative return on invested capital (-32.6%). The company’s dividend yield is attractive at 3.32%, indicating stable shareholder returns, but concerns arise from its high debt-to-equity ratio (1.12) and weak interest coverage (0.97), suggesting financial risk.
Kadant Inc. (KAI) shows stronger ratios overall, with a favorable net margin of 10.59% and a solid return on invested capital at 10.08%. Its balance sheet strength is evident in a high current ratio (2.31) and low debt-to-equity ratio (0.38). Despite a low dividend yield of 0.36%, Kadant’s payout appears more conservative, supported by strong interest coverage (8.64) and manageable leverage.
Which one has the best ratios?
Kadant Inc. (KAI) presents a more favorable ratio set, exhibiting stronger profitability, liquidity, and solvency metrics. Hillenbrand, Inc. (HI) carries notable risks including low returns and high leverage, despite its higher dividend yield. Overall, Kadant’s financial ratios suggest a healthier operational and financial position compared to Hillenbrand’s mixed and riskier profile.
Strategic Positioning
I will now compare Hillenbrand and Kadant’s positioning to understand their respective business strategies better.
Hillenbrand Positioning
Hillenbrand operates in diversified industrial machinery with key segments: Advanced Process Solutions, Molding Technology Solutions, and Batesville funeral products. Its Process Equipment segment dominates revenue but declined from $2.29B in 2024 to $2.07B in 2025, showing recent slowdown. The company faces competitive pressure in industrial machinery and evolving demands in its niche markets.
Kadant Positioning
Kadant focuses on engineered systems in Flow Control, Industrial Processing, and Material Handling. Its Parts and Consumables segment leads revenue, growing from $599M in 2023 to $694M in 2024. Kadant shows steady growth driven by consumables, with moderate competitive pressures and innovation in fluid-handling and automation systems.
Hillenbrand vs Kadant Positioning
Hillenbrand offers a diversified portfolio across industrial and funeral segments, reducing dependence risks but facing complexity. Kadant’s more concentrated focus on engineered systems and consumables strengthens specialization but increases exposure to specific market shifts and technological disruption risks.
Stock Comparison
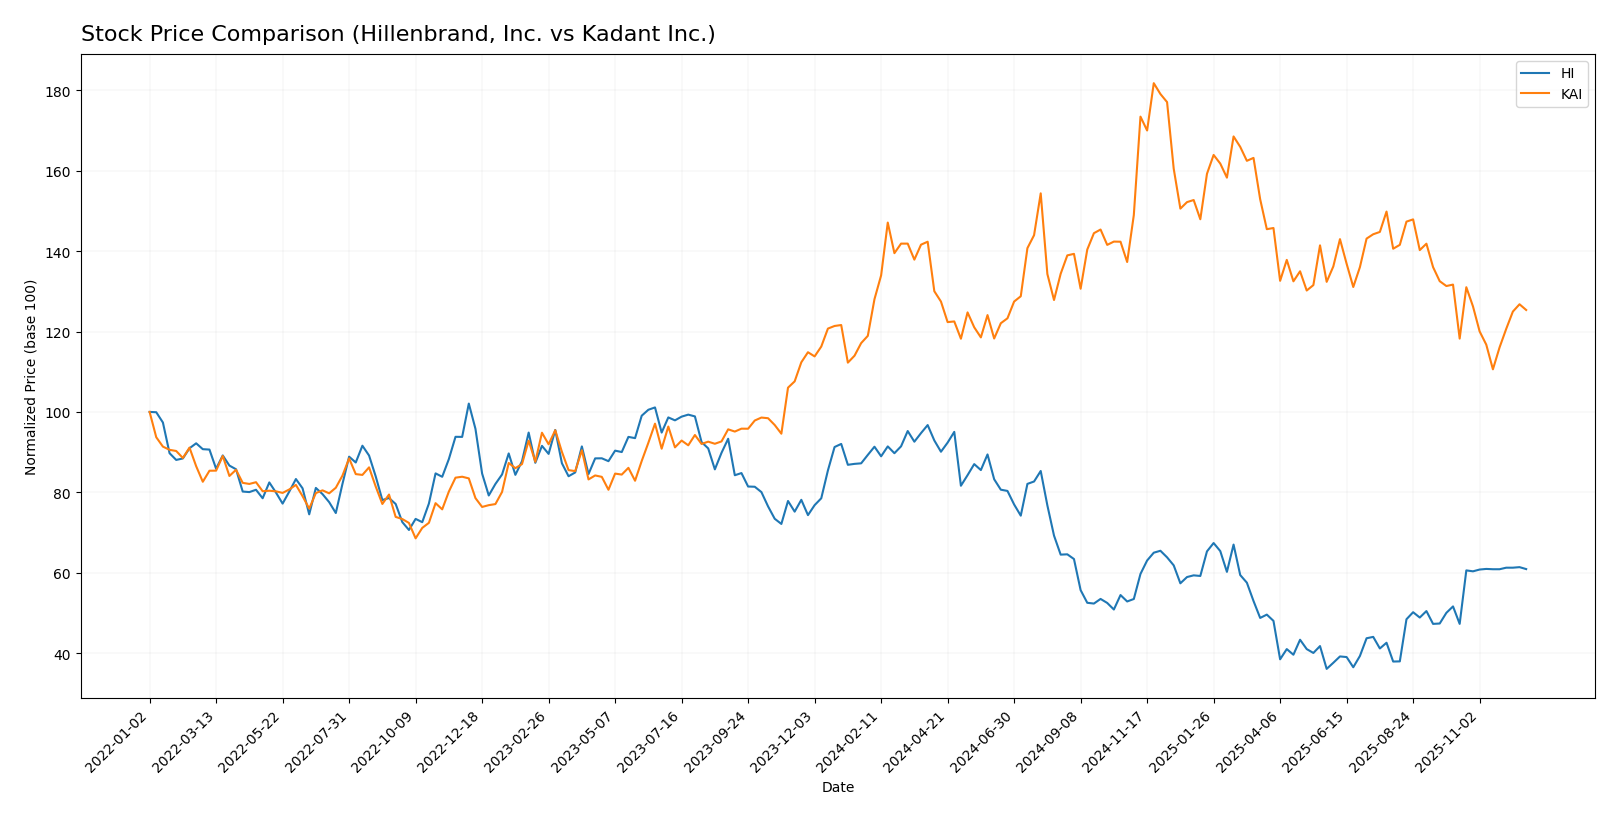
The stock price movements of Hillenbrand, Inc. (HI) and Kadant Inc. (KAI) over the past 12 months reveal contrasting trends, with notable volatility and shifting investor sentiment shaping their trading dynamics.
Trend Analysis
Hillenbrand, Inc. (HI) experienced a bearish trend over the past 12 months, with a price decline of 31.81% and accelerating downside momentum. The stock showed significant volatility, ranging between 18.75 and 50.29, but recently rebounded with an 18.0% gain.
Kadant Inc. (KAI) exhibited a bullish trend with a 5.41% price increase over the year, although the upward trend showed deceleration. The stock was highly volatile, fluctuating from 254.91 to 419.01, but recently faced a 4.8% decline, indicating short-term pressure.
Comparing the two, Kadant delivered the highest market performance over the year with a positive 5.41% gain, whereas Hillenbrand’s stock declined sharply by 31.81%, despite a recent recovery phase.
Analyst Opinions Comparison
I will now compare Hillenbrand and Kadant’s ratings, grades, and price targets to gauge analysts’ opinions.
Hillenbrand Rating
Hillenbrand holds a B+ rating with an overall score of 3, showing strong discounted cash flow and return on assets but weaker debt to equity and return on equity metrics.
Kadant Rating
Kadant is rated A- with an overall score of 4, reflecting solid performance in return on equity, assets, and debt management, though its price to book score is lower.
Which one is the best rated?
Kadant is the best-rated company with an A- and higher overall score, outperforming Hillenbrand’s B+ due to stronger equity returns and better debt ratios.
Hillenbrand, Inc. Grades
The following table summarizes recent grading updates for Hillenbrand, Inc. by recognized financial firms.
| Grading Company | Action | New Grade | Date |
|---|---|---|---|
| DA Davidson | Maintain | Neutral | 2025-11-20 |
| DA Davidson | Maintain | Neutral | 2025-10-16 |
| CJS Securities | Downgrade | Market Perform | 2025-10-16 |
| Keybanc | Downgrade | Sector Weight | 2025-05-08 |
| DA Davidson | Maintain | Neutral | 2025-05-01 |
| DA Davidson | Maintain | Neutral | 2024-11-15 |
| Keybanc | Maintain | Overweight | 2024-11-14 |
| DA Davidson | Downgrade | Neutral | 2024-08-12 |
| DA Davidson | Maintain | Buy | 2021-02-08 |
| DA Davidson | Maintain | Buy | 2021-02-07 |
Overall, Hillenbrand’s grades have trended downward recently with a shift from overweight and buy ratings toward more neutral and sector weight assessments.
Kadant Inc. Grades
Below is a summary of recent grading activity for Kadant Inc. from established rating agencies.
| Grading Company | Action | New Grade | Date |
|---|---|---|---|
| Barrington Research | Maintain | Outperform | 2025-10-30 |
| Barrington Research | Maintain | Outperform | 2025-10-29 |
| Barrington Research | Maintain | Outperform | 2025-10-27 |
| Barrington Research | Maintain | Outperform | 2025-10-10 |
| Barrington Research | Maintain | Outperform | 2025-09-23 |
| DA Davidson | Maintain | Neutral | 2025-08-04 |
| Barrington Research | Maintain | Outperform | 2025-07-30 |
| Barrington Research | Maintain | Outperform | 2025-07-29 |
| Barrington Research | Maintain | Outperform | 2025-05-01 |
| DA Davidson | Maintain | Neutral | 2025-05-01 |
Kadant’s ratings consistently show strong endorsement from Barrington Research with repeated Outperform grades, balanced by Neutral ratings from DA Davidson.
Grades Comparison of Hillenbrand, Inc. and Kadant Inc.
Kadant Inc. has received consistently stronger grades, primarily Outperform from Barrington Research, compared to Hillenbrand’s mostly Neutral and downgraded ratings. This disparity could influence investor sentiment and portfolio weighting decisions.
Target Prices
Analysts present a clear consensus on target prices for Hillenbrand, Inc. and Kadant Inc., outlining potential upside from current levels.
| Company | Target High | Target Low | Consensus |
|---|---|---|---|
| Hillenbrand, Inc. | 32 | 32 | 32 |
| Kadant Inc. | 410 | 275 | 342.5 |
The target consensus suggests Hillenbrand’s stock is fairly valued near its current price of $31.66, while Kadant’s target consensus at $342.5 implies a significant upside from its current $288.94 price. Overall, analysts expect moderate to strong gains.
Strengths and Weaknesses
Below is a comparison table highlighting the main strengths and weaknesses of Hillenbrand, Inc. (HI) and Kadant Inc. (KAI) based on the latest financial and operational data.
| Criterion | Hillenbrand, Inc. (HI) | Kadant Inc. (KAI) |
|---|---|---|
| Diversification | Operates in three distinct segments across multiple industries, providing some risk mitigation through diversified revenue streams. | Focused on three segments with a strong emphasis on industrial processing and material handling but less diversified than HI. |
| Profitability | Modest net profit margin at 1.95% (2025), recovering from negative margins in 2024, indicating some volatility in earnings. | Stronger profitability with net margin at 10.59% (2024), consistent positive margins, reflecting efficient operations. |
| Innovation | Moderate investment in technology with steady product offerings; however, less evident market-leading innovation. | Higher operating margins and cash flow ratios suggest effective innovation and operational efficiency. |
| Global presence | Established presence both in the US and internationally, supporting a broad market reach. | Worldwide supply of engineered systems but more niche industrial focus. |
| Market Share | Market cap at $2.23B with industrial machinery focus; moderate asset turnover (0.60), indicating stable but limited market expansion. | Larger market cap at $3.40B, higher asset turnover (0.74), showing stronger market penetration and growth potential. |
| Debt level | Higher leverage with debt-to-equity ratio of 1.12 and debt-to-assets ratio near 36%, indicating significant debt burden and financial risk. | Lower leverage with debt-to-equity ratio of 0.38 and debt-to-assets ratio around 23%, reflecting conservative debt management. |
In summary, Kadant Inc. demonstrates stronger profitability, lower financial risk, and greater operational efficiency, while Hillenbrand, Inc. benefits from diversification but carries higher debt and experiences more profit volatility. Investors should weigh Kadant’s stability against Hillenbrand’s broader market exposure.
Risk Analysis
Below is a comparative overview of key risks facing Hillenbrand, Inc. (HI) and Kadant Inc. (KAI) for the year 2025, to assist in evaluating their risk profiles.
| Metric | Hillenbrand, Inc. (HI) | Kadant Inc. (KAI) |
|---|---|---|
| Market Risk | High beta (1.40) indicates above-average sensitivity to market volatility; industrial machinery sector cyclicality adds risk. | Moderate beta (1.26) with exposure to industrial markets but stronger margins may buffer downturns. |
| Regulatory Risk | Exposure to multiple industries including pharmaceuticals and energy may increase regulatory scrutiny. | Operates in engineered systems with environmental regulations impacting flow control and material handling products. |
| Operational Risk | Complex operations across diverse segments could increase supply chain and integration risks. | Focused segments with strong operating margins reduce operational risk but reliance on industrial automation could pose challenges. |
| Environmental Risk | Some exposure in energy and wastewater treatment segments; sustainability pressures increasing. | Produces biodegradable absorbents, which may mitigate environmental risk; however, manufacturing processes remain a concern. |
| Geopolitical Risk | International operations expose HI to trade and geopolitical uncertainties. | Global supply chains and markets imply moderate geopolitical risk, but less diversified than HI. |
In 2025, Hillenbrand faces higher market and regulatory risks due to its diversified industrial exposure and higher financial leverage, reflected in its elevated beta and debt ratios. Kadant demonstrates stronger operational stability and lower debt, making environmental and operational risks more manageable. Investors should weigh HI’s higher volatility and leverage against KAI’s steadier profile when considering portfolio risk.
Which Stock to Choose?
Hillenbrand, Inc. (HI) shows a declining income with a -16% revenue growth but favorable EBIT growth of 615%. Its financial ratios reveal mixed results, with an unfavorable ROIC at -32.6% and a low ROE of 3.66%, while debt levels and dividend yield appear relatively manageable. The company holds a B+ rating.
Kadant Inc. (KAI) exhibits positive income trends with nearly 10% revenue growth and strong gross margin at 44%. Its financial ratios are mostly favorable, including a 10.1% ROIC and a solid current ratio above 2. Debt metrics and interest coverage are sound, supporting its A- rating.
For investors, Kadant’s stronger rating and overall favorable financial profile might appeal to those seeking stability and quality, whereas Hillenbrand’s mixed ratios and income volatility could be of interest to risk-tolerant investors focusing on potential turnaround opportunities. Each stock could be interpreted as fitting different investment strategies depending on risk appetite.
Disclaimer: Investment carries a risk of loss of initial capital. The past performance is not a reliable indicator of future results. Be sure to understand risks before making an investment decision.
Go Further
I encourage you to read the complete analyses of Hillenbrand, Inc. and Kadant Inc. to enhance your investment decisions: