In the dynamic industrial machinery sector, Hillenbrand, Inc. and ATS Corporation stand out as key players driving innovation and market growth. Both companies specialize in advanced manufacturing solutions, with Hillenbrand focusing on diversified process equipment and molding technologies, while ATS excels in automation and digital factory systems. This comparison will help investors identify which company offers the most compelling opportunity for portfolio growth and stability in 2026.
Table of contents
Companies Overview
I will begin the comparison between Hillenbrand and ATS Corporation by providing an overview of these two companies and their main differences.
Hillenbrand Overview
Hillenbrand, Inc. is a diversified industrial company based in Batesville, Indiana. It operates through three segments: Advanced Process Solutions, Molding Technology Solutions, and Batesville, serving industries such as plastics, automotive, medical, and funeral services. Founded in 1906, Hillenbrand focuses on manufacturing and engineering equipment and products, maintaining a significant presence in process and material handling markets globally.
ATS Corporation Overview
ATS Corporation, headquartered in Cambridge, Canada, specializes in automation solutions worldwide. The company offers comprehensive services including design, commissioning, and maintenance of automated manufacturing and assembly systems across sectors like life sciences, transportation, and energy. Founded in 1978 and renamed in 2022, ATS emphasizes software-driven factory management and integration to enhance operational efficiency and sustainable production.
Key similarities and differences
Both Hillenbrand and ATS operate within the industrial machinery sector, serving diverse markets with specialized equipment and systems. Hillenbrand has a broader product range including funeral services, while ATS focuses heavily on automation and digital solutions. ATS provides extensive post-automation services and software integration, contrasting with Hillenbrand’s traditional manufacturing and process equipment approach. Their geographic bases differ, with Hillenbrand in the US and ATS in Canada.
Income Statement Comparison
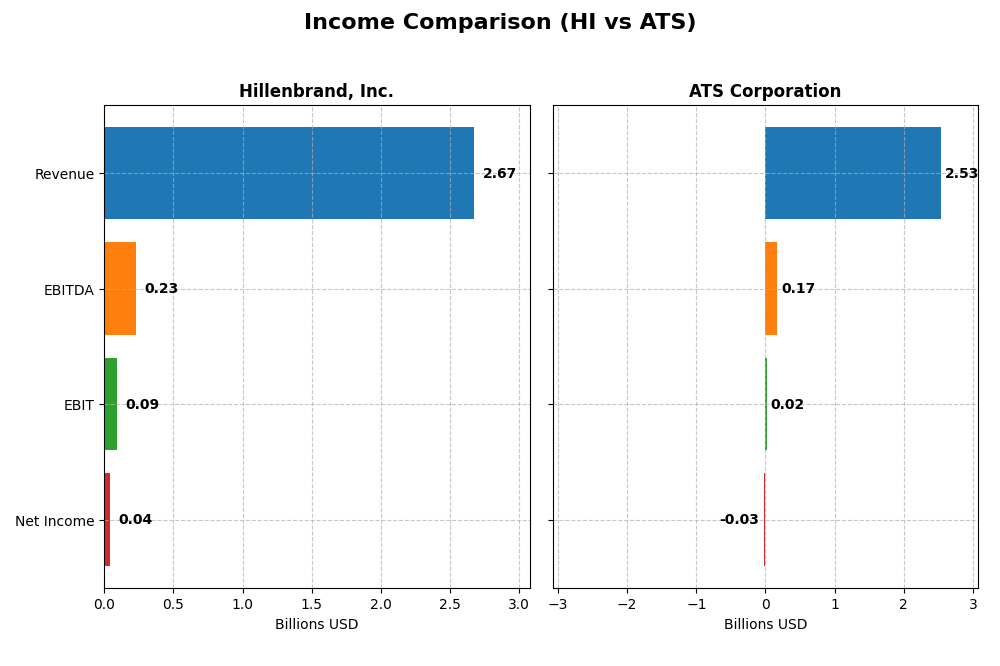
This table compares key income statement metrics from the most recent fiscal year for Hillenbrand, Inc. and ATS Corporation, providing a clear overview of their financial performance.
| Metric | Hillenbrand, Inc. (HI) | ATS Corporation (ATS) |
|---|---|---|
| Market Cap | 2.24B USD | 2.73B CAD |
| Revenue | 2.67B USD | 2.53B CAD |
| EBITDA | 231M USD | 168M CAD |
| EBIT | 92.1M USD | 15.3M CAD |
| Net Income | 43.1M USD | -28.0M CAD |
| EPS | 0.74 USD | -0.29 CAD |
| Fiscal Year | 2025 | 2025 |
Income Statement Interpretations
Hillenbrand, Inc.
Hillenbrand’s revenue increased by 19.3% over 2021-2025 but declined by 16% in 2025 alone. Net income fell sharply overall by 82.8%, though it rebounded in 2025 to $43M from a loss in 2024. Gross margin remained favorable at 33.7%, while EBIT and net margins were stable. The latest year showed improved profitability despite lower sales.
ATS Corporation
ATS saw strong revenue growth of 77.2% over five years but experienced a 16.5% decline in 2025. Net income dropped steeply by 143.8% overall and turned negative to a $28M loss in 2025. Gross margin was modestly favorable at 25.5%, but EBIT margin was low and net margin unfavorable at -1.1%. The recent year reflected deteriorating profitability and weakening margins.
Which one has the stronger fundamentals?
Hillenbrand exhibits a more balanced profile with positive gross margins and recovering net income after a dip, signaling some resilience. ATS shows impressive revenue growth historically but faces substantial net income declines and negative margins recently. Overall, Hillenbrand’s income statement metrics suggest relatively stronger fundamentals compared to ATS’s more unfavorable profitability trends.
Financial Ratios Comparison
Below is a comparison of key financial ratios for Hillenbrand, Inc. (HI) and ATS Corporation (ATS) based on their most recent fiscal year data.
| Ratios | Hillenbrand, Inc. (HI) FY 2025 | ATS Corporation (ATS) FY 2025 |
|---|---|---|
| ROE | 3.11% | -1.64% |
| ROIC | -97.93% | 0.09% |
| P/E | 44.36 | -125.28 |
| P/B | 1.38 | 2.06 |
| Current Ratio | 1.22 | 1.69 |
| Quick Ratio | 0.88 | 1.41 |
| D/E (Debt-to-Equity) | 1.16 | 1.00 |
| Debt-to-Assets | 35.86% | 36.79% |
| Interest Coverage | 1.66 | 0.09 |
| Asset Turnover | 0.60 | 0.55 |
| Fixed Asset Turnover | 7.80 | 5.66 |
| Payout Ratio | 147.10% | 0% |
| Dividend Yield | 3.32% | 0% |
Interpretation of the Ratios
Hillenbrand, Inc.
Hillenbrand shows several unfavorable ratios, including a low net margin of 1.61% and a negative return on invested capital at -97.93%, signaling operational challenges. The interest coverage ratio below 1 raises concerns about debt servicing. However, favorable metrics like a dividend yield of 3.32% and a price-to-book ratio of 1.38 provide some stability. Hillenbrand pays dividends, supported by a moderate payout ratio, but risks include its high debt and weak profitability.
ATS Corporation
ATS exhibits a mixed profile with unfavorable net margin and return on equity, indicating profitability struggles. Nonetheless, its strong current and quick ratios (1.69 and 1.41 respectively) reflect good short-term liquidity. The company does not pay dividends, likely due to negative earnings and a reinvestment focus. Favorable debt-to-equity and fixed asset turnover ratios support operational efficiency, but a poor interest coverage ratio of 0.16 signals financial pressure.
Which one has the best ratios?
Comparing both, ATS has a more balanced ratio profile with a neutral overall evaluation and strengths in liquidity and asset turnover. Hillenbrand’s ratios lean slightly unfavorable due to weak profitability and debt concerns despite its dividend payments. Thus, ATS demonstrates a relatively better ratio standing, primarily driven by liquidity and operational efficiency metrics.
Strategic Positioning
This section compares the strategic positioning of Hillenbrand, Inc. and ATS Corporation, including market position, key segments, and exposure to technological disruption:
Hillenbrand, Inc.
- Mid-sized industrial machinery player with $2.2B market cap, facing typical sector competition.
- Diversified segments: Advanced Process Solutions, Molding Technology, and Batesville funeral products.
- No explicit mention of tech disruption exposure in provided data.
ATS Corporation
- Larger industrial machinery firm with $2.7B market cap, operating under competitive pressures.
- Focus on automation solutions spanning design, commissioning, and post-sale services globally.
- Offers connected factory floor management and digital solutions, indicating some tech integration.
Hillenbrand, Inc. vs ATS Corporation Positioning
Hillenbrand pursues a diversified industrial approach across multiple segments, including funeral products, while ATS concentrates on automation and digital manufacturing solutions. Hillenbrand’s broader scope contrasts with ATS’s focused technological integration and service offerings.
Which has the best competitive advantage?
Both companies are currently destroying value with declining ROIC trends and ROIC below WACC, indicating very unfavorable competitive advantages and challenged profitability over 2021-2025.
Stock Comparison
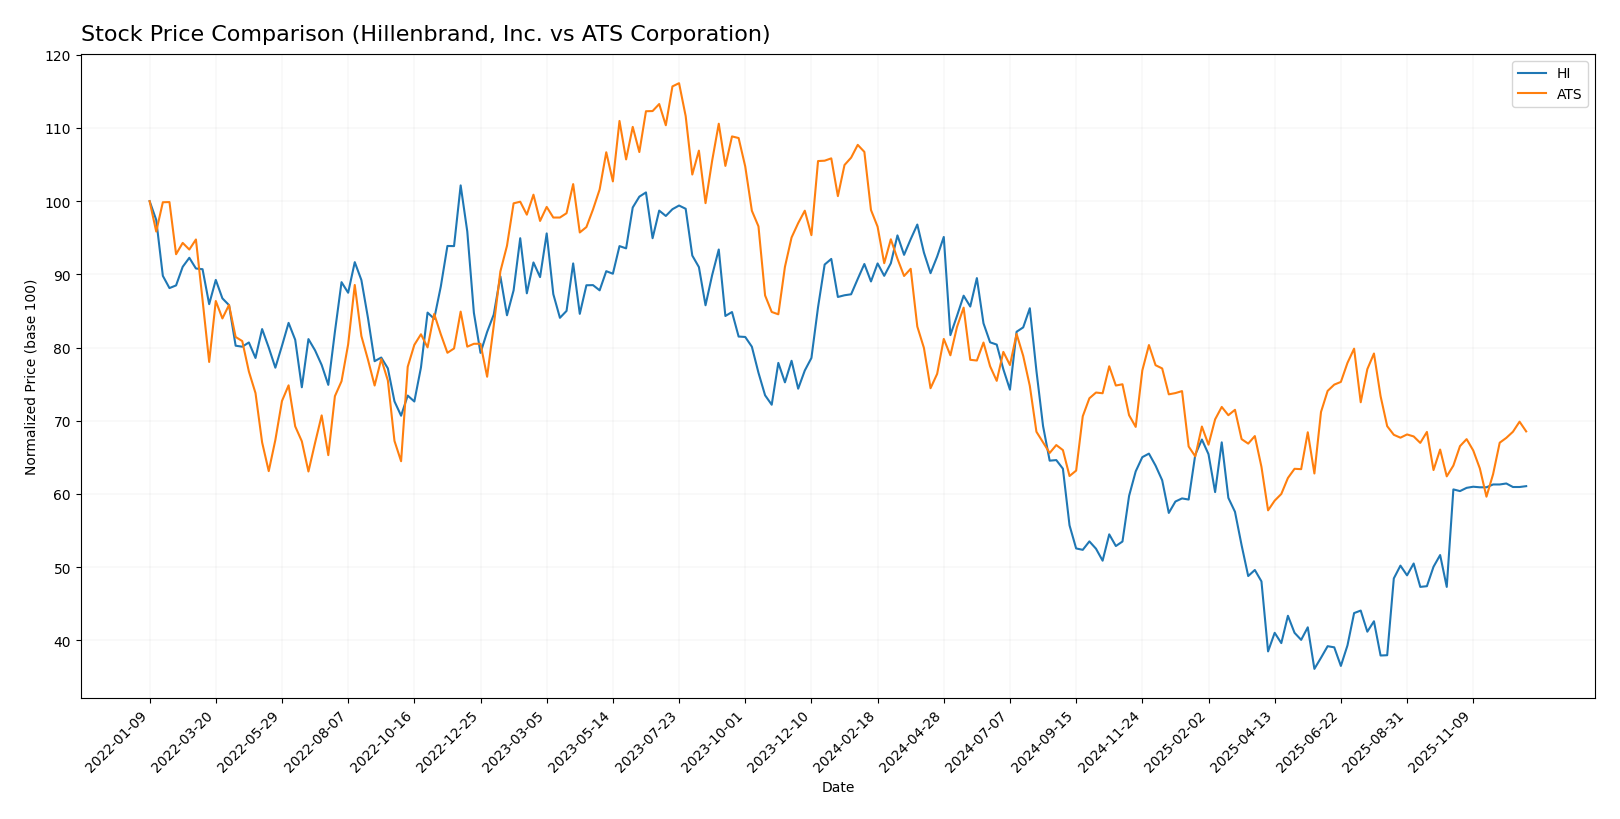
The past year saw both Hillenbrand, Inc. and ATS Corporation experience notable declines with accelerating bearish trends, although recent months show emerging positive momentum in their stock prices.
Trend Analysis
Hillenbrand, Inc. displayed a -31.42% price change over the past 12 months, indicating a bearish trend with accelerating decline and a high volatility of 8.95. The stock recently gained 0.73%, reflecting a slight recovery.
ATS Corporation also posted a bearish trend with a -30.62% price change over 12 months and accelerating downward momentum, but with lower volatility at 3.41. The recent 7.31% price increase suggests stronger short-term positive movement.
Comparing both, ATS Corporation delivered a higher recent market performance with a 7.31% gain versus Hillenbrand’s 0.73%, despite similar long-term declines and bearish trends.
Target Prices
Analysts present a clear and confident target consensus for both Hillenbrand, Inc. and ATS Corporation.
| Company | Target High | Target Low | Consensus |
|---|---|---|---|
| Hillenbrand, Inc. | 32 | 32 | 32 |
| ATS Corporation | 34 | 34 | 34 |
The target prices suggest moderate upside potential for both stocks compared to their current prices of $31.72 for Hillenbrand and $27.89 for ATS, indicating analysts expect cautious but positive performance ahead.
Analyst Opinions Comparison
This section compares analysts’ ratings and grades for Hillenbrand, Inc. and ATS Corporation:
Rating Comparison
Hillenbrand, Inc. Rating
- Rating: C+ with a very favorable status.
- Discounted Cash Flow Score: 4, indicating favorable outlook.
- ROE Score: 2, considered moderate in efficiency.
- ROA Score: 2, moderate asset utilization.
- Debt To Equity Score: 1, very unfavorable financial risk.
- Overall Score: 2, moderate overall financial standing.
ATS Corporation Rating
- Rating: C with a very favorable status.
- Discounted Cash Flow Score: 3, showing moderate outlook.
- ROE Score: 1, very unfavorable efficiency.
- ROA Score: 1, very unfavorable asset utilization.
- Debt To Equity Score: 1, very unfavorable financial risk.
- Overall Score: 2, moderate overall financial standing.
Which one is the best rated?
Based on the provided data, Hillenbrand, Inc. holds a slightly better rating (C+) compared to ATS Corporation (C), supported by a higher discounted cash flow score and stronger return metrics, despite both having moderate overall scores.
Scores Comparison
Here is a comparison of the financial health scores for Hillenbrand, Inc. and ATS Corporation:
Hillenbrand, Inc. Scores
- Altman Z-Score: 1.49, indicating financial distress zone risk
- Piotroski Score: 6, reflecting average financial strength
ATS Corporation Scores
- Altman Z-Score: 1.65, also in the financial distress zone
- Piotroski Score: 3, indicating very weak financial strength
Which company has the best scores?
Based on the provided data, Hillenbrand, Inc. has a lower Altman Z-Score risk and a stronger Piotroski Score compared to ATS Corporation. Hillenbrand shows relatively better financial strength, while both remain in distress zones for bankruptcy risk.
Grades Comparison
The recent grading trends and ratings for Hillenbrand, Inc. and ATS Corporation are as follows:
Hillenbrand, Inc. Grades
This table summarizes recent grades and actions by recognized grading companies for Hillenbrand, Inc.:
| Grading Company | Action | New Grade | Date |
|---|---|---|---|
| DA Davidson | Maintain | Neutral | 2025-11-20 |
| DA Davidson | Maintain | Neutral | 2025-10-16 |
| CJS Securities | Downgrade | Market Perform | 2025-10-16 |
| Keybanc | Downgrade | Sector Weight | 2025-05-08 |
| DA Davidson | Maintain | Neutral | 2025-05-01 |
| DA Davidson | Maintain | Neutral | 2024-11-15 |
| Keybanc | Maintain | Overweight | 2024-11-14 |
| DA Davidson | Downgrade | Neutral | 2024-08-12 |
| DA Davidson | Maintain | Buy | 2021-02-08 |
| DA Davidson | Maintain | Buy | 2021-02-07 |
Overall, Hillenbrand, Inc. shows predominantly neutral grades with some recent downgrades from buy and overweight ratings, reflecting a cautious stance by analysts.
ATS Corporation Grades
This table summarizes recent grades and actions by recognized grading companies for ATS Corporation:
| Grading Company | Action | New Grade | Date |
|---|---|---|---|
| JP Morgan | Maintain | Neutral | 2024-08-13 |
| Goldman Sachs | Maintain | Sell | 2024-08-13 |
| JP Morgan | Maintain | Neutral | 2024-05-24 |
The grades for ATS Corporation remain steady with neutral and sell ratings, indicating a cautious to negative outlook from key analysts.
Which company has the best grades?
Hillenbrand, Inc. has received generally more favorable grades than ATS Corporation, with mostly neutral ratings and some previous buy or overweight grades. ATS’s consistent neutral to sell ratings suggest more risk, potentially impacting investor confidence and portfolio allocation decisions.
Strengths and Weaknesses
Below is a comparison table outlining the key strengths and weaknesses of Hillenbrand, Inc. (HI) and ATS Corporation (ATS) based on the most recent financial and operational data.
| Criterion | Hillenbrand, Inc. (HI) | ATS Corporation (ATS) |
|---|---|---|
| Diversification | Moderate diversification: Two main segments, Process Equipment Group (~$2.07B) and Milacron (~$604M) in 2025 | Limited data on product segmentation, focus on fewer segments |
| Profitability | Low profitability: ROIC -97.9%, net margin 1.61%, declining ROIC trend, value destroying | Very low profitability: ROIC 0.09%, negative net margin -1.11%, value destroying |
| Innovation | Moderate fixed asset turnover (7.8 favorable), but declining overall efficiency | Fixed asset turnover lower than HI (5.66 favorable), innovation status unclear |
| Global presence | Strong global footprint supported by Process Equipment Group | Global presence less documented, likely smaller scale |
| Market Share | Established in process equipment and specialized equipment markets | Smaller market position, competitive pressure likely higher |
Key takeaways: Both companies are currently experiencing declining profitability and are value destroyers based on ROIC vs WACC analysis. Hillenbrand shows better diversification and asset efficiency, while ATS has a neutral balance in financial ratios but struggles with profitability. Caution is advised when considering investment in either company due to unfavorable financial trends.
Risk Analysis
Below is a comparative risk assessment of Hillenbrand, Inc. (HI) and ATS Corporation (ATS) for the year 2025, highlighting key financial and operational risks.
| Metric | Hillenbrand, Inc. (HI) | ATS Corporation (ATS) |
|---|---|---|
| Market Risk | Beta 1.40 (higher volatility) | Beta 1.27 (moderate volatility) |
| Debt level | Debt/Equity 1.16 (unfavorable) | Debt/Equity 1.0 (neutral) |
| Regulatory Risk | Moderate (US & global industrial regulations) | Moderate (Canada & global automation standards) |
| Operational Risk | Diversified segments; moderate operational complexity | Complex automation solutions; higher operational risk |
| Environmental Risk | Moderate (industrial equipment manufacturing) | Moderate (automation and manufacturing processes) |
| Geopolitical Risk | US-based with international exposure | Canadian HQ with global markets |
The most impactful risks are financial distress indicators: both firms fall into the Altman Z-Score distress zone, signaling elevated bankruptcy risk. Hillenbrand’s high debt-to-equity and weak interest coverage ratio increase financial vulnerability, while ATS shows weak profitability and a very weak Piotroski score, suggesting operational and financial challenges. Investors should monitor debt management and profitability trends closely.
Which Stock to Choose?
Hillenbrand, Inc. shows a mixed income evolution with a 15.99% revenue decline in 2025 but strong EBIT and net margin growth. Its financial ratios are slightly unfavorable overall, with low ROIC and high debt levels. The company’s rating is very favorable (C+), though financial risk indicators are moderate to unfavorable.
ATS Corporation experiences a revenue decrease of 16.47% in 2025, with mostly unfavorable income growth metrics and a neutral overall financial ratio evaluation. Its debt and profitability ratios are weak, reflected in a very favorable company rating (C) but with concerns in ROE and ROA scores.
Investors focused on stability might view Hillenbrand’s slightly unfavorable ratios and improving income margins as cautiously optimistic, while risk-tolerant investors seeking potential turnaround plays could consider ATS’s neutral ratio stance despite weak profitability. Both companies face value destruction as indicated by declining ROIC and challenging financial health scores.
Disclaimer: Investment carries a risk of loss of initial capital. The past performance is not a reliable indicator of future results. Be sure to understand risks before making an investment decision.
Go Further
I encourage you to read the complete analyses of Hillenbrand, Inc. and ATS Corporation to enhance your investment decisions: