Hewlett Packard Enterprise Company (HPE) and Zebra Technologies Corporation (ZBRA) are two prominent players in the communication equipment industry, each driving innovation in enterprise technology solutions. HPE focuses on data center infrastructure and intelligent edge computing, while Zebra excels in asset intelligence and tracking technologies. Their overlapping markets and distinct innovation strategies make this comparison crucial for investors seeking growth and stability. Let’s explore which company offers the most compelling investment opportunity.
Table of contents
Companies Overview
I will begin the comparison between Hewlett Packard Enterprise Company and Zebra Technologies Corporation by providing an overview of these two companies and their main differences.
Hewlett Packard Enterprise Company Overview
Hewlett Packard Enterprise Company focuses on delivering technology solutions that enable seamless data capture, analysis, and action across global markets. It offers a broad portfolio including servers, storage, networking hardware, software, and professional services. HPE serves commercial and large enterprises through diverse partners and emphasizes flexible technology deployment models, with headquarters in Houston, Texas.
Zebra Technologies Corporation Overview
Zebra Technologies Corporation provides enterprise asset intelligence solutions globally, specializing in automatic identification and data capture technologies. Its offerings include printers, RFID solutions, barcode scanners, rugged mobile computing devices, and software for real-time location and workforce management. Zebra serves various industries such as retail, healthcare, and logistics, operating through direct sales and channel partners from its base in Lincolnshire, Illinois.
Key similarities and differences
Both companies operate in the technology sector with a focus on communication equipment and serve enterprise clients worldwide. HPE emphasizes comprehensive IT infrastructure solutions and flexible consumption models, while Zebra concentrates on asset intelligence and data capture hardware combined with software services. HPE employs a significantly larger workforce and has a broader product range, whereas Zebra specializes more narrowly in identification and mobility solutions.
Income Statement Comparison
Below is a comparison of key income statement metrics for Hewlett Packard Enterprise Company and Zebra Technologies Corporation for their most recent fiscal years.
| Metric | Hewlett Packard Enterprise Company | Zebra Technologies Corporation |
|---|---|---|
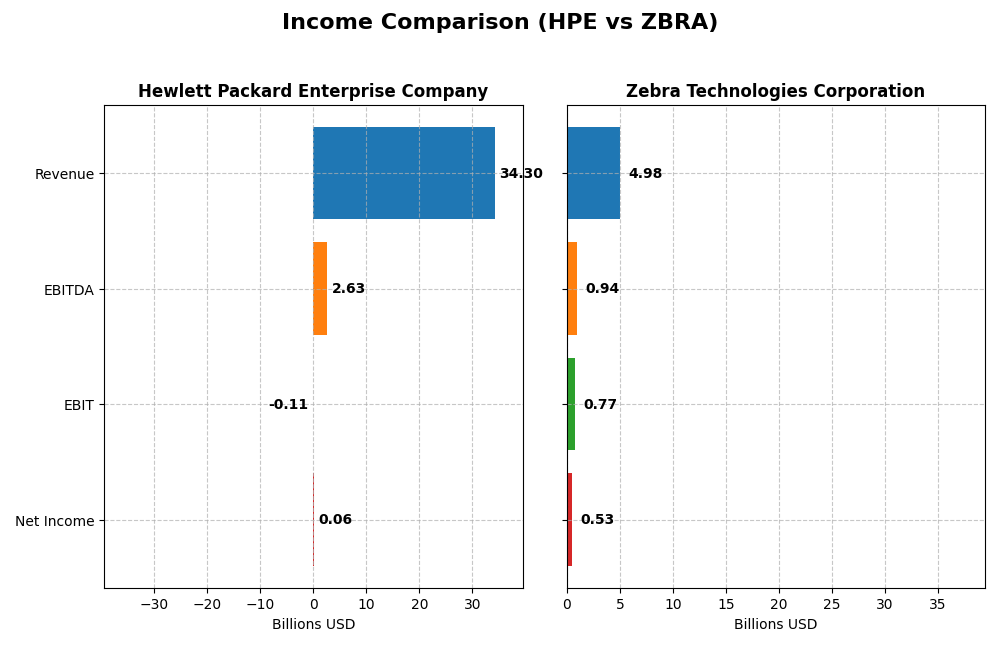
| Market Cap | 29.5B | 13.2B |
| Revenue | 34.3B | 5.0B |
| EBITDA | 2.6B | 937M |
| EBIT | -110M | 765M |
| Net Income | 57M | 528M |
| EPS | -0.045 | 10.25 |
| Fiscal Year | 2025 | 2024 |
Income Statement Interpretations
Hewlett Packard Enterprise Company
HPE’s revenue showed a favorable growth trend of 23.08% over 2021-2025, reaching $34.3B in 2025, but net income declined sharply by 98.34%, with a marginal net income of $57M in 2025. Gross margin remained stable at 28.77%, yet EBIT margin dropped to a negative -0.32%. The latest year saw revenue growth of 14.06% but unfavorable declines in EBIT and net margin, signaling margin pressure.
Zebra Technologies Corporation
Zebra Technologies recorded steady revenue growth of 11.98% from 2020 to 2024, reaching $5B in 2024, with net income moderately increasing by 4.76% to $528M. Margins were robust and improved, with a gross margin of 48.44%, EBIT margin of 15.36%, and net margin of 10.6%. The most recent year showed favorable growth across revenue, gross profit, EBIT, net margin, and EPS, highlighting operational strength.
Which one has the stronger fundamentals?
Zebra Technologies demonstrates stronger fundamentals with mostly favorable margin metrics and consistent income growth, reflecting operational efficiency and profitability. Conversely, HPE faces significant challenges with declining net income and EBIT margins despite revenue gains, indicating pressure on profitability. Overall, Zebra’s income statement portrays greater financial stability and growth momentum.
Financial Ratios Comparison
The following table compares the most recent key financial ratios for Hewlett Packard Enterprise Company (HPE) and Zebra Technologies Corporation (ZBRA) based on their latest fiscal year data.
| Ratios | Hewlett Packard Enterprise Company (2025) | Zebra Technologies Corporation (2024) |
|---|---|---|
| ROE | 0.23% | 14.72% |
| ROIC | -0.59% | 9.67% |
| P/E | 567.2 | 37.67 |
| P/B | 1.31 | 5.55 |
| Current Ratio | 1.01 | 1.43 |
| Quick Ratio | 0.76 | 1.03 |
| D/E (Debt-to-Equity) | 0.91 | 0.66 |
| Debt-to-Assets | 29.5% | 29.6% |
| Interest Coverage | 9.39 | 5.75 |
| Asset Turnover | 0.45 | 0.63 |
| Fixed Asset Turnover | 5.71 | 10.55 |
| Payout Ratio | 14.0% | 0% |
| Dividend Yield | 2.46% | 0% |
Interpretation of the Ratios
Hewlett Packard Enterprise Company
HPE shows a mixed ratio profile with significant weaknesses: net margin at 0.17%, ROE at 0.23%, and ROIC negative at -0.59%, signaling profitability and efficiency challenges. The company maintains a favorable WACC at 6.92% and a dividend yield of 2.46%, supported by a stable payout. However, concerns arise from a high PE of 567.23 and negative interest coverage, suggesting financial strain.
Zebra Technologies Corporation
Zebra presents stronger profitability ratios, with a net margin of 10.6%, and neutral to favorable returns (ROE 14.72%, ROIC 9.67%). Liquidity and leverage ratios are mostly favorable, including interest coverage at 5.93 and quick ratio at 1.03. Zebra does not pay dividends, likely reflecting reinvestment priorities or growth focus, with no dividend yield reported.
Which one has the best ratios?
Zebra Technologies Corporation holds a more favorable overall ratio profile, with better profitability, liquidity, and interest coverage metrics. HPE’s ratios reveal more weaknesses, particularly in profitability and financial risk, despite some favorable points like dividend yield and WACC. Zebra’s lack of dividends contrasts with HPE’s modest yield but aligns with its stronger operational metrics.
Strategic Positioning
This section compares the strategic positioning of Hewlett Packard Enterprise Company (HPE) and Zebra Technologies Corporation (ZBRA) across market position, key segments, and exposure to technological disruption:
HPE
- Large market cap with high competitive pressure in communication equipment sector.
- Diverse segments: servers, hybrid cloud, networking, financial services, intelligent edge.
- Invests in cloud, edge computing, and real-time analytics partnerships for innovation.
ZBRA
- Smaller market cap but focused on enterprise asset intelligence with moderate competition.
- Concentrated in asset intelligence tracking and enterprise visibility & mobility segments.
- Focuses on automatic identification, data capture, and cloud-based software solutions.
HPE vs ZBRA Positioning
HPE adopts a diversified approach with multiple technology segments including servers and cloud, offering broad exposure but also complexity. ZBRA concentrates on asset intelligence and mobility, potentially enabling focused innovation but less diversification.
Which has the best competitive advantage?
Both companies show declining ROIC trends and are shedding value relative to their cost of capital, resulting in a very unfavorable moat status and indicating weak competitive advantages based on the MOAT evaluation.
Stock Comparison
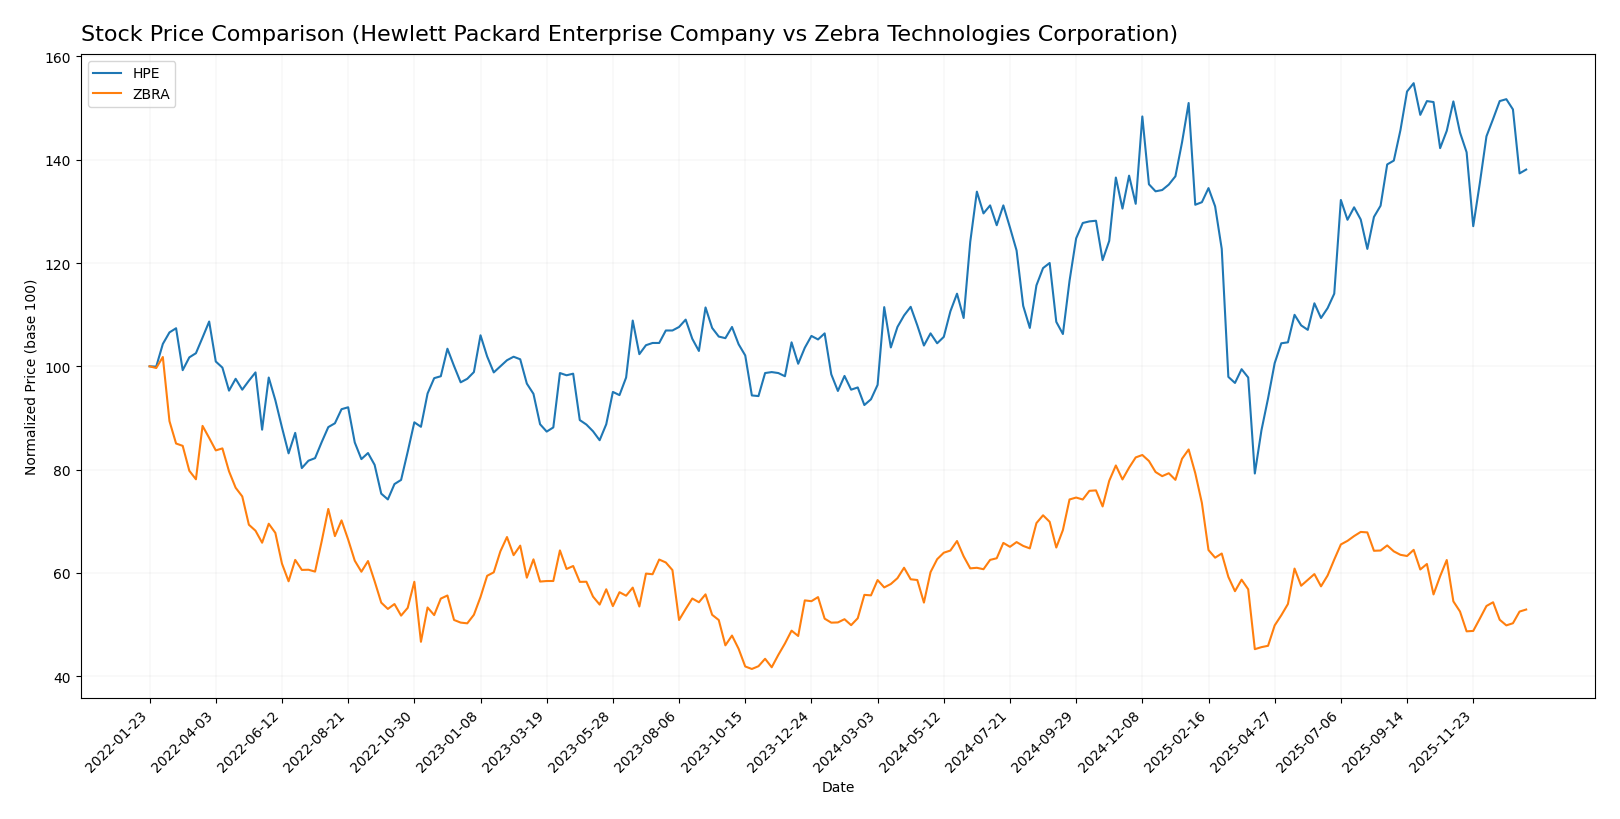
The past year shows notable divergence in stock price movements, with Hewlett Packard Enterprise Company exhibiting a strong bullish trend despite recent deceleration, while Zebra Technologies Corporation faces a bearish trend marked by high volatility and accelerating decline.
Trend Analysis
Hewlett Packard Enterprise Company’s stock rose 47.52% over the past year, reflecting a bullish trend with decelerating momentum; it ranged between 12.79 and 24.99, with moderate volatility (std deviation 2.81).
Zebra Technologies Corporation’s stock declined 4.93% in the same period, indicating a bearish trend with accelerating downward movement, large price swings (std deviation 46.74), and a high of 414.61 and low of 223.49.
Comparing both, Hewlett Packard Enterprise Company delivered the highest market performance, showing a clear bullish gain versus Zebra Technologies Corporation’s bearish loss.
Target Prices
Here is the current consensus target price outlook from verified analysts for these technology companies:
| Company | Target High | Target Low | Consensus |
|---|---|---|---|
| Hewlett Packard Enterprise Company | 31 | 21 | 27.25 |
| Zebra Technologies Corporation | 368 | 291 | 329.5 |
Analysts expect both stocks to appreciate, with Hewlett Packard Enterprise’s consensus target of 27.25 exceeding the current price of 22.30. Zebra Technologies’ consensus target of 329.5 also suggests significant upside from its current 261.44.
Analyst Opinions Comparison
This section compares analysts’ ratings and grades for Hewlett Packard Enterprise Company (HPE) and Zebra Technologies Corporation (ZBRA):
Rating Comparison
HPE Rating
- Rating: B- indicating a very favorable status.
- Discounted Cash Flow Score: 4, favorable assessment of future cash flows.
- ROE Score: 2, moderate efficiency in generating profit from equity.
- ROA Score: 2, moderate effectiveness in asset utilization.
- Debt To Equity Score: 1, very unfavorable financial leverage position.
- Overall Score: 2, moderate overall financial standing.
ZBRA Rating
- Rating: B with a very favorable status.
- Discounted Cash Flow Score: 3, moderate assessment of future cash flows.
- ROE Score: 4, favorable efficiency in generating profit from equity.
- ROA Score: 4, favorable effectiveness in asset utilization.
- Debt To Equity Score: 1, very unfavorable financial leverage position.
- Overall Score: 3, moderate overall financial standing.
Which one is the best rated?
ZBRA holds a higher overall rating (B) and superior scores in ROE and ROA compared to HPE’s B- rating and moderate scores. Both companies share an unfavorable debt-to-equity score, but ZBRA is generally better rated based on the provided data.
Scores Comparison
Here is a comparison of the financial scores for Hewlett Packard Enterprise Company and Zebra Technologies Corporation:
HPE Scores
- Altman Z-Score: 0.75, in distress zone indicating high bankruptcy risk.
- Piotroski Score: 5, reflecting average financial strength.
ZBRA Scores
- Altman Z-Score: 3.86, in safe zone indicating low bankruptcy risk.
- Piotroski Score: 7, reflecting strong financial strength.
Which company has the best scores?
Zebra Technologies shows stronger financial health with a safe zone Altman Z-Score and a strong Piotroski Score, while HPE is in distress and has only average strength.
Grades Comparison
Here is a comparison of the latest reliable grades for Hewlett Packard Enterprise Company and Zebra Technologies Corporation:
Hewlett Packard Enterprise Company Grades
The following table summarizes recent grades and rating actions by established firms for HPE:
| Grading Company | Action | New Grade | Date |
|---|---|---|---|
| Argus Research | Maintain | Buy | 2025-12-10 |
| BWG Global | Upgrade | Positive | 2025-11-24 |
| Morgan Stanley | Downgrade | Equal Weight | 2025-11-17 |
| Barclays | Maintain | Overweight | 2025-10-16 |
| Goldman Sachs | Maintain | Neutral | 2025-10-16 |
| UBS | Maintain | Neutral | 2025-10-16 |
| Citigroup | Maintain | Buy | 2025-10-06 |
| Goldman Sachs | Maintain | Neutral | 2025-10-02 |
| Citigroup | Maintain | Buy | 2025-09-04 |
| UBS | Maintain | Neutral | 2025-09-04 |
HPE’s grades show a mix of Buy, Neutral, and Overweight ratings with a recent slight downgrade by Morgan Stanley balanced by upgrades and stable Buy ratings from other firms.
Zebra Technologies Corporation Grades
The table below details recent grades and actions by recognized grading firms for ZBRA:
| Grading Company | Action | New Grade | Date |
|---|---|---|---|
| Barclays | Maintain | Overweight | 2026-01-12 |
| Truist Securities | Maintain | Hold | 2025-12-18 |
| Truist Securities | Maintain | Hold | 2025-10-29 |
| Barclays | Maintain | Overweight | 2025-10-29 |
| Citigroup | Maintain | Neutral | 2025-10-29 |
| Citigroup | Maintain | Neutral | 2025-10-09 |
| Truist Securities | Maintain | Hold | 2025-10-08 |
| Morgan Stanley | Maintain | Equal Weight | 2025-08-06 |
| Needham | Maintain | Buy | 2025-08-06 |
| Truist Securities | Maintain | Hold | 2025-08-06 |
Zebra’s ratings mainly oscillate between Hold, Neutral, and Overweight, with a few Buy ratings, showing a stable but cautious analyst outlook.
Which company has the best grades?
Zebra Technologies Corporation holds a stronger consensus with more Buy ratings and an overall “Buy” consensus, compared to HPE’s “Hold” consensus dominated by Neutral and Hold ratings. This suggests Zebra is currently viewed more favorably by analysts, potentially indicating higher confidence or growth expectations from investors.
Strengths and Weaknesses
Below is a comparative overview of the strengths and weaknesses of Hewlett Packard Enterprise Company (HPE) and Zebra Technologies Corporation (ZBRA) based on recent performance metrics and financial data.
| Criterion | Hewlett Packard Enterprise Company (HPE) | Zebra Technologies Corporation (ZBRA) |
|---|---|---|
| Diversification | Strong diversification in hybrid cloud, networking, and server segments with $17.7B in servers and $6.8B in networking (2025). | Focused product lines in Asset Intelligence Tracking and Enterprise Visibility Mobility with $1.65B and $3.33B revenue respectively (2024). |
| Profitability | Low profitability with negative ROIC (-0.59%) and net margin at 0.17%, indicating value destruction. | Higher profitability with net margin of 10.6%, ROIC at 9.67%, though slightly unfavorable WACC (10.66%). |
| Innovation | Moderate innovation with investments in Hybrid Cloud and Intelligent Edge segments, though declining ROIC trend. | Strong innovation supported by favorable asset turnover and interest coverage ratios. |
| Global presence | Large global presence supported by diverse hardware and services. | Global reach in specialized tracking and mobility solutions, growing revenues steadily. |
| Market Share | Market share challenged by declining ROIC and high P/E ratio (567.23) signaling overvaluation risk. | Solid market position with moderate P/E (37.67), though elevated price-to-book (5.55) suggests premium valuation. |
In summary, HPE offers broad diversification but struggles with profitability and value creation, reflected in its declining financial metrics. Zebra Technologies presents a more focused portfolio with stronger profitability and operational efficiency, making it a comparatively more attractive option for investors prioritizing value and innovation.
Risk Analysis
The following table summarizes key risks for Hewlett Packard Enterprise Company (HPE) and Zebra Technologies Corporation (ZBRA) based on their latest financial and operational data.
| Metric | Hewlett Packard Enterprise Company (HPE) | Zebra Technologies Corporation (ZBRA) |
|---|---|---|
| Market Risk | Beta 1.33 indicates moderate volatility; high P/E (567) suggests valuation risk | Beta 1.68 shows higher volatility; high P/E (37.7) but more reasonable than HPE |
| Debt level | Debt-to-assets 29.5%, interest coverage negative (-0.63), debt/equity neutral (0.91) | Debt-to-assets 29.6%, strong interest coverage (5.93), debt/equity moderate (0.66) |
| Regulatory Risk | Moderate, operates globally with exposure to tech sector regulations | Moderate, similar global exposure with emphasis on data capture and RFID tech |
| Operational Risk | Unfavorable ROIC (-59%), net margin very low (0.17%), average liquidity ratios | Favorable net margin (10.6%), solid fixed asset turnover, good liquidity ratios |
| Environmental Risk | Standard industry risks; no recent issues reported | Industry-related environmental compliance obligations, no major incidents |
| Geopolitical Risk | Global footprint involves exposure to trade tensions, supply chain disruptions | Similar global risks; supply chain and logistics critical to operations |
In summary, HPE faces significant operational and financial risks, including weak profitability and negative interest coverage, which heightens its default risk despite moderate debt levels. Zebra Technologies exhibits stronger financial health and operational efficiency but is subject to higher market volatility. Investors should weigh HPE’s financial distress signs against Zebra’s elevated market risk and valuation.
Which Stock to Choose?
Hewlett Packard Enterprise Company (HPE) shows a mixed income evolution with revenue growth but significant declines in net margin and EPS over 2021–2025. Its financial ratios are slightly unfavorable, with low profitability, moderate debt, and a strong dividend yield. The rating is very favorable overall, but the company is value-destroying with a very unfavorable MOAT.
Zebra Technologies Corporation (ZBRA) displays consistent income growth, favorable gross and EBIT margins, and solid profitability metrics. Its financial ratios lean slightly favorable, supported by good asset turnover and interest coverage, though valuation ratios are less attractive. The rating is very favorable, yet the MOAT assessment also signals value destruction with declining ROIC.
For investors, the choice might depend on risk tolerance and investment style: those prioritizing income statement strength and profitability could find ZBRA more appealing; meanwhile, investors focusing on valuation metrics and dividend yield might see potential in HPE. Both companies show challenges in sustaining value creation, suggesting prudence in assessment.
Disclaimer: Investment carries a risk of loss of initial capital. The past performance is not a reliable indicator of future results. Be sure to understand risks before making an investment decision.
Go Further
I encourage you to read the complete analyses of Hewlett Packard Enterprise Company and Zebra Technologies Corporation to enhance your investment decisions: