Motorola Solutions, Inc. (MSI) and Hewlett Packard Enterprise Company (HPE) are two prominent players in the communication equipment industry, each driving innovation through advanced technology solutions. While MSI focuses on mission-critical communications and public safety systems, HPE emphasizes data-driven IT infrastructure and intelligent edge computing. Given their market overlap and distinct innovation strategies, this analysis will help you identify which company offers the most compelling investment opportunity in 2026.
Table of contents
Companies Overview
I will begin the comparison between Motorola Solutions, Inc. and Hewlett Packard Enterprise Company by providing an overview of these two companies and their main differences.
Motorola Solutions Overview
Motorola Solutions, Inc. focuses on mission-critical communications and analytics, serving government, public safety, and commercial customers. Operating primarily in the US, UK, Canada, and internationally, it delivers products and systems integration, along with software and services. Its offerings include land mobile radio communications, video security devices, and command center software, emphasizing private communications networks and mobile workforce management.
Hewlett Packard Enterprise Overview
Hewlett Packard Enterprise Company provides data capture, analysis, and action solutions worldwide, including the Americas, EMEA, APAC, and Japan. Its portfolio covers general purpose and workload-optimized servers, storage solutions, networking hardware and software through its Aruba products, and various IT consumption and financing models. It serves commercial and large enterprises through a broad partner ecosystem and invests in communications and media solutions.
Key similarities and differences
Both companies operate in the communication equipment industry, targeting enterprise and government sectors with technology solutions. Motorola Solutions emphasizes mission-critical communications and public safety systems, while Hewlett Packard Enterprise offers a broader IT infrastructure and networking portfolio, including servers, storage, and edge computing. HPE has a larger workforce and more diversified geographic reach compared to Motorola Solutions’ focused product segments.
Income Statement Comparison
The table below compares key income statement metrics for Motorola Solutions, Inc. and Hewlett Packard Enterprise Company based on their most recent fiscal year data.

| Metric | Motorola Solutions, Inc. (MSI) | Hewlett Packard Enterprise Company (HPE) |
|---|---|---|
| Market Cap | 65.1B | 29.5B |
| Revenue | 10.8B | 34.3B |
| EBITDA | 2.60B | 2.63B |
| EBIT | 2.27B | -110M |
| Net Income | 1.58B | 57M |
| EPS | 9.45 | -0.045 |
| Fiscal Year | 2024 | 2025 |
Income Statement Interpretations
Motorola Solutions, Inc.
Motorola Solutions, Inc. demonstrated consistent revenue growth from 2020 to 2024, reaching $10.8B in 2024, with net income also rising to $1.58B. Margins were generally stable and favorable, with a gross margin around 51% and net margin near 15%. However, in 2024, EBIT and net margin declined slightly, reflecting a slowdown despite revenue growth.
Hewlett Packard Enterprise Company
HPE’s revenue grew steadily from $27.9B in 2021 to $34.3B in 2025, but net income showed volatility, collapsing to a $59M net loss in 2025. The gross margin remained favorable at about 29%, yet EBIT margin turned negative in the latest year. The company faced significant margin compression and negative EPS growth in 2025, indicating operational challenges.
Which one has the stronger fundamentals?
Motorola Solutions exhibits stronger fundamentals with favorable overall income statement metrics, including consistent revenue and net income growth, healthy margins, and controlled interest expenses. Conversely, HPE shows mixed results, with revenue growth overshadowed by deteriorating profitability and negative net margin trends. Motorola’s income statement reflects more stability and positive growth compared to HPE’s unfavorable earnings performance.
Financial Ratios Comparison
This table compares the most recent financial ratios for Motorola Solutions, Inc. (MSI) and Hewlett Packard Enterprise Company (HPE) as of the end of their respective latest fiscal years.
| Ratios | Motorola Solutions, Inc. (2024) | Hewlett Packard Enterprise Company (2025) |
|---|---|---|
| ROE | 92.60% | 0.23% |
| ROIC | 21.59% | -0.59% |
| P/E | 48.89 | 567.23 |
| P/B | 45.27 | 1.31 |
| Current Ratio | 1.28 | 1.01 |
| Quick Ratio | 1.13 | 0.76 |
| D/E (Debt-to-Equity) | 3.85 | 0.91 |
| Debt-to-Assets | 44.89% | 29.46% |
| Interest Coverage | 9.11 | 9.39 |
| Asset Turnover | 0.74 | 0.45 |
| Fixed Asset Turnover | 6.97 | 5.71 |
| Payout ratio | 41.47% | 1396.49% |
| Dividend yield | 0.85% | 2.46% |
Interpretation of the Ratios
Motorola Solutions, Inc.
Motorola Solutions exhibits a slightly favorable ratio profile with strong profitability indicators, including a high ROE of 92.6% and robust ROIC at 21.59%. Liquidity ratios are mostly neutral to favorable, but leverage remains a concern with a D/E ratio of 3.85. The dividend yield is relatively low at 0.85%, suggesting modest shareholder returns supported by stable dividend payments and cautious buybacks.
Hewlett Packard Enterprise Company
HPE’s ratios are slightly unfavorable, reflecting weak profitability with a net margin of 0.17% and negative ROIC at -0.59%. Liquidity and solvency metrics are mixed; the D/E ratio is moderate at 0.91, but interest coverage is negative, signaling financial stress. Despite this, HPE offers a higher dividend yield of 2.46%, indicating shareholder returns are maintained even amid operational challenges.
Which one has the best ratios?
Motorola Solutions shows a stronger financial position with superior profitability and better coverage ratios, though it carries higher leverage. HPE struggles with profitability and interest coverage but provides a more attractive dividend yield. Overall, Motorola Solutions’ ratios appear more robust, while HPE’s are challenged but offer higher immediate shareholder returns.
Strategic Positioning
This section compares the strategic positioning of Motorola Solutions, Inc. and Hewlett Packard Enterprise Company across market position, key segments, and exposure to technological disruption:
Motorola Solutions, Inc.
- Leading provider in communication equipment with moderate beta; faces competition in public safety and commercial sectors.
- Focus on mission-critical communications, public safety, video security, and software services driving growth.
- Moderate exposure through software and cybersecurity services supporting mission-critical communications infrastructure.
Hewlett Packard Enterprise Company
- Mid-sized player with higher beta; competes broadly in IT infrastructure and edge computing markets.
- Diverse segments including servers, networking, hybrid cloud, intelligent edge, and financial services.
- High exposure with investments in hybrid cloud, intelligent edge, and real-time analytics partnerships.
Motorola Solutions, Inc. vs Hewlett Packard Enterprise Company Positioning
Motorola Solutions emphasizes mission-critical communications and security, offering a focused portfolio primarily targeting government and commercial customers. Hewlett Packard Enterprise operates a more diversified business across IT infrastructure, cloud, and networking, servicing a broader enterprise base with varied technology solutions.
Which has the best competitive advantage?
Motorola Solutions demonstrates a very favorable moat with growing ROIC and value creation, indicating a durable competitive advantage. Hewlett Packard Enterprise shows a very unfavorable moat with declining ROIC, reflecting challenges in maintaining profitability and competitive strength.
Stock Comparison
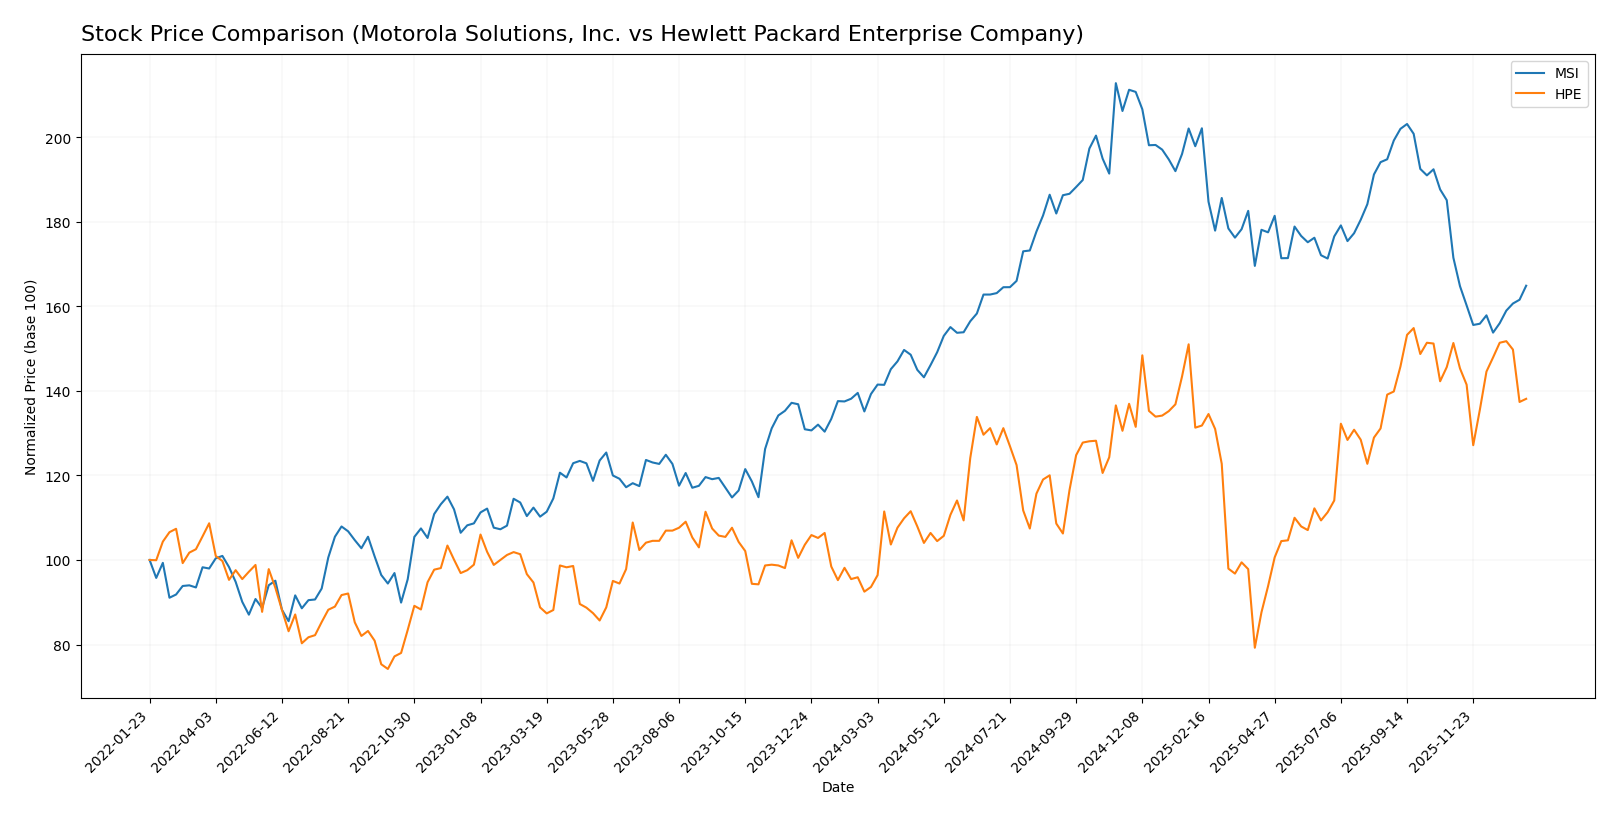
The stock prices of Motorola Solutions, Inc. (MSI) and Hewlett Packard Enterprise Company (HPE) exhibited notable bullish trends over the past 12 months, with recent periods showing slight downward adjustments in both cases.
Trend Analysis
Motorola Solutions, Inc. showed an 18.39% price increase over the past year, indicating a bullish trend with decelerating momentum. The stock ranged between 330.27 and 504.6, with recent weeks reflecting a mild 3.86% decline.
Hewlett Packard Enterprise Company posted a 47.52% gain over the last 12 months, also bullish but decelerating. The price fluctuated between 12.79 and 24.99, while recent activity showed an 8.72% decrease with near-neutral slope.
Comparing both, HPE delivered the higher market performance with a 47.52% increase versus MSI’s 18.39% over the past year.
Target Prices
The target price consensus for Motorola Solutions, Inc. and Hewlett Packard Enterprise Company reflects moderate upside potential.
| Company | Target High | Target Low | Consensus |
|---|---|---|---|
| Motorola Solutions, Inc. | 525 | 436 | 469.8 |
| Hewlett Packard Enterprise Company | 31 | 21 | 27.25 |
Analysts expect Motorola Solutions’ price to rise from the current $391 to around $470 on average, indicating solid growth potential. Hewlett Packard Enterprise’s consensus target of $27.25 is above its current price of $22.30, suggesting moderate upside for investors.
Analyst Opinions Comparison
This section compares analysts’ ratings and grades for Motorola Solutions, Inc. and Hewlett Packard Enterprise Company:
Rating Comparison
MSI Rating
- Rating: B+ indicating a very favorable overall assessment.
- Discounted Cash Flow Score: 4, showing favorable future cash flow projections.
- ROE Score: 5, very favorable efficiency in generating profit from equity.
- ROA Score: 5, very favorable asset utilization to generate earnings.
- Debt To Equity Score: 1, very unfavorable financial risk due to high debt.
- Overall Score: 3, moderate overall financial standing.
HPE Rating
- Rating: B- indicating a very favorable overall assessment.
- Discounted Cash Flow Score: 4, showing favorable future cash flow projections.
- ROE Score: 2, moderate efficiency in generating profit from equity.
- ROA Score: 2, moderate asset utilization to generate earnings.
- Debt To Equity Score: 1, very unfavorable financial risk due to high debt.
- Overall Score: 2, moderate overall financial standing.
Which one is the best rated?
Based strictly on the provided data, MSI holds higher ratings in ROE and ROA, as well as a better overall score than HPE. Both have equally unfavorable debt-to-equity scores, but MSI’s stronger profitability metrics give it a comparatively better rating.
Scores Comparison
Here is a comparison of the Altman Z-Score and Piotroski Score for both companies:
Motorola Solutions, Inc. Scores
- Altman Z-Score: 3.65, indicating a safe zone
- Piotroski Score: 5, categorized as average
Hewlett Packard Enterprise Company Scores
- Altman Z-Score: 0.75, indicating a distress zone
- Piotroski Score: 5, categorized as average
Which company has the best scores?
Motorola Solutions, Inc. has a significantly higher Altman Z-Score, placing it in the safe zone, while HPE is in the distress zone. Both have the same average Piotroski Score of 5.
Grades Comparison
Here is a comparison of the recent grades assigned to Motorola Solutions, Inc. and Hewlett Packard Enterprise Company by major grading firms:
Motorola Solutions, Inc. Grades
The table below summarizes recent grades for Motorola Solutions, Inc. from several reputable grading companies.
| Grading Company | Action | New Grade | Date |
|---|---|---|---|
| Piper Sandler | Upgrade | Overweight | 2026-01-05 |
| Morgan Stanley | Upgrade | Overweight | 2025-12-17 |
| Barclays | Maintain | Overweight | 2025-10-31 |
| Piper Sandler | Maintain | Neutral | 2025-10-31 |
| Evercore ISI Group | Maintain | Outperform | 2025-08-29 |
| Barclays | Maintain | Overweight | 2025-08-08 |
| UBS | Maintain | Buy | 2025-08-08 |
| Barclays | Maintain | Overweight | 2025-05-05 |
| JP Morgan | Maintain | Overweight | 2025-04-17 |
| Barclays | Maintain | Overweight | 2025-02-14 |
Motorola Solutions shows predominantly positive and stable grades, with multiple upgrades to “Overweight” and consistent maintenance of favorable ratings.
Hewlett Packard Enterprise Company Grades
The table below shows recent grades for Hewlett Packard Enterprise Company from recognized grading firms.
| Grading Company | Action | New Grade | Date |
|---|---|---|---|
| Argus Research | Maintain | Buy | 2025-12-10 |
| BWG Global | Upgrade | Positive | 2025-11-24 |
| Morgan Stanley | Downgrade | Equal Weight | 2025-11-17 |
| Barclays | Maintain | Overweight | 2025-10-16 |
| Goldman Sachs | Maintain | Neutral | 2025-10-16 |
| UBS | Maintain | Neutral | 2025-10-16 |
| Citigroup | Maintain | Buy | 2025-10-06 |
| Goldman Sachs | Maintain | Neutral | 2025-10-02 |
| Citigroup | Maintain | Buy | 2025-09-04 |
| UBS | Maintain | Neutral | 2025-09-04 |
Hewlett Packard Enterprise’s grades present a mixed picture, including stable “Buy” and “Neutral” ratings alongside a recent downgrade to “Equal Weight.”
Which company has the best grades?
Motorola Solutions, Inc. consistently receives more positive and stable grades such as “Overweight” and “Buy,” indicating stronger analyst confidence compared to Hewlett Packard Enterprise, which shows a mix of “Buy,” “Neutral,” and some downgrades. This divergence may influence investor sentiment and portfolio risk considerations.
Strengths and Weaknesses
Below is a comparison of key strengths and weaknesses between Motorola Solutions, Inc. (MSI) and Hewlett Packard Enterprise Company (HPE) based on the most recent financial and operational data.
| Criterion | Motorola Solutions, Inc. (MSI) | Hewlett Packard Enterprise Company (HPE) |
|---|---|---|
| Diversification | Balanced product and service revenues (6.45B Product, 4.36B Service) with steady growth | Diverse segments including Servers (17.7B), Networking (6.85B), Hybrid Cloud (5.75B), but reliance on Server segment |
| Profitability | High net margin (14.58%), strong ROE (92.6%), ROIC 21.6% indicating efficient capital use | Very low net margin (0.17%), negative ROIC (-0.59%), weak profitability and value destruction |
| Innovation | Demonstrates growing ROIC (+44.7%) with durable competitive advantage | Declining ROIC (-111.4%) indicating challenges in innovation and profitability sustainability |
| Global presence | Strong presence in government and enterprise markets globally | Global operations with multiple IT segments, but facing profitability pressures |
| Market Share | Solid market position with consistent growth and favorable financial ratios | Market share in enterprise IT but struggling with profitability and high valuation multiples |
Key takeaways: Motorola Solutions exhibits robust profitability, steady growth, and a durable competitive advantage, making it a value-creating investment. In contrast, Hewlett Packard Enterprise faces profitability challenges and declining returns, signaling caution for investors despite its diverse product portfolio.
Risk Analysis
Below is a comparative table of key risks for Motorola Solutions, Inc. (MSI) and Hewlett Packard Enterprise Company (HPE) based on the most recent data from 2025-2026:
| Metric | Motorola Solutions, Inc. (MSI) | Hewlett Packard Enterprise Company (HPE) |
|---|---|---|
| Market Risk | Moderate (Beta 1.005) | Higher (Beta 1.333) |
| Debt Level | High (Debt/Equity 3.85, 44.9% debt-to-assets) | Moderate (Debt/Equity 0.91, 29.5% debt-to-assets) |
| Regulatory Risk | Moderate (Government/public safety sector exposure) | Moderate (Global operations with diverse regulations) |
| Operational Risk | Moderate (Complex integration of hardware/software) | Higher (Complex IT solutions, supply chain challenges) |
| Environmental Risk | Low to Moderate (Technology sector, some hardware impact) | Low to Moderate (Focus on IT services, less hardware production) |
| Geopolitical Risk | Moderate (International presence in sensitive sectors) | Moderate to High (Global footprint, exposure to global trade tensions) |
In synthesis, HPE carries higher market and operational risks due to its global scope and exposure to complex IT supply chains, while MSI’s most impactful risk is its higher leverage and debt level, which could affect financial flexibility. Both firms face moderate regulatory and geopolitical risks given their international operations and technology focus. Notably, MSI’s strong Altman Z-Score suggests lower bankruptcy risk compared to HPE, which is in the distress zone, underscoring financial vulnerability.
Which Stock to Choose?
Motorola Solutions, Inc. (MSI) shows favorable income evolution with strong revenue and net income growth over 2020-2024. Its financial ratios are slightly favorable, highlighted by a very high return on equity (92.6%) and solid profitability, despite some unfavorable valuation multiples and higher debt levels. MSI is rated B+ with a very favorable overall rating and a very favorable moat due to a growing ROIC well above WACC.
Hewlett Packard Enterprise Company (HPE) exhibits mixed income trends with some revenue growth but significant net income decline and negative margin trends over 2021-2025. Its financial ratios are slightly unfavorable, with low profitability and moderate debt, but it benefits from a favorable WACC and dividend yield. HPE holds a B- rating with a very unfavorable moat, reflecting declining returns and value destruction, alongside distress-level financial scores.
Investors seeking companies with durable competitive advantages and strong profitability might find MSI more aligned with their profile, while those focused on potential value or income through dividends might consider HPE’s attributes, acknowledging its financial challenges and risk profile. The choice could depend on the investor’s tolerance for risk and preference for growth versus stability.
Disclaimer: Investment carries a risk of loss of initial capital. The past performance is not a reliable indicator of future results. Be sure to understand risks before making an investment decision.
Go Further
I encourage you to read the complete analyses of Motorola Solutions, Inc. and Hewlett Packard Enterprise Company to enhance your investment decisions: