In the competitive landscape of healthcare distribution, McKesson Corporation (MCK) and Henry Schein, Inc. (HSIC) stand out as key players with overlapping markets and innovative strategies. Both companies serve diverse medical sectors, offering pharmaceutical and medical products alongside technology solutions, making their comparison essential. This article will guide you through their strengths and risks to help determine which stock might best enhance your investment portfolio.
Table of contents
Companies Overview
I will begin the comparison between McKesson Corporation and Henry Schein, Inc. by providing an overview of these two companies and their main differences.
McKesson Overview
McKesson Corporation operates primarily in healthcare services with a focus on pharmaceutical distribution in the U.S. and internationally. Its business is divided into four segments: U.S. Pharmaceutical, International, Medical-Surgical Solutions, and Prescription Technology Solutions. McKesson supports pharmacies, healthcare providers, and biopharma companies by offering distribution, technology, and clinical and financial solutions. The company is headquartered in Irving, Texas, and has a market capitalization of approximately 102B USD.
Henry Schein Overview
Henry Schein, Inc. provides healthcare products and services mainly to dental and medical practitioners, laboratories, and institutional clinics globally. It operates through two segments: Health Care Distribution and Technology and Value-Added Services. The company supplies a broad range of dental and medical products and offers practice management software and consulting services. Headquartered in Melville, New York, Henry Schein has a market cap near 9.5B USD and employs about 25,000 people.
Key similarities and differences
Both McKesson and Henry Schein operate in the healthcare distribution industry, supplying medical products and services to healthcare providers. However, McKesson has a larger scale with a broader geographic footprint and diversified segments including prescription technology and international markets. Henry Schein focuses more on dental and medical practitioners and integrates technology and value-added services as a significant part of its business model, contrasting with McKesson’s heavier emphasis on pharmaceutical distribution.
Income Statement Comparison
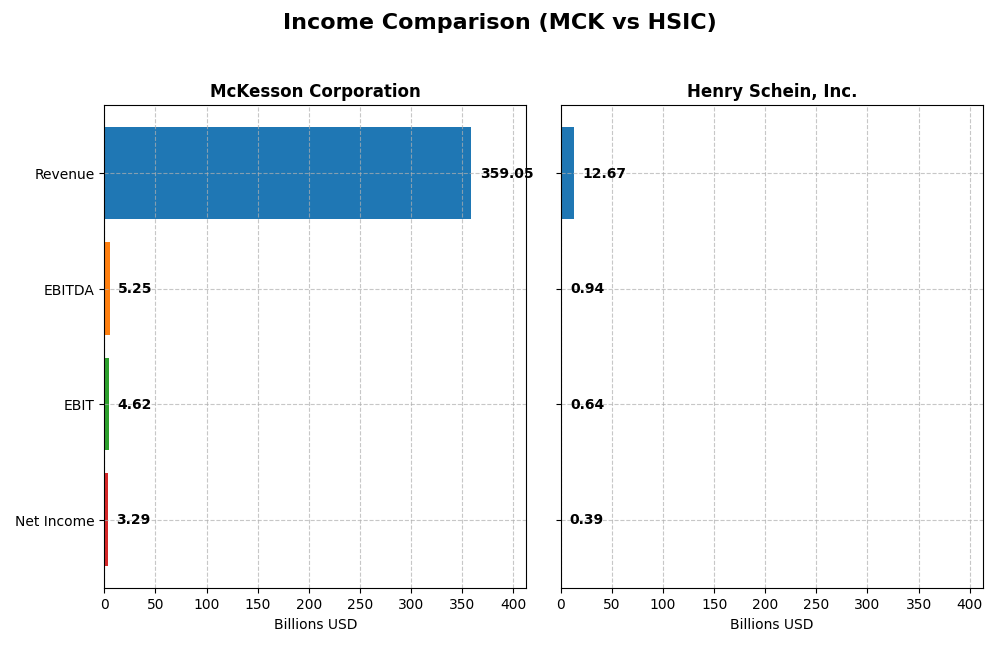
The table below compares the key income statement metrics for McKesson Corporation and Henry Schein, Inc. for their most recent fiscal years, providing a snapshot of their financial performance.
| Metric | McKesson Corporation (MCK) | Henry Schein, Inc. (HSIC) |
|---|---|---|
| Market Cap | 102B | 9.5B |
| Revenue | 359B | 12.7B |
| EBITDA | 5.25B | 941M |
| EBIT | 4.62B | 644M |
| Net Income | 3.30B | 390M |
| EPS | 25.86 | 3.07 |
| Fiscal Year | 2025 | 2024 |
Income Statement Interpretations
McKesson Corporation
McKesson’s revenue grew significantly from $238B in 2021 to $359B in 2025, with net income rising from -$4.54B to $3.29B, reflecting a strong turnaround. Gross and EBIT margins remained largely stable, around 3.5% and 1.3% respectively. In 2025, revenue growth accelerated to 16.2%, EBIT increased 14.5%, and EPS rose nearly 15%, although net margin slightly declined.
Henry Schein, Inc.
Henry Schein’s revenue increased steadily from $10.1B in 2020 to $12.7B in 2024, but net income declined from $402M to $390M. Gross margin was strong at nearly 30%, while EBIT and net margins hovered around 5.1% and 3.1%. The latest year showed modest revenue growth of 2.7%, EBIT growth of 2.4%, but net margin and EPS decreased, signaling some margin pressure.
Which one has the stronger fundamentals?
McKesson demonstrates stronger fundamentals with robust revenue and net income growth over five years, favorable margin trends, and improving EPS despite a small net margin dip in the latest year. Henry Schein shows stable gross margins but struggles with net income declines and unfavorable recent margin trends, leading to an overall less favorable income statement evaluation.
Financial Ratios Comparison
This table presents a side-by-side comparison of key financial ratios for McKesson Corporation and Henry Schein, Inc. based on their most recent fiscal year data available.
| Ratios | McKesson Corporation (2025) | Henry Schein, Inc. (2024) |
|---|---|---|
| ROE | -1.59 | 11.49 |
| ROIC | 23.30% | 6.73% |
| P/E | 26.02 | 22.89 |
| P/B | -41.34 | 2.63 |
| Current Ratio | 0.90 | 1.42 |
| Quick Ratio | 0.53 | 0.78 |
| D/E (Debt-to-Equity) | -3.56 | 0.85 |
| Debt-to-Assets | 9.83% | 28.09% |
| Interest Coverage | 17.08 | 5.56 |
| Asset Turnover | 4.78 | 1.24 |
| Fixed Asset Turnover | 83.81 | 15.38 |
| Payout Ratio | 10.47% | 0% |
| Dividend Yield | 0.40% | 0% |
Interpretation of the Ratios
McKesson Corporation
McKesson’s financial ratios present a mixed picture with 57% favorable and 43% unfavorable evaluations. Strengths include robust return on invested capital (23.3%), low debt-to-assets (9.83%), and strong asset turnover (4.78). Weaknesses are noted in net margin (0.92%), negative return on equity (-158.87%), and a low current ratio (0.9). The company pays dividends with a modest yield of 0.4%, supported by free cash flow, though payout sustainability should be monitored.
Henry Schein, Inc.
Henry Schein’s ratios are slightly favorable, with 29% favorable, 21% unfavorable, and 50% neutral. The company shows moderate returns with ROE at 11.49% and ROIC at 6.73%, but net margin at 3.08% is marked unfavorable. Liquidity ratios display neutrality to weakness, and the company does not pay dividends, likely reflecting reinvestment priorities or growth focus. Debt levels are moderate with debt-to-assets at 28.09%.
Which one has the best ratios?
McKesson exhibits a higher proportion of favorable ratios, particularly in capital efficiency and leverage, despite concerns in profitability and liquidity. Henry Schein shows more balanced but less robust metrics with a higher share of neutral ratios and no dividend payout. Based on the available ratio evaluations, McKesson presents a stronger overall financial profile.
Strategic Positioning
This section compares the strategic positioning of McKesson Corporation and Henry Schein, Inc., covering market position, key segments, and exposure to technological disruption:
McKesson Corporation
- Leading medical distribution company with diversified segments and moderate competitive pressure.
- Operates four segments: U.S. Pharmaceutical, International, Medical-Surgical Solutions, and Prescription Technology Solutions.
- Prescription Technology Solutions segment addresses medication challenges with innovative access and adherence solutions.
Henry Schein, Inc.
- Focused medical distribution with competitive pressure in dental and medical markets.
- Two segments: Health Care Distribution and Technology and Value-Added Services.
- Technology segment provides practice management software and value-added services for healthcare practitioners.
McKesson Corporation vs Henry Schein, Inc. Positioning
McKesson has a diversified portfolio across pharmaceuticals, international markets, medical supplies, and technology, supporting broad revenue streams. Henry Schein concentrates on dental and medical distribution coupled with technology services, offering a more specialized but narrower focus.
Which has the best competitive advantage?
McKesson demonstrates a very favorable moat with growing ROIC and strong value creation, indicating durable competitive advantage. Henry Schein shows a very unfavorable moat with declining ROIC, suggesting value destruction and weaker competitive positioning.
Stock Comparison
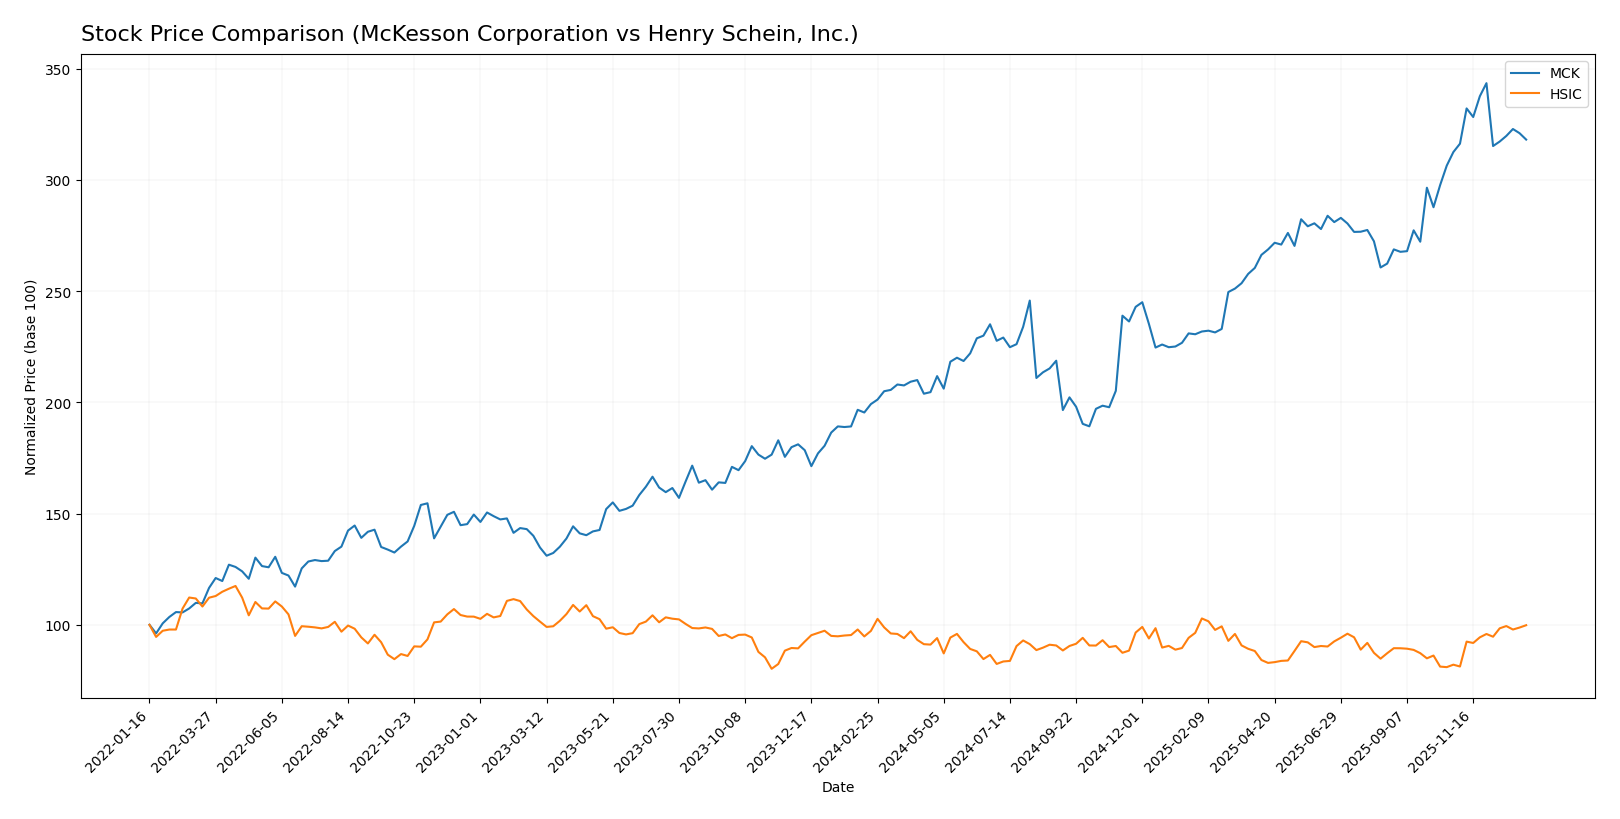
The stock price movements of McKesson Corporation and Henry Schein, Inc. over the past 12 months reveal contrasting dynamics, with McKesson showing strong overall growth and Henry Schein accelerating in recent months.
Trend Analysis
McKesson Corporation’s stock posted a bullish trend over the past year with a 59.68% increase, though the pace of growth has decelerated recently, showing a mild 1.8% decline in the last quarter.
Henry Schein, Inc. recorded a modest bullish trend with a 2.63% rise over the year, but its recent 21.62% gain signals accelerating momentum and growing investor interest.
Comparing both, McKesson delivered the highest market performance for the year, despite recent softness, outperforming Henry Schein’s more moderate overall gain but strong recent surge.
Target Prices
The current analyst consensus for McKesson Corporation and Henry Schein, Inc. suggests moderate upside potential.
| Company | Target High | Target Low | Consensus |
|---|---|---|---|
| McKesson Corporation | 1000 | 772 | 910.4 |
| Henry Schein, Inc. | 90 | 75 | 82.5 |
Analysts expect McKesson shares to appreciate from the current 816.06 USD to around 910.4 USD, indicating a positive outlook. Henry Schein’s consensus target of 82.5 USD is slightly above its current price of 77.64 USD, reflecting modest growth expectations.
Analyst Opinions Comparison
This section compares analysts’ ratings and grades for McKesson Corporation and Henry Schein, Inc.:
Rating Comparison
McKesson Corporation Rating
- Rating: C+ with a very favorable status
- Discounted Cash Flow Score: 5, very favorable
- ROE Score: 1, very unfavorable
- ROA Score: 3, moderate
- Debt To Equity Score: 1, very unfavorable
- Overall Score: 2, moderate
Henry Schein, Inc. Rating
- Rating: B with a very favorable status
- Discounted Cash Flow Score: 4, favorable
- ROE Score: 4, favorable
- ROA Score: 3, moderate
- Debt To Equity Score: 1, very unfavorable
- Overall Score: 3, moderate
Which one is the best rated?
Henry Schein holds a higher overall rating (B vs. C+) and performs better on key profitability metrics like ROE. Both have equally low debt-to-equity scores, indicating similar financial risk.
Scores Comparison
The scores comparison between McKesson Corporation and Henry Schein, Inc. based on financial stability and strength is as follows:
MCK Scores
- Altman Z-Score: 5.82, indicating a safe financial zone with low bankruptcy risk.
- Piotroski Score: 6, reflecting average financial strength and value potential.
HSIC Scores
- Altman Z-Score: 2.82, placing the company in a grey zone with moderate bankruptcy risk.
- Piotroski Score: 6, also showing average financial strength and value potential.
Which company has the best scores?
McKesson shows a stronger financial safety profile with a higher Altman Z-Score in the safe zone, while both companies have equal Piotroski Scores indicating similar average financial strength.
Grades Comparison
Here is a comparison of recent reliable grades for McKesson Corporation and Henry Schein, Inc.:
McKesson Corporation Grades
The following table summarizes recent grades from established grading companies for McKesson Corporation:
| Grading Company | Action | New Grade | Date |
|---|---|---|---|
| Wells Fargo | Maintain | Equal Weight | 2025-11-10 |
| Baird | Maintain | Outperform | 2025-11-06 |
| Morgan Stanley | Maintain | Overweight | 2025-11-06 |
| UBS | Maintain | Buy | 2025-11-06 |
| UBS | Maintain | Buy | 2025-10-27 |
| Jefferies | Maintain | Buy | 2025-10-14 |
| JP Morgan | Maintain | Overweight | 2025-09-26 |
| Morgan Stanley | Maintain | Overweight | 2025-09-24 |
| Evercore ISI Group | Maintain | Outperform | 2025-09-24 |
| TD Cowen | Maintain | Buy | 2025-09-24 |
McKesson’s grades consistently indicate a positive outlook with multiple “Buy,” “Outperform,” and “Overweight” ratings maintained by reputable firms.
Henry Schein, Inc. Grades
The following table summarizes recent grades from established grading companies for Henry Schein, Inc.:
| Grading Company | Action | New Grade | Date |
|---|---|---|---|
| Morgan Stanley | Maintain | Underweight | 2025-11-05 |
| Barrington Research | Maintain | Outperform | 2025-11-05 |
| JP Morgan | Maintain | Overweight | 2025-11-05 |
| Evercore ISI Group | Maintain | Outperform | 2025-11-05 |
| Wells Fargo | Maintain | Equal Weight | 2025-11-05 |
| Barrington Research | Maintain | Outperform | 2025-10-22 |
| Barrington Research | Maintain | Outperform | 2025-09-23 |
| Evercore ISI Group | Upgrade | Outperform | 2025-08-26 |
| JP Morgan | Maintain | Overweight | 2025-08-07 |
| UBS | Maintain | Neutral | 2025-08-06 |
Henry Schein’s ratings are mixed, with some strong “Outperform” and “Overweight” grades, but also an “Underweight” from Morgan Stanley and “Neutral” from UBS, reflecting a more varied sentiment.
Which company has the best grades?
McKesson Corporation generally holds better grades, with a higher proportion of “Buy” and “Outperform” ratings and no negative grades, suggesting stronger analyst confidence. Henry Schein, Inc. shows a more balanced profile with some cautionary ratings, potentially indicating higher uncertainty for investors.
Strengths and Weaknesses
Below is a comparative overview of McKesson Corporation and Henry Schein, Inc., focusing on key investment criteria.
| Criterion | McKesson Corporation (MCK) | Henry Schein, Inc. (HSIC) |
|---|---|---|
| Diversification | Highly diversified with strong U.S. Pharmaceutical segment ($328B in 2025) and growing International presence ($14.7B in 2025) | Moderate diversification focused on Healthcare Distribution (~$12.7B) and Technology segments |
| Profitability | Favorable ROIC at 23.3%, but weak net margin (0.92%) and negative ROE (-158.87%) | Neutral ROIC (6.73%), modest net margin (3.08%), and positive ROE (11.49%) |
| Innovation | Investment in Prescription Technology Solutions ($5.2B in 2025) supports innovation efforts | Technology segment smaller (~$0.5B), innovation less pronounced |
| Global presence | Strong global footprint with significant international revenues | More concentrated, primarily U.S.-focused distribution and technology |
| Market Share | Large market share in pharmaceutical distribution with high asset turnover (4.78) | Smaller scale with lower asset turnover (1.24), indicating less market dominance |
Key takeaways: McKesson shows a robust global presence and strong value creation with a very favorable moat, despite some profitability challenges. Henry Schein has a more modest scale and faces declining profitability, signaling caution for investors seeking durable competitive advantages.
Risk Analysis
Below is a comparison of key risk factors for McKesson Corporation (MCK) and Henry Schein, Inc. (HSIC) as of the most recent fiscal years:
| Metric | McKesson Corporation (MCK) | Henry Schein, Inc. (HSIC) |
|---|---|---|
| Market Risk | Low beta (0.41) indicates lower volatility | Moderate beta (0.88) suggests moderate volatility |
| Debt Level | Low debt-to-assets (9.8%), favorable leverage ratios | Moderate debt-to-assets (28.1%), neutral to favorable leverage |
| Regulatory Risk | High, due to pharmaceutical distribution and healthcare compliance | Moderate, due to healthcare product regulations |
| Operational Risk | Moderate; complex supply chain with multiple segments | Moderate; reliance on dental and medical product distribution |
| Environmental Risk | Moderate; logistics and pharmaceutical waste management | Moderate; product manufacturing and supply chain impact |
| Geopolitical Risk | Moderate; international exposure in Europe and Canada | Low to moderate; mainly US-focused operations |
The most impactful risks are regulatory challenges for McKesson, given its broad pharmaceutical distribution and international operations, and debt level for Henry Schein, which has a higher leverage ratio. McKesson’s low beta suggests less market volatility risk, while Henry Schein faces moderate market fluctuations. Both companies maintain moderate operational and environmental risks typical of the healthcare distribution sector.
Which Stock to Choose?
McKesson Corporation (MCK) has shown favorable income growth with a 50.72% revenue increase over five years and strong profitability metrics except for an unfavorable net margin and negative return on equity. Its financial ratios are mostly favorable, supported by low debt levels and a very favorable economic moat rating, indicating durable competitive advantage.
Henry Schein, Inc. (HSIC) presents a mixed income evolution, with a modest 2.71% revenue growth last year but an overall net income decline of -3.04% over the period. Its financial ratios are slightly favorable, with neutral profitability and moderate leverage, while its economic moat is very unfavorable, signaling declining profitability and value destruction.
Investors inclined toward companies with strong competitive moats and consistent value creation might find McKesson’s profile more appealing, while those favoring moderate growth with a slightly favorable financial ratio mix and accelerating recent price trends could view Henry Schein as a potential option depending on their risk tolerance and investment strategy.
Disclaimer: Investment carries a risk of loss of initial capital. The past performance is not a reliable indicator of future results. Be sure to understand risks before making an investment decision.
Go Further
I encourage you to read the complete analyses of McKesson Corporation and Henry Schein, Inc. to enhance your investment decisions: