In the competitive world of household and personal products, Unilever PLC and Helen of Troy Limited stand out as influential players with distinct strategies and market reach. Unilever, a global giant with a diverse portfolio, contrasts with Helen of Troy’s focused innovation in home, health, and beauty segments. This article will explore their strengths and growth prospects to help you decide which company deserves a spot in your investment portfolio.
Table of contents
Companies Overview
I will begin the comparison between Unilever PLC and Helen of Troy Limited by providing an overview of these two companies and their main differences.
Unilever PLC Overview
Unilever PLC operates as a leading fast-moving consumer goods company with a diverse portfolio across Beauty & Personal Care, Foods & Refreshment, and Home Care segments. The company markets well-known brands such as Dove, Ben & Jerry’s, and Knorr, focusing on global consumer essentials. Headquartered in London and incorporated in 1894, Unilever boasts a market cap of approximately 140.6B USD and employs over 115K people worldwide.
Helen of Troy Limited Overview
Helen of Troy Limited is a consumer products company operating in Home & Outdoor, Health & Wellness, and Beauty segments. It distributes various brands like OXO, Hydro Flask, and Revlon across multiple retail channels in North America and internationally. Founded in 1968 and based in El Paso, Texas, Helen of Troy has a market cap near 431M USD and a workforce of about 1.9K employees, reflecting a more focused but diverse product range.
Key similarities and differences
Both companies operate in the consumer defensive sector, offering household and personal products with a multi-segment business model. Unilever is a significantly larger global player with a broader brand portfolio and extensive employee base, while Helen of Troy targets niche markets with specialized products in fewer segments. Unilever’s scale and brand diversity contrast with Helen of Troy’s focused approach and smaller market capitalization.
Income Statement Comparison
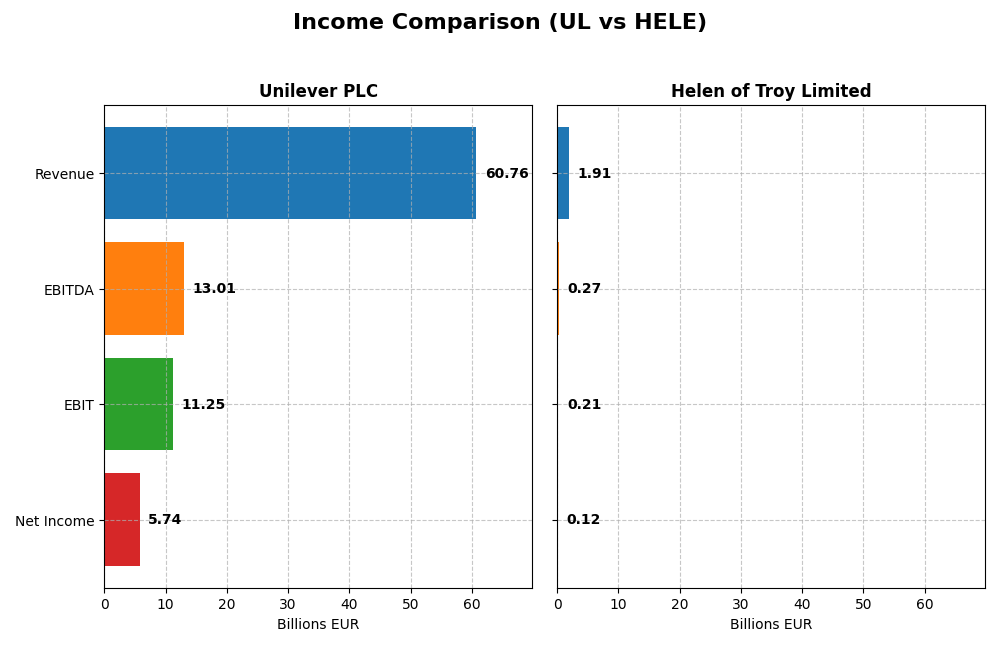
The table below presents a side-by-side comparison of key income statement metrics for Unilever PLC and Helen of Troy Limited, based on their most recent fiscal year data.
| Metric | Unilever PLC (UL) | Helen of Troy Limited (HELE) |
|---|---|---|
| Market Cap | 141B EUR | 431M USD |
| Revenue | 60.8B EUR | 1.91B USD |
| EBITDA | 13B EUR | 269M USD |
| EBIT | 11.3B EUR | 214M USD |
| Net Income | 5.74B EUR | 124M USD |
| EPS | 2.3 EUR | 5.38 USD |
| Fiscal Year | 2024 | 2025 |
Income Statement Interpretations
Unilever PLC
Unilever’s revenue showed a favorable overall growth of 19.8% from 2020 to 2024, with net income increasing modestly by 2.9%. Margins remain strong, with a gross margin at 100% and an EBIT margin of 18.5%. However, in 2024, revenue growth slowed to 1.9%, net margin declined by 13.1%, and EPS dropped 10.6%, indicating margin pressure despite stable earnings.
Helen of Troy Limited
Helen of Troy experienced a declining revenue trend, down 9.1% over 2021-2025, with net income falling sharply by 51.3%. Margins, while still favorable, contracted notably, with net margin decreasing by 46.4% overall. The most recent year saw revenue drop 4.9%, net margin fall 22.9%, and EPS decline 23.6%, reflecting deteriorating profitability and operational challenges.
Which one has the stronger fundamentals?
Unilever exhibits stronger fundamentals with favorable margin levels, modest net income growth, and a positive long-term revenue trend, despite recent margin pressures. Conversely, Helen of Troy faces persistent revenue and profitability declines, with unfavorable growth metrics across all key income statement indicators, signaling weaker financial stability over the period analyzed.
Financial Ratios Comparison
The table below compares key financial ratios of Unilever PLC and Helen of Troy Limited for their most recent fiscal years, providing insight into profitability, liquidity, leverage, and valuation metrics.
| Ratios | Unilever PLC (2024) | Helen of Troy Limited (2025) |
|---|---|---|
| ROE | 28.7% | 7.35% |
| ROIC | 11.1% | 5.32% |
| P/E | 23.9 | 10.2 |
| P/B | 6.87 | 0.75 |
| Current Ratio | 0.76 | 2.00 |
| Quick Ratio | 0.56 | 1.03 |
| D/E | 1.53 | 0.57 |
| Debt-to-Assets | 38.4% | 30.7% |
| Interest Coverage | 8.41 | 2.75 |
| Asset Turnover | 0.76 | 0.61 |
| Fixed Asset Turnover | 5.21 | 5.23 |
| Payout Ratio | 75.2% | 0% |
| Dividend Yield | 3.14% | 0% |
Interpretation of the Ratios
Unilever PLC
Unilever shows a mixed ratio profile with strong returns on equity (28.73%) and invested capital (11.12%), alongside a low WACC (4.42%), indicating efficient capital usage. However, liquidity ratios such as current (0.76) and quick ratios (0.56) are weak, and its price-to-book ratio is high at 6.87, signaling potential overvaluation. The company maintains a stable dividend yield of 3.14%, supported by consistent payout coverage, though leverage and liquidity warrant caution.
Helen of Troy Limited
Helen of Troy exhibits moderate financial strength with a favorable price-to-earnings ratio of 10.25 and solid liquidity ratios, including a current ratio of 2.0 and quick ratio of 1.03. Its return on equity is low at 7.35%, reflecting weaker profitability. The company does not pay dividends, likely prioritizing reinvestment and growth strategies, supported by conservative debt levels and a neutral interest coverage ratio of 4.11.
Which one has the best ratios?
Both companies present a slightly favorable overall ratio profile with 42.86% favorable ratios each. Unilever benefits from higher profitability and capital efficiency but has weaker liquidity and valuation concerns. Helen of Troy offers strong liquidity and valuation metrics but lower profitability. The choice depends on investors’ emphasis on profitability versus liquidity and valuation.
Strategic Positioning
This section compares the strategic positioning of Unilever PLC and Helen of Troy Limited, focusing on market position, key segments, and exposure to technological disruption:
Unilever PLC
- Large market cap of 140.6B, operating in fast-moving consumer goods with stable beta 0.223, facing competitive pressure in household and personal products.
- Operates in Beauty & Personal Care, Foods & Refreshment, and Home Care segments with numerous global brands.
- No explicit information on technological disruption exposure provided.
Helen of Troy Limited
- Smaller market cap of 431M, diversified geographically, with higher beta 0.78, competing in consumer products across multiple regions.
- Focuses on Home & Outdoor, Health & Wellness, and Beauty segments with a diverse product portfolio and distribution channels.
- No explicit information on technological disruption exposure provided.
Unilever PLC vs Helen of Troy Limited Positioning
Unilever exhibits a broad, diversified portfolio across multiple consumer goods sectors, benefiting from global scale but facing intense competition. Helen of Troy is more concentrated in specific consumer segments with geographic diversification but operates at a much smaller scale.
Which has the best competitive advantage?
Unilever holds a slightly favorable moat status with value creation despite declining profitability, while Helen of Troy shows a very unfavorable moat with value destruction and declining returns, indicating weaker competitive advantage.
Stock Comparison
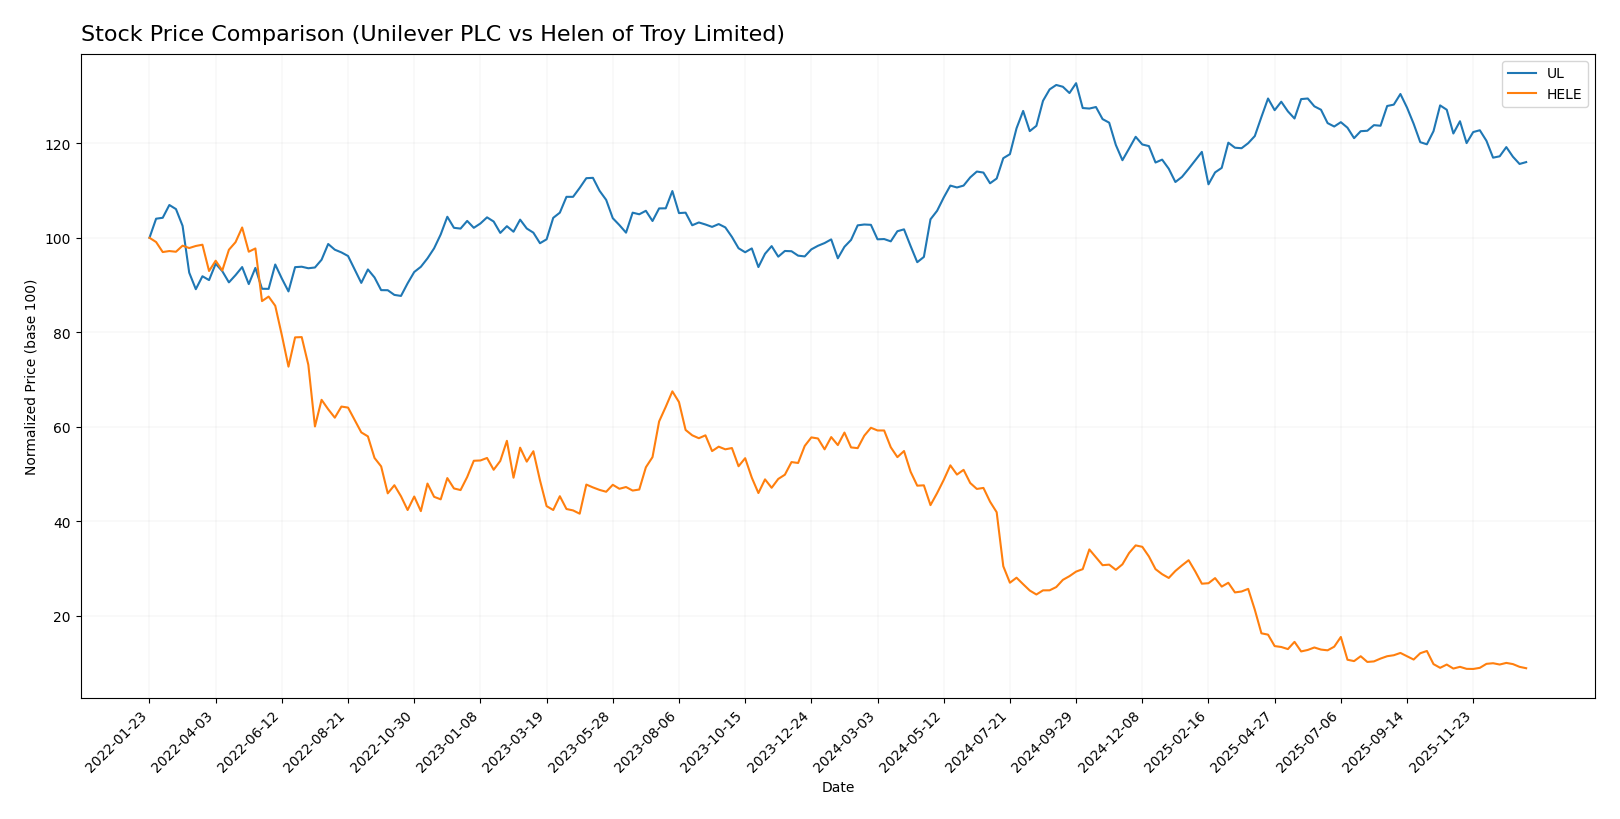
The stock price movements of Unilever PLC and Helen of Troy Limited over the past year reveal contrasting trends, with Unilever showing a steady overall increase despite recent pullbacks, while Helen of Troy experiences significant declines amid heightened volatility.
Trend Analysis
Unilever PLC’s stock exhibits a bullish trend with a 12.92% gain over the past 12 months, though recent months show a deceleration and a slight downward trend of -4.96%. Volatility remains moderate with a standard deviation of 4.86.
Helen of Troy Limited’s stock trend is sharply bearish with an 85.04% decline over the same period, accompanied by accelerating downward momentum and high volatility, as indicated by a 31.1 standard deviation. Recent performance shows minor recovery signs.
Comparing both, Unilever PLC delivered the highest market performance in the last year, maintaining a positive overall trend, while Helen of Troy faced significant losses despite a recent slight upturn.
Target Prices
Analysts provide clear target price consensus for Unilever PLC and Helen of Troy Limited.
| Company | Target High | Target Low | Consensus |
|---|---|---|---|
| Unilever PLC | 71 | 60.1 | 65.55 |
| Helen of Troy Limited | 22 | 22 | 22 |
The consensus target price for Unilever PLC is slightly above its current price of 64.42 USD, indicating moderate upside potential. Helen of Troy’s target is significantly higher than its current price of 18.78 USD, suggesting notable expected appreciation.
Analyst Opinions Comparison
This section compares analysts’ ratings and grades for Unilever PLC and Helen of Troy Limited:
Rating Comparison
Unilever PLC Rating
- Rating: B+, classified as Very Favorable by analysts.
- Discounted Cash Flow Score: 5, indicating very favorable valuation based on cash flow projections.
- ROE Score: 5, showing very favorable efficiency in generating profit from shareholders’ equity.
- ROA Score: 4, favorable use of assets to generate earnings.
- Debt To Equity Score: 1, very unfavorable, indicating higher financial risk.
- Overall Score: 3, moderate overall financial standing.
Helen of Troy Limited Rating
- Rating: B, also classified as Very Favorable by analysts.
- Discounted Cash Flow Score: 5, also very favorable for valuation.
- ROE Score: 1, considered very unfavorable for profit generation.
- ROA Score: 1, very unfavorable asset utilization.
- Debt To Equity Score: 4, favorable, indicating lower financial risk.
- Overall Score: 3, moderate overall financial standing.
Which one is the best rated?
Unilever PLC has a higher rating (B+) and stronger scores in ROE and ROA, but a weaker debt-to-equity score compared to Helen of Troy Limited. Overall, their overall scores are equal, reflecting a balanced but different risk-profile assessment.
Scores Comparison
The scores comparison for Unilever PLC and Helen of Troy Limited is as follows:
UL Scores
- Altman Z-Score: 4.85, indicating a safe zone status.
- Piotroski Score: 6, reflecting an average financial strength.
HELE Scores
- Altman Z-Score: 1.10, indicating a distress zone.
- Piotroski Score: 3, indicating very weak financial strength.
Which company has the best scores?
Based strictly on the provided data, Unilever PLC has the best scores, showing a safe Altman Z-Score and an average Piotroski Score, while Helen of Troy is in distress zone with very weak Piotroski results.
Grades Comparison
Here is a comparison of the latest available grades from recognized grading companies for both companies:
Unilever PLC Grades
The table below summarizes recent grades assigned to Unilever PLC by reputable grading firms.
| Grading Company | Action | New Grade | Date |
|---|---|---|---|
| Erste Group | Downgrade | Hold | 2024-11-19 |
| B of A Securities | Upgrade | Buy | 2024-08-22 |
| JP Morgan | Upgrade | Overweight | 2024-05-23 |
| Argus Research | Maintain | Buy | 2024-05-08 |
| Morgan Stanley | Downgrade | Underweight | 2024-02-27 |
| Bernstein | Upgrade | Market Perform | 2022-03-14 |
| Bernstein | Upgrade | Market Perform | 2022-03-13 |
| Bernstein | Upgrade | Market Perform | 2021-11-01 |
| Bernstein | Upgrade | Market Perform | 2021-10-31 |
| Deutsche Bank | Downgrade | Hold | 2021-09-16 |
Unilever’s grades show a mixed trend with several upgrades to Buy or Market Perform, but also notable downgrades to Hold and Underweight, indicating a cautious outlook among analysts.
Helen of Troy Limited Grades
The table below shows recent grades given to Helen of Troy Limited by established grading companies.
| Grading Company | Action | New Grade | Date |
|---|---|---|---|
| UBS | Maintain | Neutral | 2026-01-09 |
| Canaccord Genuity | Maintain | Hold | 2026-01-09 |
| Canaccord Genuity | Maintain | Hold | 2026-01-06 |
| UBS | Maintain | Neutral | 2025-10-10 |
| Canaccord Genuity | Maintain | Hold | 2025-10-10 |
| UBS | Maintain | Neutral | 2025-10-02 |
| Canaccord Genuity | Downgrade | Hold | 2025-07-11 |
| UBS | Maintain | Neutral | 2025-07-11 |
| Canaccord Genuity | Maintain | Buy | 2025-07-07 |
| Canaccord Genuity | Maintain | Buy | 2025-04-25 |
Helen of Troy’s grades are largely stable, with most ratings holding steady at Neutral or Hold, and a few Maintains at Buy, indicating consistent but moderate analyst confidence.
Which company has the best grades?
Unilever exhibits a wider range of opinions, including upgrades to Buy and Overweight, but also downgrades, reflecting mixed analyst sentiment. Helen of Troy maintains more consistent Neutral and Hold ratings with fewer changes. Investors may interpret Unilever’s variable grades as indicating higher volatility in outlook, while Helen of Troy’s steadier grades suggest more stable but moderate expectations.
Strengths and Weaknesses
Below is a comparison of key strengths and weaknesses for Unilever PLC (UL) and Helen of Troy Limited (HELE) based on their recent financial and operational data.
| Criterion | Unilever PLC (UL) | Helen of Troy Limited (HELE) |
|---|---|---|
| Diversification | Highly diversified global product portfolio | Focused on Beauty & Wellness and Home & Outdoor |
| Profitability | Favorable ROIC (11.12%) and ROE (28.73%), neutral net margin (9.45%) | Neutral ROIC (5.32%), unfavorable ROE (7.35%), neutral net margin (6.49%) |
| Innovation | Moderate innovation reflected in slightly declining ROIC trend (-9.5%) | Declining ROIC trend (-66.9%) indicates challenges in maintaining innovation |
| Global presence | Strong global presence with broad international markets | More regionally concentrated, less diversified globally |
| Market Share | Large market share in fast-moving consumer goods | Smaller market share with niche focus in select segments |
Key takeaways: Unilever shows solid profitability and broad diversification but faces a slight decline in profitability trend. Helen of Troy struggles with declining profitability and limited diversification, raising caution for investors prioritizing stable value creation.
Risk Analysis
Below is a comparative table highlighting key risks for Unilever PLC (UL) and Helen of Troy Limited (HELE) based on the most recent data available in 2026:
| Metric | Unilever PLC (UL) | Helen of Troy Limited (HELE) |
|---|---|---|
| Market Risk | Low beta (0.223) indicating low volatility | Moderate beta (0.78) indicating moderate volatility |
| Debt Level | High debt-to-equity (1.53) and moderate debt-to-assets (38.44%) | Lower debt-to-equity (0.57) and 30.74% debt-to-assets |
| Regulatory Risk | Moderate; global operations subject to stringent EU & UK regulations | Moderate; US and international regulations impact segments |
| Operational Risk | Large scale with 116K employees, complexity in supply chain | Smaller scale (1.9K employees), less operational complexity |
| Environmental Risk | Significant due to global footprint and consumer goods impact | Moderate; product range less resource intensive |
| Geopolitical Risk | Exposure to multiple regions including UK, EU, developing markets | Exposure mainly US-centric with some international markets |
In synthesis, Unilever’s most impactful risks lie in its high leverage and operational complexity, offset by low market volatility. Helen of Troy faces higher market volatility and financial distress signals, including a low Altman Z-Score (1.1, distress zone) and weak Piotroski score (3), indicating higher bankruptcy risk. Investors should weigh Unilever’s strong financial resilience against Helen’s vulnerability despite its lower debt profile.
Which Stock to Choose?
Unilever PLC (UL) shows a favorable income statement with steady revenue growth of 19.79% over 2020-2024, a strong ROE of 28.73%, and a solid return on invested capital above its WACC, indicating value creation despite a declining ROIC trend. Its debt levels and liquidity ratios are less favorable, yet it maintains a very favorable overall rating of B+.
Helen of Troy Limited (HELE) presents an unfavorable income evolution marked by a 51.27% decline in net income over 2021-2025 and a low ROE of 7.35%. The company is shedding value with ROIC below WACC and a sharply declining profitability trend, though it has better liquidity and lower debt ratios. Its overall rating is also very favorable at B, despite weaker profitability scores.
For risk-tolerant investors seeking growth, Unilever’s stable profitability and value-creating moat might appear more attractive. Conversely, more conservative or value-focused investors prioritizing liquidity and lower leverage might find Helen of Troy’s financial ratios and debt profile relevant, though its declining income and profitability could signal caution.
Disclaimer: Investment carries a risk of loss of initial capital. The past performance is not a reliable indicator of future results. Be sure to understand risks before making an investment decision.
Go Further
I encourage you to read the complete analyses of Unilever PLC and Helen of Troy Limited to enhance your investment decisions: