Home > Comparison > Consumer Defensive > PG vs HELE
The strategic rivalry between The Procter & Gamble Company and Helen of Troy Limited shapes the competitive landscape of the Household & Personal Products industry. Procter & Gamble operates as a capital-intensive global giant with diverse product segments and extensive scale. Helen of Troy, by contrast, runs a nimble, innovation-driven model with focused brand portfolios. This analysis will clarify which company’s trajectory offers superior risk-adjusted returns for a diversified portfolio within the Consumer Defensive sector.
Table of contents
Companies Overview
The Procter & Gamble Company and Helen of Troy Limited both shape the Household & Personal Products market with distinct scale and reach.
The Procter & Gamble Company: Global Consumer Goods Powerhouse
The Procter & Gamble Company dominates as a global leader in branded consumer packaged goods. It generates revenue through diverse segments like Beauty, Grooming, Health Care, Fabric & Home Care, and Baby, Feminine & Family Care. In 2026, it focuses strategically on innovation and brand strength across multiple channels, including mass merchandisers and e-commerce, leveraging its massive 108K workforce and $354B market cap.
Helen of Troy Limited: Niche Consumer Lifestyle Innovator
Helen of Troy Limited operates in the same sector but targets a narrower scope with a $382M market cap and 1.9K employees. Its revenue engine spans Home & Outdoor, Health & Wellness, and Beauty segments, selling products under various lifestyle brands in North America, Europe, and Asia. Its 2026 strategy emphasizes product innovation in specialty categories like hydration and health monitoring, distributed through diverse retail and e-commerce networks.
Strategic Collision: Similarities & Divergences
Both companies compete within consumer essentials, but P&G’s broad portfolio contrasts Helen of Troy’s focused lifestyle approach. P&G pursues scale and global brand dominance, while Helen of Troy leverages niche innovation and agility. They battle primarily over market share in personal and home care products. Their investment profiles differ sharply: P&G’s stability and scale contrast Helen of Troy’s growth potential but higher volatility.
Income Statement Comparison
This data dissects the core profitability and scalability of both corporate engines to reveal who dominates the bottom line:
| Metric | The Procter & Gamble Company (PG) | Helen of Troy Limited (HELE) |
|---|---|---|
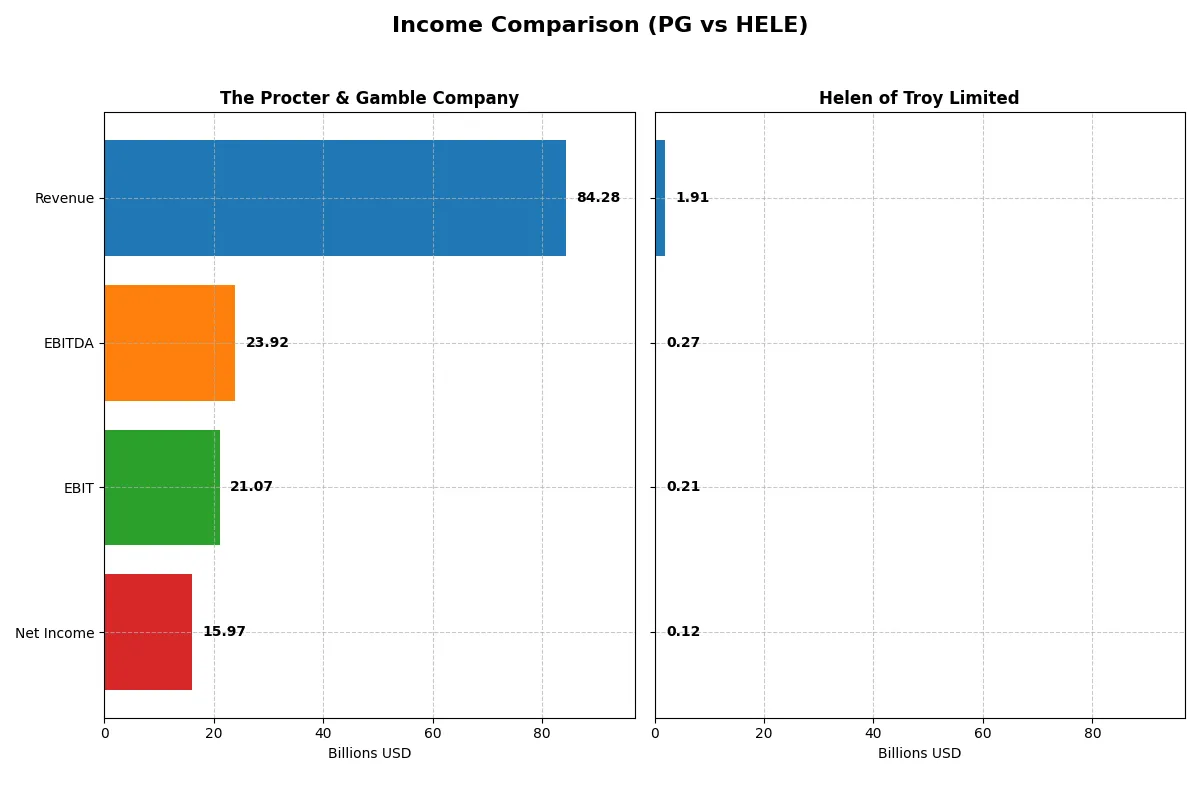
| Revenue | 84.28B | 1.91B |
| Cost of Revenue | 41.16B | 993M |
| Operating Expenses | 22.67B | 772M |
| Gross Profit | 43.12B | 914M |
| EBITDA | 23.92B | 269M |
| EBIT | 21.07B | 214M |
| Interest Expense | 907M | 52M |
| Net Income | 15.97B | 124M |
| EPS | 6.67 | 5.38 |
| Fiscal Year | 2025 | 2025 |
Income Statement Analysis: The Bottom-Line Duel
This income statement comparison reveals the true efficiency and profitability of each company’s business engine over recent years.
The Procter & Gamble Company Analysis
PG’s revenue grew steadily from 76B in 2021 to 84B in 2025, showing resilience despite a modest 0.3% dip last year. Its gross margin stays robust at 51%, and net margin improved to 19%, reflecting excellent cost control. In 2025, PG’s net income surged to 16B, evidencing strong operational momentum and margin expansion.
Helen of Troy Limited Analysis
HELE’s revenue contracted from 2.1B in 2021 to 1.9B in 2025, with a 4.9% decline last year signaling headwinds. Gross margin holds at 48%, but net margin dropped sharply to 6.5%, highlighting margin pressure. Net income fell to 124M in 2025, marking a severe erosion of profitability and weakening operational efficiency.
Margin Strength vs. Revenue Decline
PG outperforms HELE by delivering steady revenue growth coupled with robust margin expansion and rising net income. HELE faces shrinking top-line and bottom-line, eroding profitability and investor appeal. For investors, PG’s profile offers reliable margin power and growth, while HELE’s declining earnings signal caution.
Financial Ratios Comparison
These vital ratios act as a diagnostic tool to expose the underlying fiscal health, valuation premiums, and capital efficiency for the companies compared:
| Ratios | The Procter & Gamble Company (PG) | Helen of Troy Limited (HELE) |
|---|---|---|
| ROE | 30.7% | 7.35% |
| ROIC | 16.5% | 5.34% |
| P/E | 24.5 | 10.2 |
| P/B | 7.52 | 0.75 |
| Current Ratio | 0.70 | 2.00 |
| Quick Ratio | 0.49 | 1.03 |
| D/E (Debt-to-Equity) | 0.68 | 0.57 |
| Debt-to-Assets | 28.3% | 30.5% |
| Interest Coverage | 22.5 | 2.75 |
| Asset Turnover | 0.67 | 0.61 |
| Fixed Asset Turnover | 3.53 | 5.23 |
| Payout ratio | 61.8% | 0% |
| Dividend yield | 2.52% | 0% |
| Fiscal Year | 2025 | 2025 |
Efficiency & Valuation Duel: The Vital Signs
Financial ratios act as a company’s DNA, unveiling its hidden risks and operational excellence in a concise, quantifiable form.
The Procter & Gamble Company
Procter & Gamble demonstrates strong profitability with a 30.7% ROE and an 18.95% net margin, signaling operational efficiency. Its P/E of 24.5 is neutral, indicating fair valuation, though a high P/B of 7.52 is unfavorable. The company rewards shareholders with a 2.52% dividend yield, reflecting steady capital return amid reinvestment in growth.
Helen of Troy Limited
Helen of Troy shows modest profitability marked by a 7.35% ROE and a 6.49% net margin, which suggests limited earnings power. A low P/E of 10.25 and P/B of 0.75 indicate the stock is attractively valued. However, the absence of dividends points to a reinvestment focus, likely prioritizing R&D and growth initiatives.
Balanced Profitability Meets Valuation Discipline
Procter & Gamble offers superior profitability and consistent shareholder returns but trades at a stretched book value. Helen of Troy presents a more affordable valuation with weaker profitability and no dividends. Investors valuing steady income may prefer Procter & Gamble, while those seeking growth at a discount might lean toward Helen of Troy.
Which one offers the Superior Shareholder Reward?
I compare The Procter & Gamble Company (PG) and Helen of Troy Limited (HELE) on shareholder distributions. PG yields 2.5% dividends with a 62% payout ratio, signaling solid free cash flow coverage (1.31x). PG pairs dividends with steady buybacks, enhancing total returns. HELE pays no dividend, reinvesting heavily in growth and acquisitions, supported by higher free cash flow per share (11.2 vs. PG’s 5.7). HELE’s buybacks are less visible but its lower valuation (P/E ~10 vs. PG ~24) offers capital gains potential. PG’s dividend-plus-buyback model suits income-focused investors seeking reliable, sustainable yield. HELE’s reinvestment approach favors growth investors willing to accept higher volatility. In 2026, I find PG offers a more balanced and sustainable shareholder reward for total return investors prioritizing income and capital preservation.
Comparative Score Analysis: The Strategic Profile
The radar chart reveals the fundamental DNA and trade-offs of The Procter & Gamble Company and Helen of Troy Limited, highlighting their financial strengths and weaknesses:
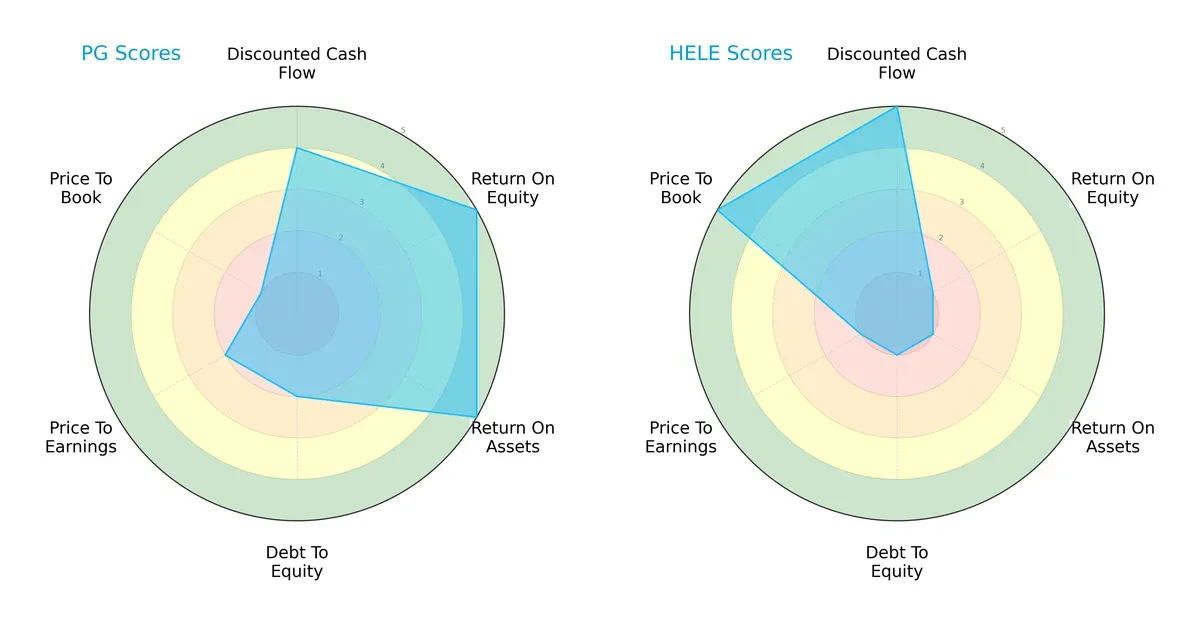
Procter & Gamble shows balanced strength in ROE (5) and ROA (5), indicating efficient profit generation and asset use. It has moderate debt control (2) but suffers from weak valuation scores (PE: 2, PB: 1). Helen of Troy excels in discounted cash flow (5) and price-to-book (5) metrics, suggesting potential undervaluation, but struggles with low ROE (1), ROA (1), and high leverage risk (debt-to-equity: 1). Overall, Procter & Gamble offers a more stable and diversified profile, while Helen of Troy relies heavily on valuation appeal.
—
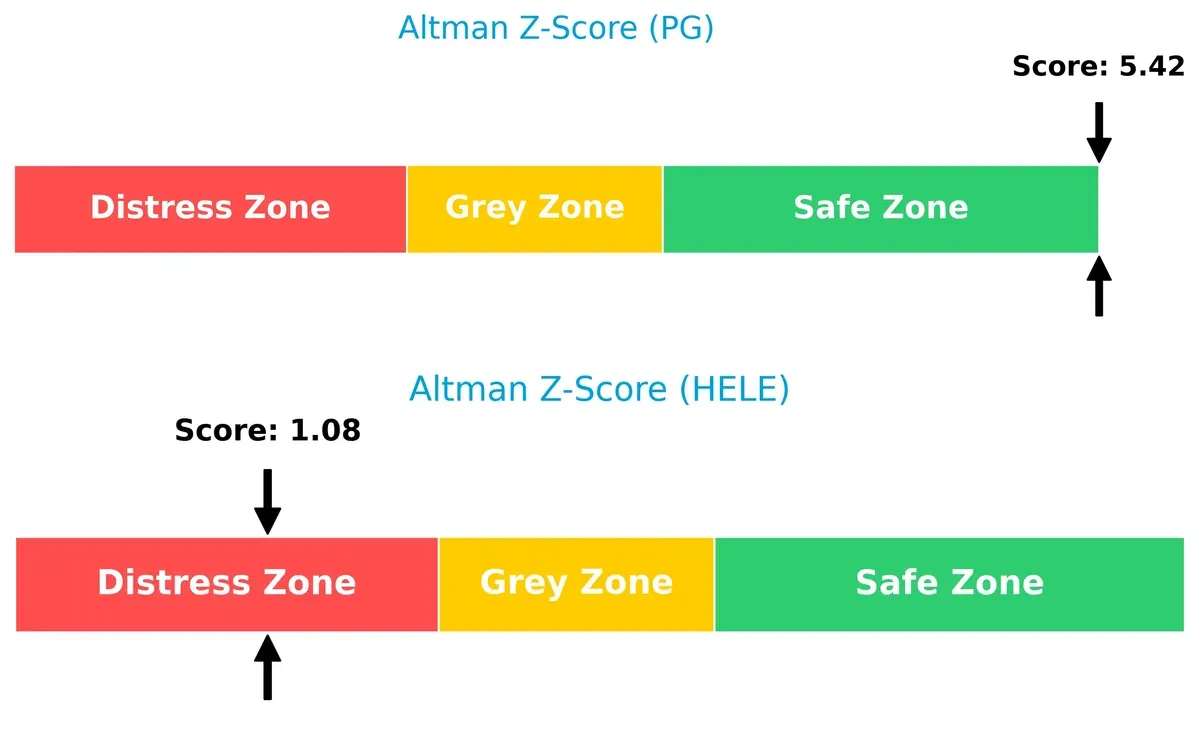
Bankruptcy Risk: Solvency Showdown
Procter & Gamble’s Altman Z-Score of 5.42 firmly places it in the safe zone, signaling robust long-term solvency. Helen of Troy’s score of 1.08 falls in the distress zone, raising alarm about bankruptcy risk in the current market cycle:
—
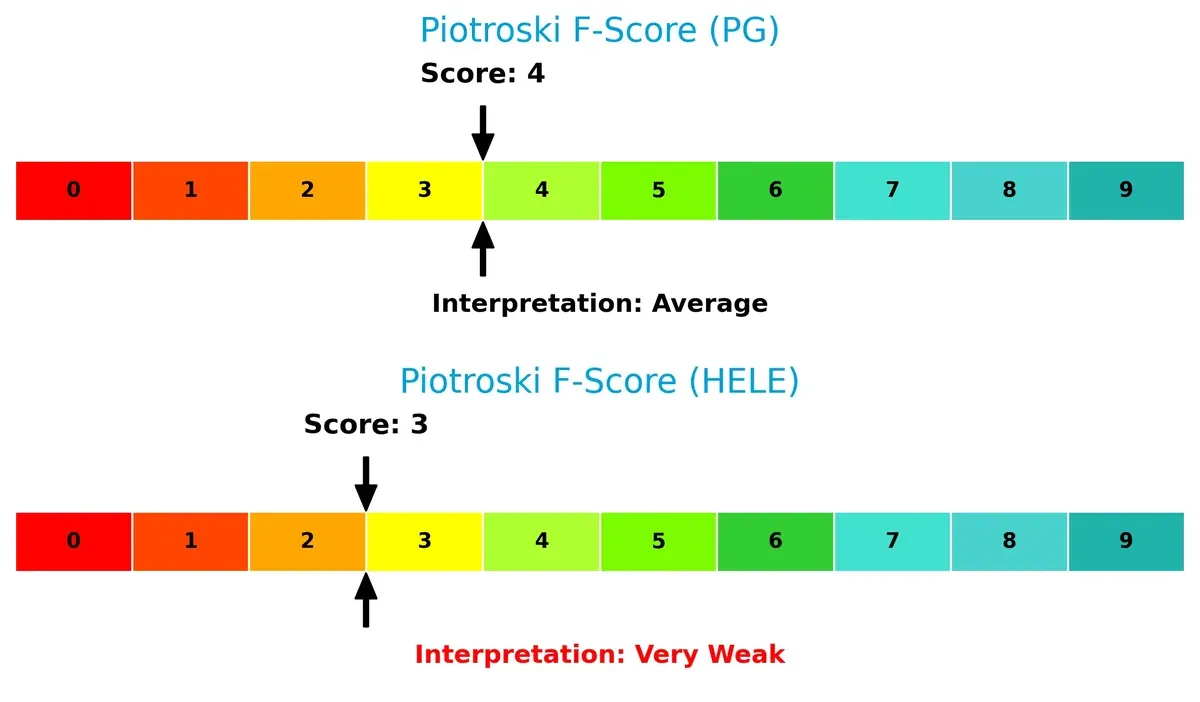
Financial Health: Quality of Operations
Procter & Gamble’s Piotroski F-Score of 4 indicates average financial health, reflecting moderate operational quality without glaring red flags. Helen of Troy’s score of 3 flags concerns, suggesting weaker internal metrics and potential financial stress compared to its peer:
How are the two companies positioned?
This section dissects the operational DNA of PG and HELE by comparing their revenue distribution by segment and internal dynamics. The final objective confronts their economic moats to identify which model offers the most resilient and sustainable competitive advantage today.
Revenue Segmentation: The Strategic Mix
This visual comparison dissects how The Procter & Gamble Company and Helen of Troy Limited diversify their income streams and where their primary sector bets lie:
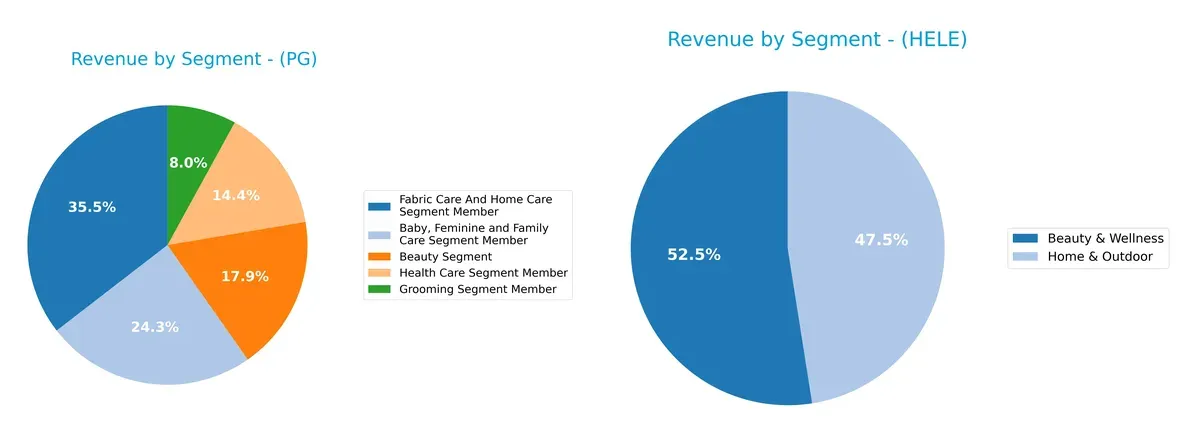
Procter & Gamble commands a broad portfolio with its Fabric Care & Home Care segment anchoring at $29.6B, followed by Baby, Feminine & Family Care at $20.2B. Helen of Troy, by contrast, pivots around two main segments: Beauty & Wellness at $1B and Home & Outdoor at $906M. P&G’s diversification reduces concentration risk and fosters ecosystem lock-in. Helen of Troy’s narrower focus heightens dependence but may allow agility in niche markets.
Strengths and Weaknesses Comparison
This table compares the Strengths and Weaknesses of The Procter & Gamble Company (PG) and Helen of Troy Limited (HELE):
PG Strengths
- Diversified product segments spanning baby care, beauty, fabric care, grooming, and health care
- Strong profitability with 18.95% net margin and 30.71% ROE
- Favorable financial leverage and interest coverage
- Significant global presence with balanced US and non-US revenues
- Solid asset turnover and dividend yield
HELE Strengths
- Favorable valuation multiples with PE 10.25 and PB 0.75
- Strong liquidity ratios: current ratio 2.0 and quick ratio 1.03
- Favorable fixed asset turnover at 5.23
- Presence in diverse geographic markets including US, EMEA, Asia Pacific
- Focus on beauty and home segments with steady revenue
PG Weaknesses
- Low liquidity ratios: current ratio 0.7 and quick ratio 0.49
- Unfavorable price-to-book ratio at 7.52
- Moderate debt-to-equity ratio neutral at 0.68
- Limited growth indicated by neutral PE multiple
- High dependence on US and non-US balance may pose currency risks
HELE Weaknesses
- Lower profitability with 6.49% net margin and 7.35% ROE labeled unfavorable
- Moderate interest coverage at 4.11 and neutral debt position
- No dividend yield, which may limit income investors’ appeal
- Smaller scale and less diversified product base than PG
- Neutral to slightly favorable global ratios suggesting some operational constraints
Overall, PG demonstrates leadership through scale, diversification, and robust profitability, although its weak liquidity and valuation metrics require attention. HELE exhibits strong liquidity and attractive valuation but faces challenges in profitability and scale that may influence its competitive positioning.
The Moat Duel: Analyzing Competitive Defensibility
A structural moat is the only thing protecting long-term profits from the erosion of competition. Here’s how these firms defend theirs:
The Procter & Gamble Company: Brand Power and Scale Moat
P&G’s moat stems from its powerful brands and economies of scale. It sustains high ROIC above WACC by maintaining margin stability and global reach. New product innovation and market expansion in emerging economies deepen this moat in 2026.
Helen of Troy Limited: Niche Product Portfolio with Vulnerable Margins
Helen of Troy relies on a focused product mix and specialized brands, contrasting P&G’s scale. However, its declining ROIC and shrinking margins expose a fragile moat. Growth in health and wellness segments offers some upside if execution improves.
Brand Dominance vs. Niche Vulnerability
P&G commands a wider, deeper moat with consistent value creation and a growing ROIC trend. Helen of Troy’s deteriorating profitability signals a shrinking moat. P&G is clearly better positioned to defend and expand its market share.
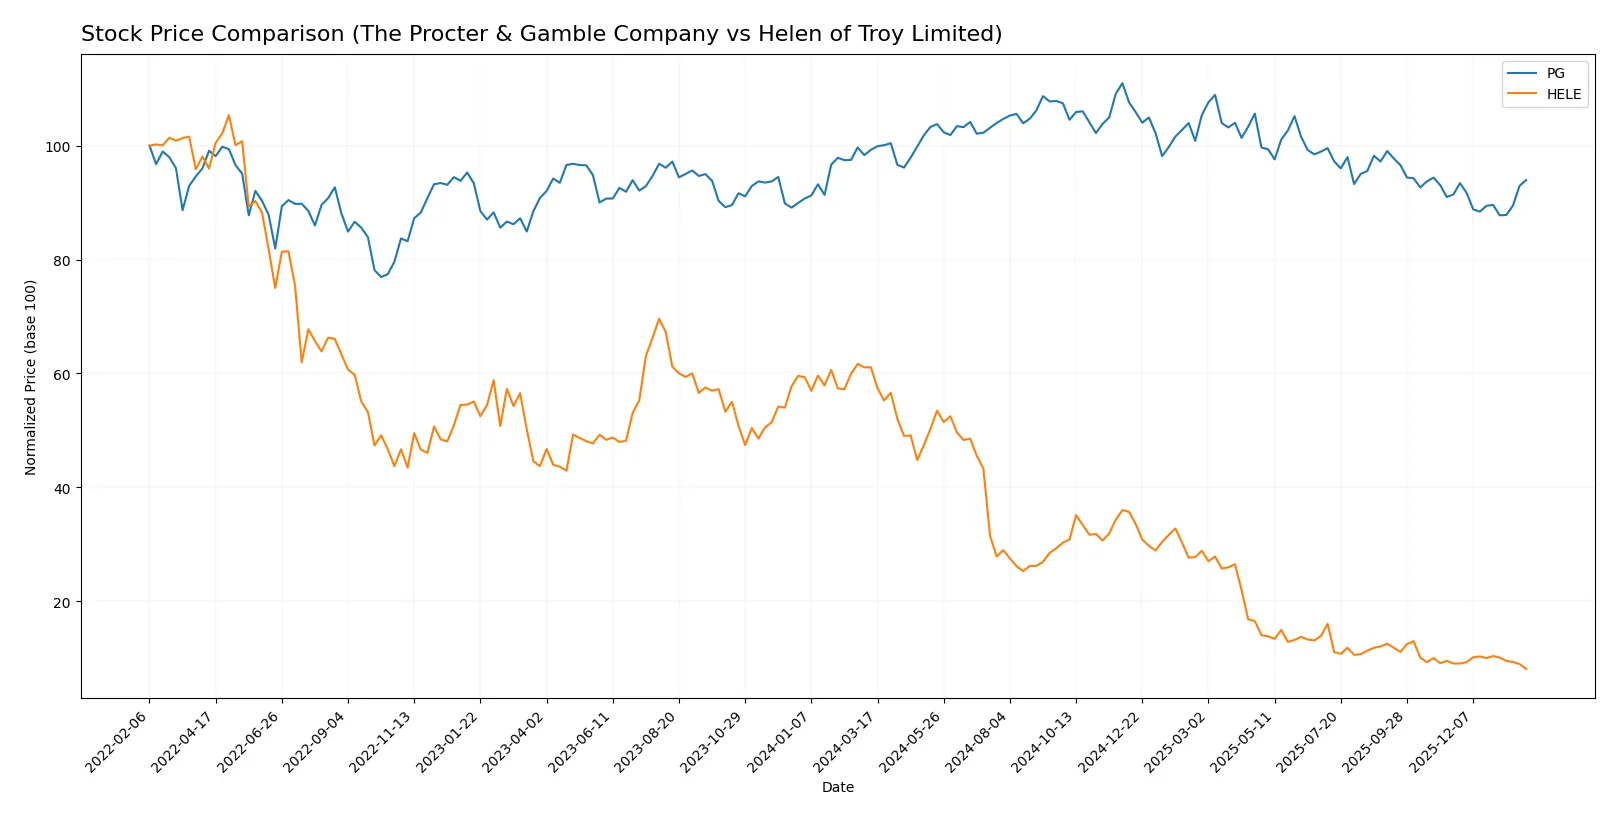
Which stock offers better returns?
The past year reveals contrasting stock price dynamics: The Procter & Gamble Company (PG) shows a bearish trend with recent bullish momentum, while Helen of Troy Limited (HELE) experiences sharp declines accelerating downward.
Trend Comparison
PG’s stock declined 5.35% over the past 12 months, marking a bearish trend with accelerating losses. It hit a high of 179.26 and a low of 141.79 but gained 2.78% in recent months, indicating a mild recovery.
HELE’s stock plunged 86.68% in the same period, an intense bearish trend with accelerating decline. Its volatility is high, swinging between 124.36 and 16.56, with recent losses worsening by 10.49%.
PG’s losses are moderate with signs of recent stabilization, whereas HELE suffers severe depreciation and greater volatility, making PG the higher performer overall.
Target Prices
Analysts present a clear consensus on target prices for The Procter & Gamble Company and Helen of Troy Limited.
| Company | Target Low | Target High | Consensus |
|---|---|---|---|
| The Procter & Gamble Company | 150 | 179 | 165.67 |
| Helen of Troy Limited | 22 | 22 | 22 |
The Procter & Gamble consensus target of 165.67 exceeds the current price of 151.77, suggesting moderate upside. Helen of Troy’s consensus target of 22 is significantly above its current 16.56 price, implying strong expected growth.

Don’t Let Luck Decide Your Entry Point
Optimize your entry points with our advanced ProRealTime indicators. You’ll get efficient buy signals with precise price targets for maximum performance. Start outperforming now!
How do institutions grade them?
The following tables summarize recent institutional grades for both companies:
The Procter & Gamble Company Grades
This table shows recent rating actions by major grading firms on PG:
| Grading Company | Action | New Grade | Date |
|---|---|---|---|
| TD Cowen | Downgrade | Hold | 2026-01-27 |
| UBS | Maintain | Buy | 2026-01-23 |
| JP Morgan | Upgrade | Overweight | 2026-01-23 |
| Wells Fargo | Maintain | Overweight | 2026-01-23 |
| UBS | Maintain | Buy | 2026-01-14 |
| TD Cowen | Maintain | Buy | 2026-01-08 |
| Wells Fargo | Maintain | Overweight | 2026-01-05 |
| JP Morgan | Maintain | Neutral | 2025-12-18 |
| Jefferies | Upgrade | Buy | 2025-12-17 |
| JP Morgan | Maintain | Neutral | 2025-10-27 |
Helen of Troy Limited Grades
This table presents recent rating updates from recognized grading firms on HELE:
| Grading Company | Action | New Grade | Date |
|---|---|---|---|
| Canaccord Genuity | Maintain | Hold | 2026-01-09 |
| UBS | Maintain | Neutral | 2026-01-09 |
| Canaccord Genuity | Maintain | Hold | 2026-01-06 |
| Canaccord Genuity | Maintain | Hold | 2025-10-10 |
| UBS | Maintain | Neutral | 2025-10-10 |
| UBS | Maintain | Neutral | 2025-10-02 |
| UBS | Maintain | Neutral | 2025-07-11 |
| Canaccord Genuity | Downgrade | Hold | 2025-07-11 |
| Canaccord Genuity | Maintain | Buy | 2025-07-07 |
| Canaccord Genuity | Maintain | Buy | 2025-04-25 |
Which company has the best grades?
PG consistently receives stronger ratings, including multiple Buy and Overweight grades. HELE’s grades mostly cluster around Hold and Neutral. Investors may view PG’s higher grades as a signal of better institutional confidence and potential resilience.
Risks specific to each company
The following categories identify the critical pressure points and systemic threats facing both firms in the 2026 market environment:
1. Market & Competition
The Procter & Gamble Company
- Dominates a broad consumer packaged goods market with strong brand moats and diversified product lines.
Helen of Troy Limited
- Faces intense competition in niche consumer segments with less brand power and limited scale.
2. Capital Structure & Debt
The Procter & Gamble Company
- Maintains a moderate debt load (D/E 0.68) with strong interest coverage (23.23x), ensuring financial flexibility.
Helen of Troy Limited
- Slightly lower leverage (D/E 0.57) but weaker interest coverage (4.11x), raising concerns on debt servicing capacity.
3. Stock Volatility
The Procter & Gamble Company
- Exhibits low beta (0.39), reflecting defensive characteristics and lower market sensitivity.
Helen of Troy Limited
- Higher beta (0.78) indicates greater share price volatility and sensitivity to market swings.
4. Regulatory & Legal
The Procter & Gamble Company
- Operates globally with exposure to stringent consumer product regulations but benefits from established compliance frameworks.
Helen of Troy Limited
- Smaller scale limits regulatory burden, but product diversification into health devices could invite more scrutiny.
5. Supply Chain & Operations
The Procter & Gamble Company
- Complex global supply chain vulnerable to disruptions but supported by scale and supplier diversity.
Helen of Troy Limited
- More limited supply chain with potential concentration risks and less bargaining power.
6. ESG & Climate Transition
The Procter & Gamble Company
- Faces high ESG expectations due to size and visibility; invests heavily in sustainability but under pressure for faster progress.
Helen of Troy Limited
- ESG efforts less visible but risk lagging peers; smaller scale limits resources for significant climate initiatives.
7. Geopolitical Exposure
The Procter & Gamble Company
- Broad geographic footprint exposes it to global trade tensions but also diversifies risk.
Helen of Troy Limited
- More regionally concentrated with some international exposure, increasing vulnerability to localized disruptions.
Which company shows a better risk-adjusted profile?
The Procter & Gamble Company shows a stronger risk-adjusted profile. Its dominant market position, low stock volatility, robust interest coverage, and safe Altman Z-score (5.42) illustrate financial resilience. Helen of Troy’s distress-zone Z-score (1.08) and weaker profitability metrics highlight elevated financial risk. The stark contrast in liquidity ratios and Piotroski scores further confirms PG’s superior stability. Helen of Troy’s main concern is its fragile financial health amid competitive pressures, while P&G’s critical risk lies in managing complex global supply chains and ESG demands.
Final Verdict: Which stock to choose?
The Procter & Gamble Company showcases a superpower in durable value creation through its robust and growing ROIC, signaling a strong economic moat. Its point of vigilance remains a low current ratio, hinting at liquidity constraints. PG fits well in portfolios aiming for steady, resilient growth with moderate risk tolerance.
Helen of Troy Limited’s strategic moat lies in its attractive valuation and solid balance sheet liquidity, offering a value play with less financial risk than PG. However, it currently struggles with declining profitability and shrinking returns, making it more suitable for value investors comfortable with turnaround scenarios and higher volatility.
If you prioritize durable competitive advantage and consistent profitability, PG outshines with better stability and long-term value creation. However, if you seek undervalued opportunities with a stronger liquidity cushion and can tolerate performance uncertainty, HELE offers a compelling, albeit riskier, alternative.
Disclaimer: Investment carries a risk of loss of initial capital. The past performance is not a reliable indicator of future results. Be sure to understand risks before making an investment decision.
Go Further
I encourage you to read the complete analyses of The Procter & Gamble Company and Helen of Troy Limited to enhance your investment decisions: