The Estée Lauder Companies Inc. (EL) and Helen of Troy Limited (HELE) are two prominent players in the Household & Personal Products industry, each with unique product portfolios and market strategies. Estée Lauder focuses on premium skincare and cosmetics, while Helen of Troy offers a diverse range of consumer essentials spanning beauty, health, and home products. This article will analyze both companies to identify which presents the most compelling investment opportunity for your portfolio.

Table of contents
Companies Overview
I will begin the comparison between The Estée Lauder Companies Inc. and Helen of Troy Limited by providing an overview of these two companies and their main differences.
The Estée Lauder Companies Inc. Overview
The Estée Lauder Companies Inc. manufactures, markets, and sells a broad range of skincare, makeup, fragrance, and hair care products worldwide. Positioned as a leading player in the household and personal products industry, it operates multiple premium brands and distributes through diverse channels including department stores, specialty retailers, and e-commerce. Founded in 1946 and headquartered in New York, EL has a market cap of 40.7B USD and employs over 44K people.
Helen of Troy Limited Overview
Helen of Troy Limited provides consumer products across Home & Outdoor, Health & Wellness, and Beauty segments in multiple regions including the US, Europe, and Asia Pacific. Its portfolio features brands such as OXO, Hydro Flask, and Braun, distributed through mass merchandisers, specialty stores, and e-commerce. Incorporated in 1968 with headquarters in Texas, HELE’s market cap is approximately 431M USD, supported by a workforce of about 1.9K employees.
Key similarities and differences
Both companies operate in the consumer defensive sector, focusing on household and personal products with international reach and multi-channel distribution. However, EL specializes in premium beauty and skincare brands, while HELE has a more diversified product mix including home goods, health devices, and beauty appliances. EL is substantially larger in market capitalization and workforce size, reflecting its dominant position in luxury personal care compared to HELE’s broader but smaller-scale consumer product offerings.
Income Statement Comparison
The table below presents a factual comparison of key income statement metrics for The Estée Lauder Companies Inc. and Helen of Troy Limited for their most recent fiscal years.

| Metric | The Estée Lauder Companies Inc. | Helen of Troy Limited |
|---|---|---|
| Market Cap | 40.7B | 431M |
| Revenue | 14.3B | 1.91B |
| EBITDA | 193M | 269M |
| EBIT | -636M | 214M |
| Net Income | -1.13B | 124M |
| EPS | -3.15 | 5.38 |
| Fiscal Year | 2025 | 2025 |
Income Statement Interpretations
The Estée Lauder Companies Inc.
From 2021 to 2025, Estée Lauder’s revenue declined by 11.9% overall, with net income dropping sharply by 139.5%. Gross margins remained strong at 73.9%, but operating and net margins turned negative in the latest year. The fiscal 2025 results show a significant downturn, with revenue falling 8.5% and net income registering a loss of $1.13B, signaling deteriorating profitability.
Helen of Troy Limited
Helen of Troy’s revenue decreased by 9.1% over the 2021–2025 period, accompanied by a 51.3% decline in net income. Despite this, gross margin held at a favorable 47.9%, with positive EBIT and net margins of 11.2% and 6.5%, respectively. The 2025 fiscal year reflected a 4.9% revenue drop and a 22.9% contraction in net margin, indicating some margin pressure but remaining profitable.
Which one has the stronger fundamentals?
Helen of Troy demonstrates stronger fundamentals with consistently positive EBIT and net margins and manageable interest expenses. Conversely, Estée Lauder reported negative net and EBIT margins in 2025, with significant declines in profitability and earnings. Both companies faced revenue and income declines, but Helen of Troy sustains more favorable margin metrics and operating income stability.
Financial Ratios Comparison
The table below presents the most recent financial ratios for The Estée Lauder Companies Inc. and Helen of Troy Limited, reflecting their fiscal year 2025 performance.
| Ratios | The Estée Lauder Companies Inc. (EL) | Helen of Troy Limited (HELE) |
|---|---|---|
| ROE | -29.3% | 7.4% |
| ROIC | 6.4% | 5.3% |
| P/E | -25.7 | 10.2 |
| P/B | 7.53 | 0.75 |
| Current Ratio | 1.30 | 2.00 |
| Quick Ratio | 0.92 | 1.03 |
| D/E | 2.44 | 0.57 |
| Debt-to-Assets | 47.5% | 30.7% |
| Interest Coverage | 2.37 | 2.75 |
| Asset Turnover | 0.72 | 0.61 |
| Fixed Asset Turnover | 2.79 | 5.23 |
| Payout ratio | -54.5% | 0% |
| Dividend yield | 2.12% | 0% |
Interpretation of the Ratios
The Estée Lauder Companies Inc.
The Estée Lauder Companies Inc. shows a mixed ratio profile with several unfavorable indicators, including a negative net margin of -7.93% and a deeply negative ROE at -29.31%, suggesting profitability challenges. Neutral ratings appear in ROIC and liquidity ratios, but a high debt-to-equity ratio of 2.44 and negative interest coverage highlight financial risk. The company pays dividends with a 2.12% yield, but coverage by free cash flow seems strained, raising concerns about sustainability.
Helen of Troy Limited
Helen of Troy Limited exhibits a generally stronger ratio set with a positive net margin of 6.49% and a modest ROE of 7.35%, though the latter is still marked unfavorable. The company benefits from favorable WACC, P/E, P/B, and liquidity ratios, indicating solid financial health and operational efficiency. Helen of Troy does not pay dividends, likely focusing on reinvestment and growth, which aligns with its neutral to favorable financial metrics and absence of payout-related risks.
Which one has the best ratios?
Helen of Troy Limited presents a more favorable financial ratio profile than The Estée Lauder Companies Inc., with a higher proportion of favorable indicators and fewer unfavorable marks. Estée Lauder’s weak profitability and financial leverage ratios detract from its overall standing, while Helen of Troy’s balance of solid margins, valuation, and liquidity suggests a healthier financial position as of 2025.
Strategic Positioning
This section compares the strategic positioning of The Estée Lauder Companies Inc. (EL) and Helen of Troy Limited (HELE) including Market position, Key segments, and exposure to disruption:
The Estée Lauder Companies Inc.
- Leading global player in personal products, facing intense competition in beauty sector.
- Focuses on skin care, makeup, fragrance, and hair care; driven by premium beauty brands.
- Exposure to technological disruption is moderate, centered on evolving beauty product innovation and consumer trends.
Helen of Troy Limited
- Smaller cap with diversified consumer products, competing in multiple household and wellness markets.
- Operates in Home & Outdoor, Health & Wellness, and Beauty segments with broad product categories.
- Faces disruption risks across health devices and home products, requiring adaptation to tech-driven market changes.
The Estée Lauder Companies Inc. vs Helen of Troy Limited Positioning
EL’s concentrated focus on premium beauty contrasts with HELE’s diversified consumer product portfolio across wellness and home segments. EL benefits from brand strength but faces competitive pressure, while HELE’s breadth spreads risk but may dilute market focus.
Which has the best competitive advantage?
Both EL and HELE exhibit very unfavorable MOAT evaluations with declining ROIC trends, indicating value destruction. Neither shows a sustainable competitive advantage based on recent capital efficiency metrics.
Stock Comparison
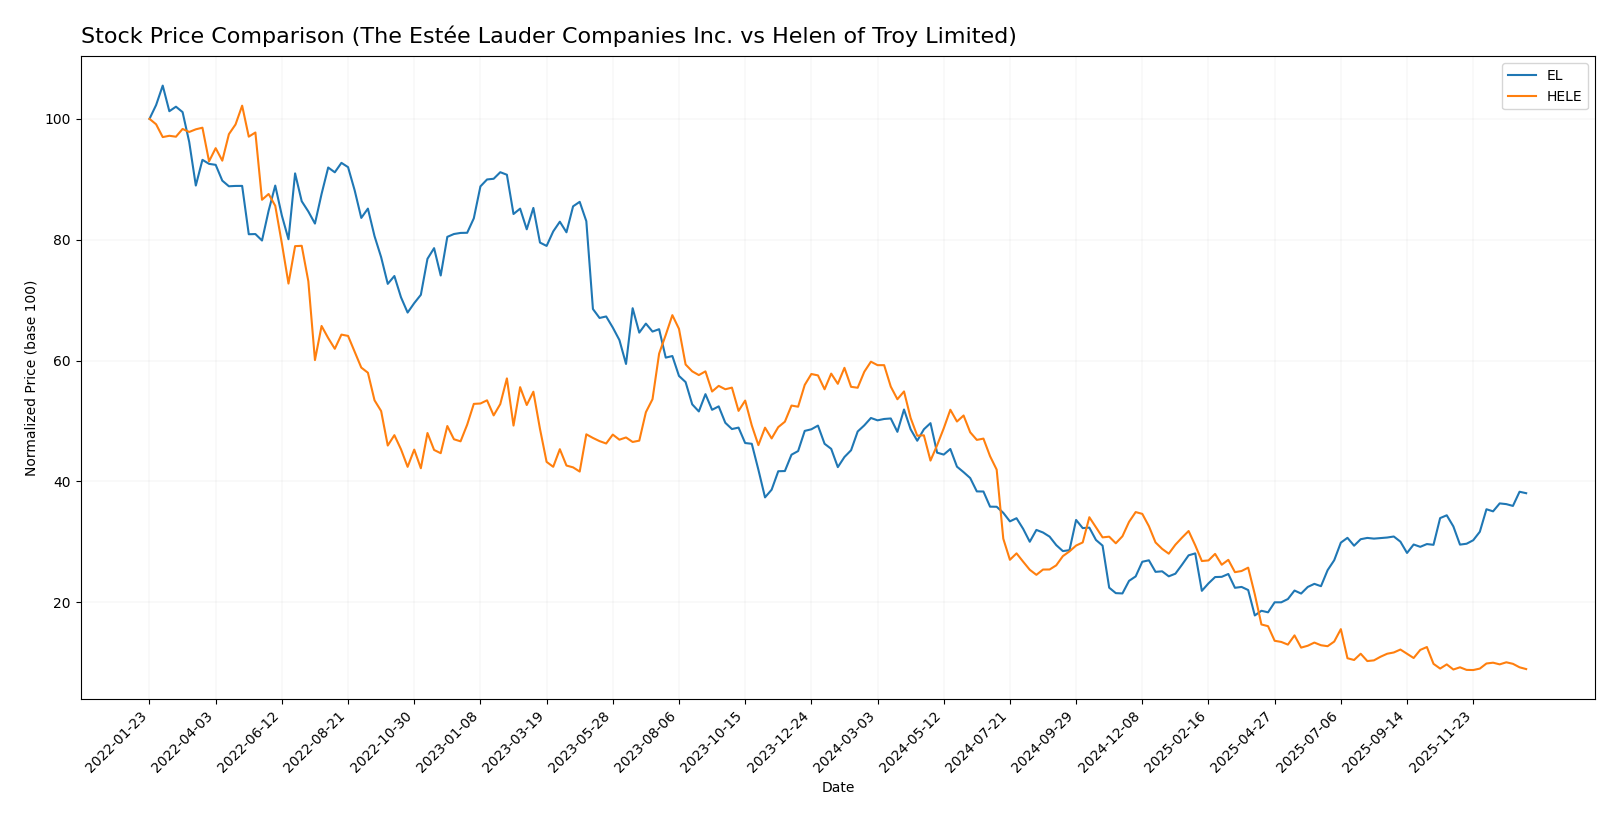
The stock price movements of The Estée Lauder Companies Inc. and Helen of Troy Limited over the past year reveal pronounced bearish trends with acceleration, alongside recent shifts indicating contrasting momentum in trading dynamics.
Trend Analysis
The Estée Lauder Companies Inc. experienced a 24.65% price decline over the last 12 months, marking a bearish trend with accelerating downward momentum and a high price volatility reflected by a 25.16 std deviation.
Helen of Troy Limited’s stock price dropped sharply by 85.04% during the same period, also bearish with accelerating decline and higher volatility at a 31.1 std deviation, showing more severe negative performance.
Comparing both, The Estée Lauder Companies Inc. delivered a stronger market performance, with a less severe price drop and a recent bullish rebound of 16.89%, whereas Helen of Troy Limited’s recent trend remains nearly flat at 0.81%.
Target Prices
The current analyst consensus presents a clear outlook on the target prices for The Estée Lauder Companies Inc. and Helen of Troy Limited.
| Company | Target High | Target Low | Consensus |
|---|---|---|---|
| The Estée Lauder Companies Inc. | 130 | 70 | 106.67 |
| Helen of Troy Limited | 22 | 22 | 22 |
Analysts expect The Estée Lauder stock to trade slightly below its current price of $113.02, indicating moderate upside potential. Helen of Troy’s consensus target of $22 suggests an upside from its current price of $18.78.
Analyst Opinions Comparison
This section compares analysts’ ratings and grades for The Estée Lauder Companies Inc. (EL) and Helen of Troy Limited (HELE):
Rating Comparison
EL Rating
- Rating: D+, considered very favorable overall.
- Discounted Cash Flow Score: 2, indicating a moderate valuation assessment.
- ROE Score: 1, rated very unfavorable for profitability from equity.
- ROA Score: 1, rated very unfavorable for asset utilization efficiency.
- Debt To Equity Score: 1, rated very unfavorable for financial stability.
- Overall Score: 1, reflecting a very unfavorable aggregate rating.
HELE Rating
- Rating: B, considered very favorable overall.
- Discounted Cash Flow Score: 5, indicating a very favorable valuation assessment.
- ROE Score: 1, rated very unfavorable for profitability from equity.
- ROA Score: 1, rated very unfavorable for asset utilization efficiency.
- Debt To Equity Score: 4, rated favorable for financial stability.
- Overall Score: 3, reflecting a moderate aggregate rating.
Which one is the best rated?
Helen of Troy Limited (HELE) holds a better overall rating and stronger scores in discounted cash flow and debt-to-equity metrics, indicating a more favorable financial assessment compared to The Estée Lauder Companies Inc. (EL).
Scores Comparison
Here is the comparison of the Altman Z-Score and Piotroski Score for the two companies:
EL Scores
- Altman Z-Score: 3.11, indicating a safe zone status, low bankruptcy risk.
- Piotroski Score: 5, representing an average financial strength.
HELE Scores
- Altman Z-Score: 1.10, indicating distress zone status, high bankruptcy risk.
- Piotroski Score: 3, classified as very weak financial strength.
Which company has the best scores?
Based strictly on the provided data, EL shows a safer financial position with a higher Altman Z-Score and a stronger Piotroski Score compared to HELE, which is in distress and has very weak financial strength.
Grades Comparison
The following presents the latest grades from recognized financial institutions for the two companies:
The Estée Lauder Companies Inc. Grades
The table below summarizes recent grade changes from well-known grading companies for EL:
| Grading Company | Action | New Grade | Date |
|---|---|---|---|
| Wells Fargo | Maintain | Equal Weight | 2026-01-05 |
| Raymond James | Upgrade | Strong Buy | 2026-01-05 |
| Citigroup | Maintain | Neutral | 2025-12-17 |
| Evercore ISI Group | Maintain | Outperform | 2025-12-16 |
| Rothschild & Co | Downgrade | Sell | 2025-11-25 |
| Argus Research | Upgrade | Buy | 2025-11-11 |
| JP Morgan | Maintain | Overweight | 2025-10-31 |
| Telsey Advisory Group | Maintain | Market Perform | 2025-10-31 |
| UBS | Maintain | Neutral | 2025-10-31 |
| RBC Capital | Maintain | Outperform | 2025-10-31 |
The overall trend in EL’s grades shows a mixed sentiment with multiple holds and upgrades, but also a notable recent downgrade.
Helen of Troy Limited Grades
The table below shows the recent grading activity from established firms for HELE:
| Grading Company | Action | New Grade | Date |
|---|---|---|---|
| UBS | Maintain | Neutral | 2026-01-09 |
| Canaccord Genuity | Maintain | Hold | 2026-01-09 |
| Canaccord Genuity | Maintain | Hold | 2026-01-06 |
| UBS | Maintain | Neutral | 2025-10-10 |
| Canaccord Genuity | Maintain | Hold | 2025-10-10 |
| UBS | Maintain | Neutral | 2025-10-02 |
| Canaccord Genuity | Downgrade | Hold | 2025-07-11 |
| UBS | Maintain | Neutral | 2025-07-11 |
| Canaccord Genuity | Maintain | Buy | 2025-07-07 |
| Canaccord Genuity | Maintain | Buy | 2025-04-25 |
HELE’s grades indicate a generally cautious stance, with a majority of hold and neutral ratings and few upgrades or downgrades.
Which company has the best grades?
The Estée Lauder Companies Inc. has received a broader range of grades, including several buy and outperform ratings alongside some downgrades, showing mixed but active analyst interest. Helen of Troy Limited’s grades are more concentrated around hold and neutral, suggesting a more conservative outlook. Investors may interpret EL’s varied grades as signals of potential volatility or opportunity, while HELE’s consistent holds imply stable but limited momentum.
Strengths and Weaknesses
Below is a comparative table highlighting key strengths and weaknesses of The Estée Lauder Companies Inc. (EL) and Helen of Troy Limited (HELE) based on the most recent financial and strategic data available.
| Criterion | The Estée Lauder Companies Inc. (EL) | Helen of Troy Limited (HELE) |
|---|---|---|
| Diversification | Strong product diversification with Skin Care (6.96B), Makeup (4.21B), Fragrance (2.49B), and Hair Care (565M) segments | Moderate diversification mainly in Beauty & Wellness (1.0B) and Home & Outdoor (906M) segments |
| Profitability | Negative net margin (-7.93%) and ROE (-29.31%), neutral ROIC (6.44%) with declining profitability | Positive net margin (6.49%), slightly unfavorable ROE (7.35%), neutral ROIC (5.32%), showing better profitability discipline |
| Innovation | Large investments in Skin Care and Makeup suggest innovation focus but declining ROIC signals challenges in value creation | Moderate innovation with focus on Beauty & Wellness; ROIC declining but less severe, indicating some innovation efforts |
| Global presence | Established global brand with broad international market share in luxury cosmetics | Strong presence in North America with growing segments but smaller global footprint |
| Market Share | Leading market share in luxury skincare and makeup with multi-billion revenues | Smaller market share concentrated in niche personal and home care markets |
Key takeaways: Estée Lauder’s broad product portfolio and global brand presence are significant strengths, but recent profitability and value creation have declined sharply. Helen of Troy shows better profitability metrics and more stable financial ratios, though with less diversification and global reach. Investors should weigh EL’s scale against HELE’s healthier margins and more favorable financial ratios.
Risk Analysis
Below is a comparative table highlighting key risks for The Estée Lauder Companies Inc. (EL) and Helen of Troy Limited (HELE) based on their latest 2025 data.
| Metric | The Estée Lauder Companies Inc. (EL) | Helen of Troy Limited (HELE) |
|---|---|---|
| Market Risk | Beta 1.15 indicates moderate market volatility exposure | Beta 0.78 suggests lower market volatility exposure |
| Debt Level | High debt-to-equity ratio (2.44) signals elevated leverage risk | Moderate debt-to-equity ratio (0.57) shows manageable leverage |
| Regulatory Risk | Global operations expose EL to varying cosmetics regulations | Diverse product segments face regulatory scrutiny, but less global complexity |
| Operational Risk | Complex brand portfolio increases operational and supply chain risks | Smaller scale and fewer brands lower operational complexity |
| Environmental Risk | Industry pressure for sustainability; EL investing in eco-friendly products | Moderate exposure; health and wellness segment may face environmental regulations |
| Geopolitical Risk | Significant global footprint increases exposure to geopolitical tensions | Primarily US-focused, lower geopolitical risk |
In synthesis, EL carries higher market and debt risks due to its size and leverage, with operational complexity adding to potential vulnerabilities. HELE exhibits lower financial and market risks but faces challenges with weaker financial health scores and less diversification. EL’s negative net margin and unfavorable debt coverage highlight caution, while HELE’s distress zone Altman Z-score signals financial distress risk despite favorable leverage. Investors should weigh EL’s global exposure and financial strain against HELE’s financial fragility.
Which Stock to Choose?
The Estée Lauder Companies Inc. (EL) has experienced declining income with negative net and EBIT margins, reflecting reduced profitability and a deteriorating income statement over 2021-2025. Its financial ratios are slightly unfavorable, marked by high debt and negative returns on equity, while its rating is very favorable.
Helen of Troy Limited (HELE) shows a less negative income evolution with positive EBIT and net margins, though revenue and net income have declined overall. Its financial ratios are slightly favorable with moderate debt, and it holds a very favorable rating supported by a safer balance sheet despite weak profitability metrics.
Investors prioritizing growth and long-term value creation might see EL’s very favorable rating but should consider its unfavorable income and ratio trends. Conversely, HELE’s slightly favorable ratios and stable rating could appeal to more risk-averse profiles seeking moderate financial stability amidst declining profits.
Disclaimer: Investment carries a risk of loss of initial capital. The past performance is not a reliable indicator of future results. Be sure to understand risks before making an investment decision.
Go Further
I encourage you to read the complete analyses of The Estée Lauder Companies Inc. and Helen of Troy Limited to enhance your investment decisions: